ⓒ2007 The Korean Nutrition Society and the Korean Society of Community Nutrition
Identification of weight-control behaviors practiced by diverse groups of college students
Soo-Kyung Lee 1 , Debra Palmer Keenan 2§ and Ho Kyung Ryu 3
1
Healthy City Team, Division of Health Promotion, Seoul Metropolitan Government, Seoul 100-739, Korea
2
Department of Nutritional Sciences, Rutgers, The State University of New Jersey, 26 Nichol Ave. New Brunswick, NJ 08901, USA
3
Department of Food Science & Nutrition, Pusan National University, KyungNam 627-706, Korea
Received June 27, 2007; Revised August 2, 2007; Accepted September 1, 2007
Abstract
This study investigated: 1) what weight-related behaviors college students practiced; 2) if the behaviors were performed for weight-related reasons;
and 3) whether the behavioral practices differed by gender, race, and body weight status. This cross-sectional study used a questionnaire to collect information from a non-probability sample of undergraduate students (n=379; 48% men) recruited from large introductory psychology classes. Chi-square tests were conducted to examine simple comparisons, and multiple logistic regression analyses assessed differences. Male students reported adopting significantly fewer weight-related behaviors than females. Most frequently males increased exercise (69.2%), increased fruit and vegetable consumption (50%), skipped meals (46%), cut out sweets and junk foods (40%), and cut out between-meal snacks (35%). Female students most frequently increased exercise (67.4%), skipped meals (63%), increased fruit and vegetable consumption (62%), reduced the amount of food eaten (60%), and cut out between-meal snacks (51%). Negative behaviors were engaged in by only a few participants. Weight-related reasons were a significant factor for weight-related behavior adoption. Multiple logistic regression analyses showed that gender was consistently and significantly associated with the adoption of weight-related behaviors, while race and weight status were less consistently associated. Findings of this study will be helpful to dietitians who counsel college students. Results of this study may support efforts to bring more comprehensive behaviorally-focused health and nutrition interventions to college campuses.
Key Words: Health behaviors, college students, race, gender, body weight
Introduction 10)
Obesity has become one of the most significant public health issues (Healthy People 2010, 2000; Office of the Surgeon Gen- eral, 2001). According to the estimate from the 2001~2002 National Health and Nutrition Examination Survey, 65.7% of adult Americans are considered to be overweight or obese; and, 30.6% are obese (Hodley et al., 2004). This is a significant increase from the last decade (CDC, 1997a). The obesity epide- mic differentially affects racial/ethnic groups. Compared to non- Hispanic white women, non-Hispanic Black women and Mexi- can-American women exhibit a consistently higher prevalence of overweight and obesity (Hodley et al., 2004). This disparity is not evident among adult men. Although Asian Americans are believed to have a lower prevalence of overweight and obesity, there are no nationally representative data on Asian Americans at this time. Despite significant racial/ethnic differences in body weight, racial/ethnic differences in weight-related behaviors have not been well studied. The Healthy People 2010 goals set the target prevalence of obesity at 15% (Healthy People 2010, 2000),
which is approximately half its current prevalence estimate.
Although overweight and obesity have reached epidemic pro- portions, particularly among females from certain racial/ethnic backgrounds, it is encouraging that strong prevention and treatment initiatives for improving these conditions nationally have garnered attention and effort.
Colleges and universities have been recognized as potentially effective settings for health promotion because of their ability to reach a large proportion of young adults (CDC, 1997b; Lowry et al., 2000). The 2000 Census showed that more than one third of young adults, aged 20-24, were enrolled in college (US Census Bureau, 2003). In addition, college often initiates self-sufficient living, i.e., during these years young adults start to build their own lifestyles, making independent choices away from parental influences. Thus, lifestyle behaviors established during the college years could have lasting impacts on students’ health in subsequent years, and interventions performed with college students may result in meaningful, positive, life-long changes in health behaviors.
In 1995, as part of Youth Risk Behavior Surveillance, the
§
Corresponding Author: Debra Palmer Keenan, Tel. 732-932-9853, Fax. 732-932-6522, Email. [email protected]
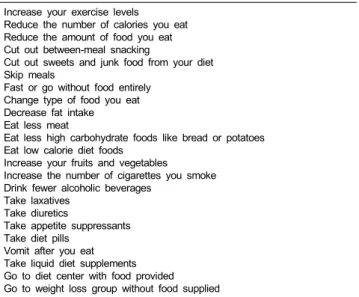
Table 1. The weight-related behaviors assessed Increase your exercise levels
Reduce the number of calories you eat Reduce the amount of food you eat Cut out between-meal snacking
Cut out sweets and junk food from your diet Skip meals
Fast or go without food entirely Change type of food you eat Decrease fat intake Eat less meat
Eat less high carbohydrate foods like bread or potatoes Eat low calorie diet foods
Increase your fruits and vegetables Increase the number of cigarettes you smoke Drink fewer alcoholic beverages
Take laxatives Take diuretics
Take appetite suppressants Take diet pills
Vomit after you eat Take liquid diet supplements Go to diet center with food provided Go to weight loss group without food supplied
Center for Disease Control and Prevention examined a repre- sentative sample of college students via the National College Health Survey (CDC, 1997b). The survey assessed a wide range of variables, from smoking to physical activity. The national survey revealed that 20.5% of the college students were overweight, and 73.7% failed to eat five or more fruits and vegetables daily. The data also showed that nearly half of the college students were trying to lose weight and that many students, 54% of the female students and 41% of the male students, reported they participated in both diet and physical activity for weight management (Lowry et al., 2000).
However, limited information is currently available regarding what dietary and physical activity behaviors are practiced among college students specifically for weight-related reasons. The health disparities associated with gender and race, have also not been clearly defined among college students.
Therefore, this study investigated: 1) what weight-related behaviors college students practiced; 2) if the behaviors were performed specifically for weight-related reasons; and 3) whether the behavioral practices differed by gender, race, and body weight status.
Subjects and Methods
This cross-sectional study was conducted after the University Institutional Review Board approved the research protocol.
Sample and data collection
A non-probability sample of 474 college students in a state university on the East coast were recruited from large intro- ductory psychology classes. The participants received one experimental credit for the psychology class for completing the questionnaire. After careful screening of the completed ques- tionnaires, 95 questionnaires were excluded because of missing
values on the main study measures, leaving a total of 379 questionnaires in the analytical sample. The characteristics of those who were excluded did not significantly differ from those who were included.
Measures
A total of 23 behaviors (Table 1) were selected for assessment, based on their relevance to obesity and to college-aged indi- viduals. Participants were asked to indicate whether they practiced changes in the selected behaviors in the past year. Those who indicated they engaged in the weight-related behaviors were asked if they adopted the behaviors for weight-related reasons.
Body mass index (BMI) was used as the measure of weight status, and calculated using students’ self-reported heights and weights. Body mass index (BMI, weight in Kg/height in m
2) has been used as an index of adiposity (Gibson, 1990). Individuals with BMIs lower than 18.5 were classified as “underweight”, those with BMIs of 18.5 to 24.9 were classified as “normal,”
those with BMIs of 25 to 29.9 were classified as “overweight,”
and those with BMIs of 30 or over were classified as “obese (WHO, 1995).”
Race was attained by asking if the participants were non- Hispanic white, non-Hispanic African American, American Indian/Alaskan, Hispanic, Asian, or “Other.” Inclusion of “Non- Hispanics” allowed consideration of ethnicity; however, the term
“race” will be used throughout this paper for simplicity. Since there was only one student who identified herself as American Indian/Alaskan, this category was collapsed with the “Other”
category in the logistic regression analysis. Non-Hispanic white was used as a reference category in multiple logistic regressions.
Gender was a dichotomous variable with woman coded as “1,”
compared to the reference category, man.
Controlling variables included parental socioeconomic status, which was indirectly assessed by asking for parents’ educational levels and by having students’ rate their parents’ income levels as low, lower-middle, middle, upper-middle, or high.
Statistical analysis
Descriptive statistics, such as frequencies, t-test, and chi-square tests, were used to characterize the participants and their be- havioral practices. Multiple logistic regressions were conducted to examine if there were significant differences in health behavior changes by gender, ethnicity, and/or body weight status. All ana- lyses were conduced with SAS ver. 8 for Windows (Cary, NC).
Results
Participant characteristics
Approximately equal numbers of female and male students
were included in the analytical sample (Table 2). The average
age of the participants was 19, suggesting most participants were
Table 2. Participant characteristics
Total (n=379)
Men 182 (48%)
Women 197 (52%) Age (mean years ± SD) 18.95 ± 1.31 19.04 ± 1.38 18.87 ± 1.25 Race (n (%))
Non-Hispanic White
Non-Hispanic African American Hispanic
Asian American American Indian/Alaskan Other
176 (46.81) 23 ( 6.12) 28 ( 7.45) 135 (35.90) 1 ( 0.27) 13 ( 3.46)
93 (51.38) 6 ( 3.31) 12 ( 5.63) 66 (36.47) 0 ( 0.00) 4 ( 2.21)
83 (42.56) 17 ( 8.72) 16 ( 8.21) 69 (35.39) 1 ( 0.51) 9 ( 4.62) Mother’s education (n (%))
Elementary school Middle school
High school Diploma or GED Some vocational/trade school Associate degree
Some college Bachelor’s degree
2 ( 0.53) 10 ( 2.67) 103 (27.47) 29 ( 7.73) 21 ( 5.60) 62 (16.53) 148 (39.47)
2 ( 1.12) 3 ( 1.68) 53 (29.61) 12 ( 6.70) 11 ( 6.15) 37 (20.67) 61 (34.08)
0 ( 0.0 ) 7 ( 3.57) 50 (25.51) 17 ( 8.67) 10 ( 5.10) 25 (12.76) 87 (44.39) Father’s education (n (%))
Elementary school Middle school
High school Diploma or GED Some vocational/trade school Associate degree
Some college Bachelor’s degree
6 ( 1.63) 12 ( 3.25) 81 (22.01) 25 ( 6.79) 17 ( 4.62) 54 (14.67) 173 (47.01)
3 ( 1.71) 5 ( 2.86) 35 (20.00) 13 ( 7.43) 7 ( 4.00) 31 (17.71) 81 (46.29)
3 ( 1.55) 7 ( 3.63) 46 (23.83) 12 ( 6.22) 10 ( 5.18) 23 (11.92) 92 (47.67) Parent’s income level (n (%))
1)Low Lower middle Middle Upper middle High
13 ( 3.48) 44 (11.76) 161 (43.05) 131 (35.03) 25 ( 6.68)
5 ( 2.78) 24 (13.33) 65 (36.11) 75 (41.67) 11 ( 6.11)
8 ( 4.12) 20 (10.31) 96 (49.48) 56 (28.87) 14 ( 7.22) BMI (mean ± SD)
<18.5
2)(n (%)) 18.5-25 25-30
<30
23.53 ± 4.62 28 ( 7.99) 242 (63.85) 80 (21.11) 29 ( 7.65)
24.67 ± 5.08
a9 ( 4.95) 99 (54.40) 54 (29.67) 20 (10.99)
22.48 ± 3.88
b19 ( 9.64) 143 (72.59) 26 (13.20) 9 ( 4.57) Number of Adopted Behaviors (mean ± SD)
Made no behavior changes (n (%))
5.53 ± 3.84 20 ( 5.28)
4.44 ± 3.29
a12 ( 6.59)
6.54 ± 4.03
b8 ( 4.06)
1)
Gender was significantly associated with parents’ income level. (χ
2=9.63, p=0.0471)
2)
Gender was significantly associated with weight status. (χ
2=24.99, p<0.0001)
a,b
Significantly different at α=0.05 by t-test
Fig. 1. Percent of participants engaged in the behaviors by gender
Fig. 2. Percent participants engaged in the behaviors for weight-related reasons
freshmen or sophomores, as was expected by drawing a non- probability sample from introductory psychology courses. About half of the participants identified themselves as non-Hispanic white, and approximately one third identified themselves as Asian. Participating students described their parents’ socioe- conomic status as middle or higher with more than 80% in middle or upper income levels and more than 57% of their mother and 62% of their father having a Bachelor’s degree or some college education. Male students were more likely to be overweight or obese than female students, with 30% and 11% reporting heights and weights that classified them as overweight and obese, respectively; compared to 13% and 5% respectively, among the females.
The participants reported they had engaged in, on average, five to six weight-related behaviors in the past year. Female students had engaged in significantly more behaviors than male students.
1) What weight-related behaviors did college students most frequently practice?
Increasing the exercise level was the behavior most frequently
reported by both female (65%) and male (68%) students (Figure
1). All other weight-related behaviors assessed were more
frequently practiced among female students. Skipping meals
(63%), increasing fruit and vegetable consumption (62%),
reducing the amount of food eaten (60%), and cutting out
between-meal snacks (51%) were the next most frequently
reported responses among female students. The order of the most
frequently practiced behaviors reported by male students differed,
and was: increasing fruit and vegetable consumption (50%),
skipping meals (46%), cutting out sweets and junk food from
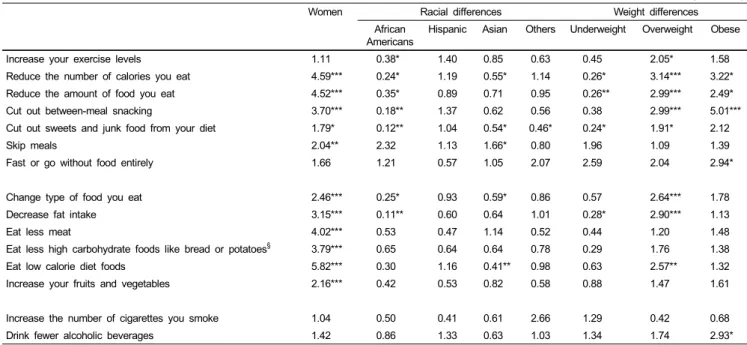
Table 3. Logistic regression on the health behaviors
1) 2) 3)(odds ratio)
Women Racial differences Weight differences
African Americans
Hispanic Asian Others Underweight Overweight Obese
Increase your exercise levels 1.11 0.38* 1.40 0.85 0.63 0.45 2.05* 1.58
Reduce the number of calories you eat 4.59*** 0.24* 1.19 0.55* 1.14 0.26* 3.14*** 3.22*
Reduce the amount of food you eat 4.52*** 0.35* 0.89 0.71 0.95 0.26** 2.99*** 2.49*
Cut out between-meal snacking 3.70*** 0.18** 1.37 0.62 0.56 0.38 2.99*** 5.01***
Cut out sweets and junk food from your diet 1.79* 0.12** 1.04 0.54* 0.46* 0.24* 1.91* 2.12
Skip meals 2.04** 2.32 1.13 1.66* 0.80 1.96 1.09 1.39
Fast or go without food entirely 1.66 1.21 0.57 1.05 2.07 2.59 2.04 2.94*
Change type of food you eat 2.46*** 0.25* 0.93 0.59* 0.86 0.57 2.64*** 1.78
Decrease fat intake 3.15*** 0.11** 0.60 0.64 1.01 0.28* 2.90*** 1.13
Eat less meat 4.02*** 0.53 0.47 1.14 0.52 0.44 1.20 1.48
Eat less high carbohydrate foods like bread or potatoes
§3.79*** 0.65 0.64 0.64 0.78 0.29 1.76 1.38
Eat low calorie diet foods 5.82*** 0.30 1.16 0.41** 0.98 0.63 2.57** 1.32
Increase your fruits and vegetables 2.16*** 0.42 0.53 0.82 0.58 0.88 1.47 1.61
Increase the number of cigarettes you smoke 1.04 0.50 0.41 0.61 2.66 1.29 0.42 0.68
Drink fewer alcoholic beverages 1.42 0.86 1.33 0.63 1.03 1.34 1.74 2.93*
1)
The behaviors not listed in this table were not able to fit to the logistic models because of few number of participants engaged in the behaviors.
2)
The logistic regression model also controlled for mother’s education, father’s education, and parents’ income.
3)
Referece categories in the regression models were “men,” “white,” and “normal weight.”
§