Effects of isoflavone supplementation on the bone mineral density of growing female rats
Hyun-Ju Jo §1 and Mi-Ja Choi 2
1
Department of Medicinal Food & Health, World Cyber College, Gyeonggi 464-895, Korea
2
Department of Food and Nutrition, Keimyung University, Daegu 704-701, Korea
Received May 14, 2008; Revised June 9, 2008; Accepted June 13, 2008
Abstract
This study was focused on whether or not isoflavones affect the increase in bone mineral density of growing females. Female Sprague-Dawley rats (60 ± 5 g) were randomly assigned to two groups and provided control diets (control group) or isoflavone-supplemented diet (IF group, 57.8 mg isoflavones/100 g diet) for 9 weeks in growing female rats. Measurements of Bone Mineral Density (BMD) and Bone Mineral Content (BMC) on the experimental animals were executed in the 3
rd, 6
th, 9
thweeks. In result, there was no significant difference in spine BMD between the isoflavones supplemented group and the control group. But, the IF group tended to have higher BMD than the control group in between 3 and 9 experimental weeks, and the striking difference could be shown in the 6
thweek of feeding. In case of femur BMD, the effects of added isoflavones appeared in the 6
thweek of feeding, and it became intensified in the 9
thweek of feeding to the extent that the BMD in the IF group was significantly higher than that of the control group (p<0.05). In conclusion, isoflavone supplementation increased spine BMD per weight in the 6
thweek of feeding, and affected the increase of femur BMD in the 9
thweek. The result of the experiment implies that it affects positively the formation of spine and femur BMD of growing female rats. The study also suggests that the effects of isoflavone on the pattern of BMD formation might differ from the parts of bones.
Key Words: Isoflavones, growing female rat, bone mineral density (BMD), bone mineral content (BMC)
Introduction 3)
Epidemiological studies suggest that the low incidence of osteoporosis and heart diseases caused by estrogen deficiency in Asian women is attributable to their high intake of soy foods, compared with American and Finnish women (Adlercreutz et al., 1992; Anderson et al., 1995; Brandi, 1997). It is reported that dietary soybean proteins prevent bone loss in ovariectomized (OVX) rats (Arjmandi et al., 1996). Possible candidates for the beneficial substances present in soybeans are isoflavones, such as genistein and daidzein (Ishimi et al., 1999). Isoflavones are estrogen-like substances structurally and functionally similar to 17 β-estradiol (Knight & Eden, 1996). On the basis of evidence primarily from animal and in vitro studies, isoflavones are thought to exert both estrogenic and antiestrogenic effects, depending on the tissue in which they act (Makela et al., 1994).
Isoflavones may exert a weak antagonistic effect on the estrogen receptor (Makela et al., 1994), thereby having an antiestrogenic effect on uterine and breast tissue (Santell et al., 1994), where excess estrogen may stimulate synthesis. Alternatively, isofl- avones may combine with the estrogen receptor, albeit with lower affinity than 17 β-estradiol (Miksicek, 1994), and stimulate
estrogen activity, thus having an estrogenic effect on bone (Makela et al., 1994) and blood vessels (Schonherr et al., 1997).
Recent studies (Eriksen et al., 1998; Oursler et al., 1991) have shown that phytoestrogen has a higher binding affinity to estrogen receptor-β than to estrogen receptor-α. It is suggested that the possibility of isoflavones having a tissue-selective effect is high, since isoflavones may function more selectively on such organs as the thyroid gland, bones and blood vessels, where estrogen receptor-β is highly dispersed (Kuiper et al., 1998 ).
Some in vitro studies have suggested that isoflavones may have anti-estrogenic effects and estrogenic effects at the same time (Jayagopal et al., 2002; Lees & Ginn, 1998). The studies report that isoflavones may not be good for growing and young women, for they would reduce the activation of endogenous estrogen (Jayagopal et al., 2002).
On the contrary, according to some recent studies, isoflavone intake in infancy through soy-based infant formulas may have positive effects in the long term, as it may prevent hormone- dependent diseases such as cancer, osteoporosis, cardiovascular diseases, etc. that can be developed in the latter part of adulthood (Setchel et al., 1998). Disputes over the theory still remain unsettled, though. There is no concrete result on whether or not
§
Corresponding Author: Hyun-Ju Jo, Tel. 82-31-529-0000, Fax. 82-31-726-3092, Email. [email protected]
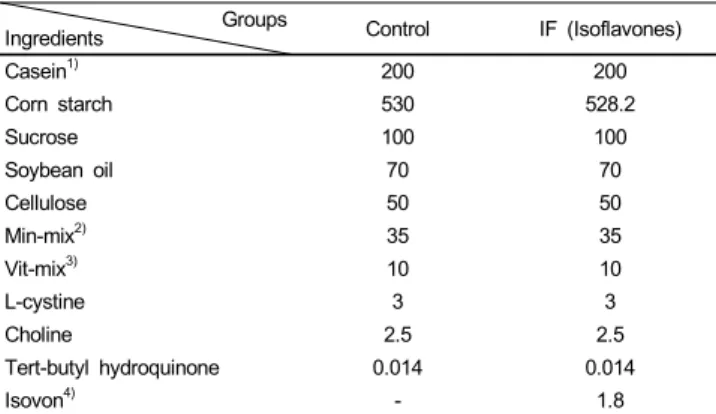
Table 1. Composition of experimental diets (g/kg of diet) Groups
Ingredients Control IF (Isoflavones)
Casein
1)200 200
Corn starch 530 528.2
Sucrose 100 100
Soybean oil 70 70
Cellulose 50 50
Min-mix
2)35 35
Vit-mix
3)10 10
L-cystine 3 3
Choline 2.5 2.5
Tert-butyl hydroquinone 0.014 0.014
Isovon
4)- 1.8
1)
Casein high protein (total protein 85%), Teklad Test Diets, Madison, Wisconsin, USA
2)
AIN-93G-MX, Teklad Test Diets, Madison, Wisconsin, USA
3)
AIN-93G-VM, Teklad Test Diets, Madison, Wisconsin, USA
4)
Isoflavones compound: Isovon (total isoflavones 32%), Pacific Chemical, Korea
Table 2. Effects of isoflavone supplementation on weight gains, mean food Intake and food intake efficiency ratio (FER) in growing female rats
Group Control IF p value
4)Weight gains (g)
1)156.4 ± 22.11
3)159.4 ± 18.00 NS Mean food intake (g/day) 13.94 ± 0.72 13.62 ± 1.19 NS
FER
2)0.18 ± 0.02 0.18 ± 0.01 NS
1)
Total body Weight gains for 9 weeks
2)
Food intake efficiency ratio (FER)
3)
Mean ± SD
4)
Value is based on t-test analysis, p<0.05.
the isoflavones found in soy protein cause a decline in bone density, or osteoporosis. There is little evidence of the mechanism, either. Since most previous studies on isoflavones focused on the features and effects of isoflavones that are similar to those of estrogen, the target of the experiments were pre- or post-menopausal women and ovariectomized animals.
It has been rarely studied if isoflavones have positive or negative effects on growing and young women. Whatever studies have been conducted has shown no significant results yet. The most important risk factor of the occurrence of osteoporosis is low peak bone mass and rapid rates of bone loss. As such, mitigation of the risk of fracture is dependent on an increase in the peak bone mass and thereafter, on minimization of bone loss.
This study was focused on whether or not isoflavones- supplementation affects the increase in bone mineral density of growing females. To examine the effects of isoflavones, we provided isoflavone which is extracted from soy for 9 weeks to growing female rats.
Materials and Methods
Experimental animals and diets
Female Sprague-Dawley rats (60 ± 5 g) were bought from KLEC (Korea Life Engineering Co., Seoul, Korea). Rats were fed stock diets (rat chow made by Samyangsa) for a week of adaptation period. Then, they were randomly divided into two experimental dietary groups, which included 12 rats each, and provided experimental diets for 9 weeks.
All experimental rats were individually housed in stainless steel wired cage in an air-conditioned room with controlled temp- erature (25 ± 2℃) and humidity (63 ± 5%) and automatic lighting (alternation 12-h period of light and dark). The experimental diet and deionized water were provided ad libitum.
The experimental groups were divided into control group and
isoflavone supplemented group (IF). The diets were formulated based on AIN-93G (Reeves et al., 1993). The two groups were based on same composition, but the diet of IF group was provided with isoflavones, extracted from soybean. The amount of isoflavone supplemented into experimental diet was 57.8 mg /100 g diet. The composition of experimental diets is shown in Table 1.
The analysis of the experiment
Measurement of the amount of dietary intake and the weight gains
During the experiment period, the amount of dietary intake was measured once every other day and the weight of experimental animals, once a week at a specific time.
Measurement of bone mineral density
Measurements of bone mineral density (BMD) and bone mineral content (BMC) on the experimental animals were executed in the 3
rd, 6
th, 9
thweeks. After the rats received intramuscular injection (75 mg/kg) with ketamine hydrochloride (Yuhan Kimberly, 50 mg/ml), their BMD and BMC in their spine and femur were measured with PIXImus, which is specialized for small animal, and with Dual energy x-ray absorptiometry (DEXA) made by GE, LUNAR (Madison, WI, USA). The unit of BMC is gram (g), and that of BMD is gram per square centimeter (g/cm
2).
Statistical analysis
Statistical analysis was conducted using the SAS program (Statisical Analysis System 9.13 version, SAS Institute Inc. Cary, NC). The mean and standard deviation were calculated for all the variables, statistical significance between the groups was tested by t-test. Differences were considerd significant at p<0.05.
Results
Effects on weight gains, mean food intake and food intake efficiency
Weight gains, mean food intake, and food intake efficiency
Table 3. Effects of isoflavone supplementation on spine bone mineral density (BMD) and bone mineral content (BMC) after 3, 6 and 9 weeks of feeding
Group Control IF P value
2)Group Control IF P value
3 weeks Spine BMD (g/cm
2) 0.0992 ± 0.0077
1)0.0959 ± 0.0098 NS Spine BMD/wt (g/cm
2/kg) 0.57 ± 0.03 0.59 ± 0.06 NS Spine BMC (g) 0.2107 ± 0.0284 0.2183 ± 0.0240 NS Spine BMC/wt (g/kg) 1.20 ± 0.22 1.40 ± 0.17 NS 6 weeks Spine BMD (g/cm
2) 0.1247 ± 0.0105 0.1292 ± 0.0501 NS Spine BMD/wt (g/cm
2/kg) 0.57 ± 0.01 0.62 ± 0.03 <0.05
Spine BMC (g) 0.3380 ± 0.0194 0.3510 ± 0.0395 NS Spine BMC/wt (g/kg) 1.56 ± 0.08 1.70 ± 0.17 NS 9 weeks Spin BMD (g/cm
2) 0.1469 ± 0.0082 0.1481 ± 0.0101 NS Spine BMD/wt (g/cm
2/kg) 0.61 ± 0.07 0.64 ± 0.05 NS Spin BMC (g) 0.4351 ± 0.0399 0.4516 ± 0.0380 NS Spine BMC/wt (g/kg) 1.84 ± 0.16 1.95 ± 0.16 NS
1)
Mean ± SD
2)
Value is based on t-test analysis, p<0.05.
Table 4. Effects of isoflavone supplementation on femur bone mineral density (BMD) and bone mineral content (BMC) after 3, 6 and 9 weeks of feeding
Group Control IF P value
2)Group Control IF P value
3 weeks Femur BMD (g/cm
2) 0.1336 ± 0.0078
1)0.1307 ± 0.0083 NS Femur BMD/wt (g/cm
2/kg) 0.76 ± 0.06 0.82 ± 0.06 NS Femur BMC (g) 0.1960 ± 0.0194 0.1906 ± 0.0168 NS Femur BMC/wt (g/kg) 1.21 ± 0.03 1.11 ± 0.11 <0.05 6 weeks Femur BMD (g/cm
2) 0. 1791 ± 0.0095 0. 1812 ± 0.0062 NS Femur BMD/wt (g/cm
2/kg) 0.83 ± 0.04 0.83 ± 0.04 NS
Femur BMC (g) 0.3031 ± 0.0126 0.2877 ± 0.0156 NS Femur BMC/wt (g/kg) 1.40 ± 0.10 1.38 ± 0.05 NS 9 weeks Femur BMD (g/cm
2) 0.2004 ± 0.0085 0.2064 ± 0.0112
a<0.05 Femur BMD/wt (g/cm
2/kg) 0.82 ± 0.03 0.89 ± 0.07 <0.05
Femur BMC (g) 0.3607 ± 0.0258 0.3795 ± 0.0273 NS Femur BMC/wt (g/kg) 1.52 ± 0.12 1.64 ± 0.04 <0.05
1)
Mean ± SD
2)