http://e-nrp.org
Association between serum 25-hydroxyvitamin D levels and adiposity measurements in the general Korean population
Dasom Kim and Jihye Kim§
Department of Medical Nutrition, Graduate School of East-West Medical Science, Kyung Hee University, 1732 Deogyeong-daero, Giheung-gu, Yongin-si, Gyeonggi 17104, Korea
BACKGROUND/OBJECTIVES: Obesity, which is a known risk factor for many chronic diseases, has also been associated with vitamin D deficiency. This study explored the relationship between serum 25-hydroxy-vitamin D [25(OH)D] concentrations and adiposity measures in a general Korean population using the most recent, nationally representative survey data.
SUBJECTS/METHODS: The study sample consisted of 4,771 Korean adults (≥ 19 years) who participated in the fifth Korean National Health and Nutrition Examination Surveys. Serum 25(OH)D was determined by radioimmunoassay. Body mass index (BMI), waist circumference (WC) and total body fat content were measured as adiposity measurements. Total body fat content was measured by dual-energy X-ray absorptiometry.
RESULTS: The serum 25(OH)D level was significantly higher in men than in women. Serum 25(OH)D concentration was positively correlated with energy intake, and it was negatively correlated with total body fat content (P < 0.0001) and percentage body fat (P < 0.0001) after adjustment for age in both sexes, while was inversely correlated with BMI only in women. In multivariable regression analysis, serum 25(OH)D was inversely associated with the total body fat content after adjustment for age, BMI, education, region, smoking, alcohol consumption, physical activity, and energy intake only in men (P = 0.0047). However, the serum 25(OH)D concentration was not associated with WC or BMI, indicators of adiposity after adjustment for potential risk factors.
CONCLUSIONS: Serum 25(OH)D concentration was independently associated with the total body fat content in a general Korean population, but it may be not associated with the indicators for estimating adiposity, such as WC or BMI.
Nutrition Research and Practice 2016;10(2):206-211; doi:10.4162/nrp.2016.10.2.206; pISSN 1976-1457 eISSN 2005-6168 Keywords: Vitamin D, adiposity, body fat, Korean adult
INTRODUCTION11)
Vitamin D is a fat-soluble vitamin that can be produced in the skin following sun exposure or may be ingested through the diet and nutritional supplementations. Recent evidence supports that lower levels of 25-hydroxyvitamin D [25(OH)D], a generally accepted indicator of vitamin D status, have been associated with glucose intolerance, type 2 diabetes, dyslipi- demia, and metabolic syndrome or its components [1-6].
Obesity, which is a known risk factor for these chronic conditions, has been inversely associated with vitamin D status in adults [3,7-9], children and adolescents [10]. McGill et al. [3]
observed that serum vitamin D concentration was inversely related to body mass index (BMI) and waist circumference (WC) in overweight and obese adults. In a clinical-based sample, Hispanic adults with higher BMI, WC, and waist- to -hip ratio had a lower vitamin D status [11]. On the other hand, Arunabh et al. [12] reported that serum vitamin D level was negatively
associated with percentage body fat, but it was not correlated with BMI in healthy black and white women.These inconsistent results may be because adiposity measures have been limited to indirect anthropometric measures such as BMI [7,8,13], WC [3,4,14], waist-to-hip ratio[4,14], and fat mass as measured by bioelectrical impedance [4,10]. Few studies have examined a direct measure of adiposity, such as the total body fat content.
Thus, the use of indirect approaches for measuring body fat might underestimate the inverse association between vitamin D status and adiposity. Furthermore, it still remains unclear whether adiposity (or percentage body fat) should be taken into consideration while assessing vitamin D requirements in the general population.
The prevalence of vitamin D deficiency ranges from 5% in Caucasian women to as high as 45% in African-American women in the United States (US)[15]. Racial differences could influence vitamin D levels in ethnic groups[16]. Asians typically have lower levels of 25(OH)D than Caucasians as a result of
This research was supported by the Basic Science Research Program of the National Research Foundation of Korea (NRF) founded by the Ministry of Education, Science and Technology (NRF2012R1A1A1012317).
§Corresponding Author: Jihye Kim, Tel. 82-31-201-3497, Fax. 82-31-204-8119, Email. [email protected] Received: August 1, 2015, Revised: November 19, 2015, Accepted: December 5, 2015
This is an Open Access article distributed under the terms of the Creative Commons Attribution Non-Commercial License (http://creativecommons.org/licenses/by-nc/3.0/) which permits unrestricted non-commercial use, distribution, and reproduction in any medium, provided the original work is properly cited.
their darker skin pigmentation, which decreases the amount of ultraviolet B (UVB) radiation that can penetrate the skin and produce vitamin D [17]. According to the Fourth Korean National Health Nutrition and Examination Survey (KNHANES IV-2), which was conducted in 2008, the prevalence of vitamin D insufficiency (< 50 nmol/L) was 56% in Korean adults over 19 years of age [18].
One study has reported that a lower serum 25(OH)D level is associated with an increased risk of abdominal obesity and overall obesity among Korean adolescents [19]. However, this study employed indirect measures of adiposity, such as WC and BMI. Thus, a direct measurement, such as body fat content, is required to reveal the association between serum 25(OH)D level and adiposity. To the author’s knowledge, this study is the first to reveal an association between vitamin D status and adiposity in the general Korean population using a direct measurement.
Therefore, this study examined the association between serum 25(OH)D concentration and adiposity measurements in a general Korean population using the most recent nationally representative survey data.
SUBJECTS AND METHODS Study population
The study was based on the Fifth Korean National Health and Nutrition Examination Survey (KNHANES V), a cross-sectional and nationally representative survey carried out by the Korea Center for Disease Control and Prevention (CDC) from October to December of 2010. The survey used a stratified multistage probability sampling design. Of the 8,958 Koreans who partici- pated in the original health examination study, 6,740 adults aged 19 years or over were selected for the present study. However, 1,969 were excluded because socio-economic, anthropometric, or biochemical information was lacking. Therefore, 4,771 Korean adults (1,989 males and 2,782 females) were ultimately eligible for the analysis and constituted the study cohort. Informed written consent for participation was obtained from all study participants. In addition, the study was approved by the Korea CDC Institutional Review Board.
Measurements
Height and body weight were measured as part of the health examination study [18]. BMI was calculated as weight (kg) divided by height squared (m2). WC was measured to the nearest 0.1 cm at the narrowest point between the lowest rib and the uppermost lateral border of the right iliac crest. Total body fat content was determined by performing a whole-body scan using dual-energy X-ray absorptiometry (DXA) with a radiation densitometer (model DISCOVERY-W, Hologic, Bedford, MA, US). The percentage of total body fat by DXA was calculated using the following formula: [fat mass (g)/fat mass (g) + lean mass (g) + total bone mineral content (g)] × 100.
The blood samples used to measure 25(OH)D in serum were collected after an overnight fast. All biochemical analyses were carried out within 2 h of blood sampling. Serum 25(OH)D concentrations were measured using a gamma counter (1470 WIZARD gamma-counter, PerkinElmer, Finland) with a radioim- munoassay (25-Hydroxyvitamin D 125I RIA kit; DiaSorin, Stillwater,
US) [20]. All of intra- and interassay coefficients of variation for 25(OH)D were < 12.5% and < 11%, respectively.
Covariates
Information on lifestyle factors was obtained using a self- administered questionnaire and verified with a personal interview.
The cutoff points of overweight and obesity were defined by the International Obesity Task Force for Asian adults in the Asian and Pacific regions [21]; underweight (< 18.5 kg/m2), normal (≥
18.5 kg/m2 and < 23 kg/m2), overweight (≥ 23 kg/m2 and < 25 kg/m2), and obese (≥ 25 kg/m2) based on the BMI. Educational levels were categorized into three groups: ≤ 6 years (elementary school level), 6-12 years (high school level), ≥ 12 years (college level). Participants were classified as non-smokers, former smokers (for at least 1 year) or current smokers. Alcohol consump- tion was assessed with questionnaires on the frequency of alcohol use during the previous year, and responses were converted into frequencies per week. Alcohol intake was used to divide the participants into three groups: non-drinkers, light or moderate drinkers (< 2 times/week) and heavy drinkers (≥ 2 times/week). Physical activity was classified based on the amount of regular exercise participants completed during their spare time as follows: vigorous exercise for ≥ 20 minutes/time,
≥3 times/week; or moderate exercise for ≥ 30 minutes/time,
≥5 times/week; or walking for ≥ 30 minutes/time, ≥ 5 times/
week. Vitamin D status was classified into three groups: deficient (< 30.0 nmol/L), inadequate (≥ 30 nmol/L and < 50 nmol/L), and adequate (≥ 50 nmol/L) based on serum 25(OH) D level [22].
Participants were categorized as living in either an urban or rural residential district. Seoul, its surrounding metropolitan area (Gyeonggi) and six other metropolitan cities (Busan, Daegu, Incheon, Gwangju, Daejeon, and Ulsan) in South Korea were considered urban areas. The remaining regions (Gangwon, Chungbuk, Chungnam, Jeonbuk, Jeonnam, Gyeonbuk, Gyeongnam, and Jeju) were classified as rural areas. Household income was classified into three groups as low (the first quartile), medium (the second and third quartile), and high (the fourth quartile).
The participants’ dietary intakes were determined using the 24-hour recall method. Their energy intake was estimated from the food composition table of the Rural Development Administration in combination with the nutrient database of the Korea Health and Industry of Development Institute[23].
Statistical analysis
Data are expressed as numbers and percentages or as means
± standard errors (SEs). Specific sampling weight with consi- deration of sampling probability in a health interview, a health examination, and a nutrition survey was used. The Rao-Scott chi-square test was used to compare proportions of categorical variables between men and women by the PROC SURVEYFREQ procedure. Mean values and standard errors of continuous variables were calculated by the PROC SURVEYMEANS procedure, and the PROC SURVEYREG procedure was used to compare the differences between men and women. We investigated possible interactions between sex and serum 25(OH)D level by including an interaction term in fully adjusted regression model. Age- adjusted correlation analysis of serum 25(OH)D with anthropo- metric measurements of adiposity and dietary intake were
Men (n = 1,989)
Women
(n = 2,782) P-value
Age (yrs) 44.6 ± 0.6 46.0 ± 0.5 0.0168
BMI (kg/m2) 24.0 ± 0.1 23.2 ± 0.1 < 0.0001
Underweight (%) 2.2 6.0 < 0.0001
Normal weight (%) 35.8 46.2
Overweight (%) 25.5 21.0
Obese (%) 36.5 26.8
WC (cm) 84.1 ± 0.3 77.8 ± 0.3 < 0.0001
Total body fat (kg) 16.4 ± 0.2 19.7 ± 0.15 < 0.0001
% total body fat 23.1 ± 0.3 34.0 ± 0.2 < 0.0001 Serum 25(OH) D (nmol/L) 47.7 ± 0.8 42.1 ± 0.7 < 0.0001
Deficient (%) 13.0 21.5 < 0.0001
Inadequate (%) 47.4 53.5
Adequate (%) 39.6 25.0
Residential district (%)
Urban 68.0 68.3 0.8707
Rural 32.0 31.7
Income (%)
Low 25.5 27.3 0.4060
Medium 51.4 49.7
High 23.1 23.0
Educational level (%)
≤ 6 yrs 12.4 26.2 < 0.0001
6-12 50.7 44.5
≥ 12 36.9 29.3
Smoking Status (%)
Never 19.1 87.5 < 0.0001
Former 34.9 6.9
Current 46.0 5.7
Alcohol consumption (%)
Never 12.3 31.3 < 0.0001
<2 times/week 51.4 59.5
≥ 2 times/week 36.3 9.2
Physical activity (%)
Regular 53.6 48.3 0.0038
Energy intake (kcal/d) 2,501 ± 28 1,751 ± 18 < 0.0001
1)Values are means ± SE or percentages.
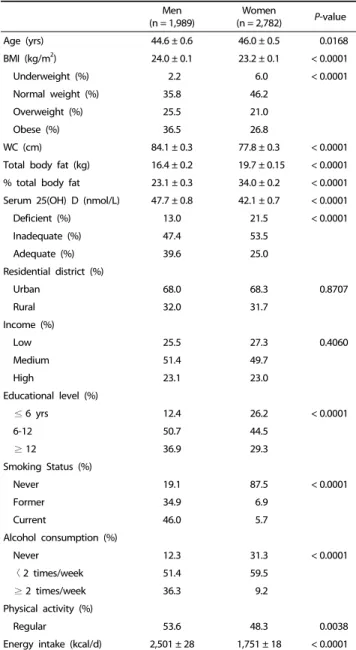
BMI; body mass index, WC; waist circumference Table 1. Characteristics of subjects1)
Men Women
Serum 25(OH)D BMI WC Body fat % body fat Energy intake Serum 25(OH)D BMI WC Body fat % body fat Energy intake
Serum 25(OH)D 1 1
BMI -0.002 1 -0.041** 1
WC 0.016 0.852*** 1 -0.011 0.848*** 1
Body fat -0.080*** 0.812*** 0.799*** 1 -0.063** 0.876*** 0.806*** 1
% body fat -0.114*** 0.617*** 0.637*** 0.922*** 1 -0.084*** 0.636*** 0.587*** 0.866*** 1
Energy intake 0.072** 0.036 0.035 -0.024 -0.007 1 0.050** -0.016 0.003 -0.025 -0.068*** 1
BMI; body mass index, WC; waist circumference
**P< 0.05, *** P< 0.001
Table 2. Age-adjusted Pearson’s correlation coefficients among serum 25(OH) D concentration, adiposity measurements, and energy intake in Korean adults (n = 4,771)
performed. Multivariable regression analyses were performed to evaluate the independent association of the serum 25(OH)D level with adiposity measures by the PROC SURVERYREC procedure. Regression models were differently adjusted for confounding factors of obesity or serum 25(OH) D level such as age, BMI, education, region, smoking, alcohol consumption, physical activity, and energy intake according to adiposity indicators. However, vitamin D intake was not adjusted as a confounding factor since dietary vitamin D intake has not been measured in this study. Sensitivity analyses were carried out excluding subjects who have chronic diseases such as cardiovascular, type 2 diabetes mellitus, and cancer. Statistical analyses were performed with SAS version 9.3 (SAS Institute, Cary, NC, US). P-values < 0.05 were considered statistically significant.
RESULTS
Characteristics of participants
A total of 4,771 Korean adults (1,989 males and 2,782 females) participated in this study. The basic characteristics of participants are shown in Table 1. BMI and WC values for men were greater than those of women (P < 0.0001), but the body fat content and the percentage of body fat were higher in women (P <
0.0001). The serum 25(OH)D concentration was significantly higher in men than in women (P < 0.0001). Men were more likely to be highly educated (P < 0.0001), to smoke (P < 0.0001) and drink alcohol (P < 0.0001), and to exercise regularly (P = 0.0038). Furthermore, men had significantly higher energy intake than women (P < 0.0001).
Correlation among serum 25(OH)D concentration, adiposity measurements and energy intake
Age-adjusted correlation coefficients between adiposity measures and serum 25(OH)D concentration in Korean adults are provided in Table 2. In men, serum 25(OH)D concentration was positively correlated with energy intake, and it was negatively correlated with the total body fat content (r = -0.080, P < 0.0001) and the percentage of body fat (r = -0.114, P <
0.0001) after adjustment for age. These correlations were similar for women, but were stronger for men than women. BMI was negatively correlated with serum 25(OH)D concentration only in women (r = -0.041, P = 0.0309), while WC was not correlated with serum 25(OH)D in both sexes.
Men Women
β P-value SE R2 β P-value SE R2
BMI
Model 1 0.0039 0.3943 0.0046 0.2% -0.0083 0.1273 0.0054 8.9%
Model 21) 0.0055 0.2127 0.0044 3.6% -0.0093 0.0877 0.0055 10.8%
Waist circumference
Model 1 0.0200 0.1663 0.0144 2.7% -0.0003 0.9795 0.0154 19.9%
Model 22) 0.0073 0.4043 0.0088 76.8% 0.0138 0.0902 0.0081 79.7%
Total body fat content
Model 1 -16.8319 0.0833 9.6607 1.2% -20.9554 0.0244 9.2255 1.7%
Model 23) -17.5770 0.0047 6.1327 69.8% -8.3720 0.0774 4.7121 78.2%
Model 1 adjusted for age
Model 21) adjusted for age, education region, smoking, alcohol consumption, and energy intake
Model 22) adjusted for age, BMI, education, region, income, smoking, alcohol consumption, and energy intake Model 23) adjusted for age, BMI, education, region, smoking, alcohol consumption, physical activity, and energy intake Table 3. Multivariable regression model of predicting adiposity indicators with serum 25(OH)D in Korean adults (n = 4,771)
The association between serum 25(OH)D concentration and adiposity measurements
A multivariable regression model of predicting obesity with the serum 25(OH)D level is shown in Table 3. The confounding factors for obesity or serum 25(OH)D level were differently adjusted according to adiposity indicators. Among men, serum 25(OH)D concentration was inversely associated with the total body fat content after adjustment for age, BMI, education, region, smoking, alcohol consumption, physical activity, and energy intake (P = 0.0047). Although an inverse association between serum 25(OH)D concentrations and total body fat content was also shown in women after adjustment for age (P = 0.0244), the association became weaker after further adjustment for the confounding factors. BMI and WC were not associated with serum 25(OH)D concentration in our subjects of either sex. Furthermore, sensitivity analyses were conducted to determine the robustness of the results after excluding subjects who have chronic diseases (n = 700), and the results were not meaningfully changed (data not shown).
DISCUSSION
This study found an inverse association between serum 25(OH)D and body fat content in Korean adults using the most recent nationally representative survey data. The serum 25(OH)D concentration was negatively correlated with the total body fat content and the percentage of body fat after adjusting for age in both sexes. Upon multivariable regression analysis, the serum 25(OH)D concentration was inversely associated with total body fat content after adjustment for age, BMI, education, region, smoking, alcohol consumption, physical activity, and energy intake in men. However, the serum 25(OH)D concentration was not associated with WC or BMI, indicators of adiposity, after adjustment for potential risk factors regardless of sex. These results suggest that the serum 25(OH)D concentration may be independently associated with adiposity but not with the indicators used to estimate adiposity, such as WC or BMI.
Our findings are consistent with previous studies reporting an inverse relationship between vitamin D levels and adiposity [4,12,17,24]. The percentage of body fat was independently associated with serum 25(OH)D in healthy Caucasian and
African-American women between 20 and 80 years of age regardless of other well-known factors, such as dietary vitamin D intake, season, age, and race [12]. In Caucasian and African-American adults, the serum 25(OH)D concentration in the obese group was significantly lower than that of the non-obese group, and it was also negatively correlated with DXA fat mass [24]. The plasma 25(OH)D concentration was negatively associated with body fat when bioelectrical impe- dance was used and also after adjusting for age, BMI and the waist-hip ratio in Caucasian women [4]. The plasma 25(OH)D concentration was inversely associated with visceral fat and subcutaneous fat in Hispanic and African-Americans at baseline, but no significant associations were seen between adiposity and 25(OH)D concentration at the 5-year follow-up visit [17].
However, direct comparison could be difficult because the studies used different measurements for adiposity and also explored members of different ethnic groups.
The inverse association between serum 25(OH)D concen- tration and adiposity could be explained by the increased storage of 25(OH)D in the adipose tissue of obese participants.
Low 25(OH)D levels are associated with increased adiposity, possibly due to enhanced uptake by adipose tissue, thus decreasing the bioavailability of vitamin D3 from cutaneous and dietary sources because of its deposition in body fat compart- ments [13]. Some experimental data suggest that vitamin D deficiency could promote greater adiposity. Moderate-to-severe vitamin D deficiency leads to elevated parathyroid hormone, which may promote calcium influx into adipocytes and thereby enhance lipogenesis [25]. Furthermore, evidence suggests that 1,25hydroxyvitamin D modulates adipogenesis through vitamin D receptor-dependent inhibition of critical molecular components of adipogenesis, such as peroxisome proliferator-activated receptor γ and C/EBP α [26]. Therefore, depletion of vitamin D stores may lead to excess differentiation of preadipocytes to adipocytes.
In this study, the serum 25(OH)D concentration was associated with total body fat, but not with other indicators of estimating adiposity, such as WC or BMI although those were correlated with body fat. It may be due to intermediate factors between body fat and indirect measures such as age. Although BMI and WC are commonly used to estimate obesity, the indicators are
inaccurate and can lead to bias in measuring adiposity. For example, BMI, an indirect measure of adiposity, is traditionally weaker than direct measures of adiposity because it does not take age, sex, bone structure, fat distribution or muscle mass into consideration [27]. Thus the association between vitamin D and overall adiposity can be underestimated when BMI is used as an estimate of adiposity. Among overweight and obese Puerto Rican adults aged 40-65 years old, serum 25(OH)D was negatively correlated with percent body fat, but it was not correlated with the waist-to-hip ratio or BMI [28]. Bhatt et al.
reported that serum 25(OH)D was significantly correlated with intra-abdominal adipose tissue depots by using DXA in obese Asian Indians aged 18-60 years, but it was not correlated with WC or waist-to-hip ratio, which are the typical indicators of abdominal obesity [29]. Arunabh et al. [12] showed that serum 25(OH)D levels are more strongly correlated with the percentage of total body fat compared with other indicators of adiposity such as body weight or BMI. The percentage of total body fat was more strongly associated with the 25(OH)D level compared with anthropometric measures such as BMI, WC and the sum of skin folds after adjustment for potential confounders in older men and women aged 65 years and older [14]. These results propose that the use of direct measurement for adiposity such as total body fat content may be more proper than the indirect measurements such as BMI and WC in the association between serum 25(OH)D level and adiposity.
Meanwhile, the association between serum 25(OH)D concen- trations and total body fat content was much stronger in men compared with women. The different result between men and women may be due to the effect of sex hormones. Estrogen might play a role in these gender differences, because it has a favorable effect on insulin and glucose homeostasis, adipose tissue distribution, and proinflammatory markers [30]. Systemic loss of estrogen at menopause is associated with increased adiposity, which is implicated in the elevated risk of age-related metabolic disease in women [31]. Therefore, the relationship serum 25(OH)D and adiposity could be attenuated by hormonal changes in women.
This study has some limitations. First, the study does not prove a causal relationship because the study was designed cross-sectionally. Second, sunlight exposure and vitamin D intake were not measured, and both of these may affect serum 25(OH)D levels. Despite these limitations, our study examined the total body fat by using DXA, a direct measure of adiposity, although few previous studies have examined direct measures of body fat content. To the best of the author’s knowledge, this is the first study to investigate the association of serum 25(OH)D and adiposity in Korean adults using nationally representative survey data.
In conclusion, the serum 25(OH)D concentration was inversely associated with the total body fat content (but not with BMI or WC) after adjustment for potential risk factors in Korean adults, suggesting that the vitamin D level is independently associated with adiposity. Taken together, individuals with a higher percentage of body fat may require a greater vitamin D intake to attain optimal 25(OH)D levels compared with lean individuals; therefore, body fat should be considered when assessing vitamin D requirements. Longitudinal studies or
clinical trials will be needed to confirm the causal relationship between vitamin D status and adiposity, and additional studies will also be required to identify the association between vitamin D status and body fat characteristics in populations with various disease states as well as in healthy people.
REFERENCES
1. Carr MC, Brunzell JD. Abdominal obesity and dyslipidemia in the metabolic syndrome: importance of type 2 diabetes and familial combined hyperlipidemia in coronary artery disease risk. J Clin Endocrinol Metab 2004;89:2601-7.
2. Konradsen S, Ag H, Lindberg F, Hexeberg S, Jorde R. Serum 1,25-dihydroxy vitamin D is inversely associated with body mass index. Eur J Nutr 2008;47:87-91.
3. McGill AT, Stewart JM, Lithander FE, Strik CM, Poppitt SD.
Relationships of low serum vitamin D3 with anthropometry and markers of the metabolic syndrome and diabetes in overweight and obesity. Nutr J 2008;7:4.
4. Vilarrasa N, Maravall J, Estepa A, Sánchez R, Masdevall C, Navarro MA, Alía P, Soler J, Gómez JM. Low 25-hydroxyvitamin D concentra- tions in obese women: their clinical significance and relationship with anthropometric and body composition variables. J Endocrinol Invest 2007;30:653-8.
5. Kim J. Association between serum vitamin D, parathyroid hormone and metabolic syndrome in middle-aged and older Korean adults.
Eur J Clin Nutr 2015;69:425-30.
6. Kim D, Kim J. Association of serum 25-hydroxyvitamin D and parathyroid hormone with hypertension in middle-aged and older Korean adults. Am J Hyperten 2016;29:96-103.
7. Kimmons JE, Blanck HM, Tohill BC, Zhang J, Khan LK. Associations between body mass index and the prevalence of low micronutrient levels among US adults. MedGenMed 2006;8:59.
8. Yanoff LB, Parikh SJ, Spitalnik A, Denkinger B, Sebring NG, Slaughter P, McHugh T, Remaley AT, Yanovski JA. The prevalence of hypovitaminosis D and secondary hyperparathyroidism in obese Black Americans. Clin Endocrinol (Oxf) 2006;64:523-9.
9. Martins D, Wolf M, Pan D, Zadshir A, Tareen N, Thadhani R, Felsenfeld A, Levine B, Mehrotra R, Norris K. Prevalence of cardio- vascular risk factors and the serum levels of 25-hydroxyvitamin D in the United States: data from the Third National Health and Nutrition Examination Survey. Arch Intern Med 2007;167:1159-65.
10. Alemzadeh R, Kichler J, Babar G, Calhoun M. Hypovitaminosis D in obese children and adolescents: relationship with adiposity, insulin sensitivity, ethnicity, and season. Metabolism 2008;57:183-91.
11. González L, Ramos-Trautmann G, Díaz-Luquis GM, Pérez CM, Palacios C. Vitamin D status is inversely associated with obesity in a clinic-based sample in Puerto Rico. Nutr Res 2015;35:287-93.
12. Arunabh S, Pollack S, Yeh J, Aloia JF. Body fat content and 25-hydroxyvitamin D levels in healthy women. J Clin Endocrinol Metab 2003;88:157-61.
13. Wortsman J, Matsuoka LY, Chen TC, Lu Z, Holick MF. Decreased bioavailability of vitamin D in obesity. Am J Clin Nutr 2000;72:690-3.
14. Snijder MB, van Dam RM, Visser M, Deeg DJ, Dekker JM, Bouter LM, Seidell JC, Lips P. Adiposity in relation to vitamin D status and parathyroid hormone levels: a population-based study in older men and women. J Clin Endocrinol Metab 2005;90:4119-23.
15. Nesby-O'Dell S, Scanlon KS, Cogswell ME, Gillespie C, Hollis BW,
Looker AC, Allen C, Doughertly C, Gunter EW, Bowman BA. Hypovi- taminosis D prevalence and determinants among African American and white women of reproductive age: third National Health and Nutrition Examination Survey, 1988-1994. Am J Clin Nutr 2002;76:
187-92.
16. McKinney K, Breitkopf CR, Berenson AB. Association of race, body fat and season with vitamin D status among young women: a cross-sectional study. Clin Endocrinol (Oxf) 2008;69:535-41.
17. Young KA, Engelman CD, Langefeld CD, Hairston KG, Haffner SM, Bryer-Ash M, Norris JM. Association of plasma vitamin D levels with adiposity in Hispanic and African Americans. J Clin Endocrinol Metab 2009;94:3306-13.
18. Kim J. Dairy food consumption is inversely associated with the risk of the metabolic syndrome in Korean adults. J Hum Nutr Diet 2013;26 Suppl 1:171-9.
19. Nam GE, Kim do H, Cho KH, Park YG, Han KD, Choi YS, Kim SM, Ko BJ, Kim YH, Lee KS. Estimate of a predictive cut-off value for serum 25-hydroxyvitamin D reflecting abdominal obesity in Korean adolescents. Nutr Res 2012;32:395-402.
20. Zittermann A, Frisch S, Berthold HK, Götting C, Kuhn J, Kleesiek K, Stehle P, Koertke H, Koerfer R. Vitamin D supplementation enhances the beneficial effects of weight loss on cardiovascular disease risk markers. Am J Clin Nutr 2009;89:1321-7.
21. Kim J, Jo I. Relationship between body mass index and alanine aminotransferase concentration in non-diabetic Korean adults. Eur J Clin Nutr 2010;64:169-75.
22. Institute of Medicine (US). Dietary Reference Intakes for Calcium and Vitamin D. Washington, D.C.: The National Academy Press; 2011.
23. Ministry of Health and Welfare (KR). National Health And Nutrition Examination Survey Report 2010. Seoul: Ministry of Health and Welfare; 2010.
24. Parikh SJ, Edelman M, Uwaifo GI, Freedman RJ, Semega-Janneh M, Reynolds J, Yanovski JA. The relationship between obesity and serum 1,25-dihydroxy vitamin D concentrations in healthy adults.
J Clin Endocrinol Metab 2004;89:1196-9.
25. McCarty MF, Thomas CA. PTH excess may promote weight gain by impeding catecholamine-induced lipolysis-implications for the impact of calcium, vitamin D, and alcohol on body weight. Med Hypotheses 2003;61:535-42.
26. Wood RJ. Vitamin D and adipogenesis: new molecular insights. Nutr Rev 2008;66:40-6.
27. Rothman KJ. BMI-related errors in the measurement of obesity. Int J Obes 2008;32 Suppl 3:S56-9.
28. Palacios C, Gil K, Pérez CM, Joshipura K. Determinants of vitamin D status among overweight and obese Puerto Rican adults. Ann Nutr Metab 2012;60:35-43.
29. Bhatt SP, Misra A, Sharma M, Guleria R, Pandey RM, Luthra K, Vikram NK. Vitamin D insufficiency is associated with abdominal obesity in urban Asian Indians without diabetes in North India. Diabetes Technol Ther 2014;16:392-7.
30. Geer EB, Shen W. Gender differences in insulin resistance, body composition, and energy balance. Gend Med 2009;6 Suppl 1:60-75.
31. D'Eon TM, Souza SC, Aronovitz M, Obin MS, Fried SK, Greenberg AS. Estrogen regulation of adiposity and fuel partitioning. Evidence of genomic and non-genomic regulation of lipogenic and oxidative pathways. J Biol Chem 2005;280:35983-91.