Association of Serum 25-Hydroxyvitamin D Levels with Markers for Metabolic Syndrome in the Elderly: A Repeated Measure Analysis
The purpose of current study was to investigate associations of serum 25-hydroxyvitamin D (OHVD) levels with markers for metabolic syndrome in elderly Koreans. We conducted a panel study on 301 individuals over 60 yr old in Seoul, Korea, and repeatedly measured serum OHVD, glucose, insulin, and lipid levels. Mixed effect model and generalized estimating equations were used to investigate relationships between serum OHVD levels with marker levels for metabolic syndrome and each of its categories. Of all subjects, 76.6% were vitamin D deficient (< 50 nM) and 16.9% were insufficient (< 75 nM).
Inverse association was demonstrated between serum OHVD levels and insulin (P = 0.004), triglyceride (P = 0.023) and blood pressure (systolic blood pressure: P = 0.002; diastolic blood pressure: P < 0.001). Vitamin D deficiency was found to increase risk of
‘hypertriglyceridemia’ category of metabolic syndrome (odds ratio: 1.73, 95% confidence interval: 1.13-2.66). In conclusion, we found from our repeated measure analysis that decreasing serum OHVD levels are associated with increasing insulin resistance, increasing serum triglyceride levels and increasing blood pressure in elderly Koreans, and confirmed on the risk of ‘hypertriglyceridemia’ in vitamin D deficient subjects.
Key Words: Vitamin D; Insulin Resistance; Metabolic Syndrome; Elderly; Mixed Effect Model
Hye Yin Park1, Youn-Hee Lim2, Jin Hee Kim3, Sanghyuk Bae1, Se-Young Oh4, and Yun-Chul Hong1,3
1Department of Preventive Medicine, Seoul National University College of Medicine, Seoul; 2Department of Epidemiology and Biostatistics, School of Public Health, Seoul National University, Seoul; 3Institute of Environmental Medicine, Seoul National University Medical Research Center, Seoul;
4Department of Food and Nutrition, Kyung Hee University, Seoul, Korea
Received: 19 October 2011 Accepted: 28 February 2012 Address for Correspondence:
Yun-Chul Hong, MD
Institute of Environmental Medicine, Seoul National University Medical Research Center, 103 Daehak-ro, Jongno-gu, Seoul 110-799, Korea
Tel: +82.2-740-8394, Fax: +82.2-747-4830 E-mail: [email protected]
This study was supported by the Susceptible Population Research Program (2008-2010) of the Ministry of Environment, Republic of Korea Government.
http://dx.doi.org/10.3346/jkms.2012.27.6.653 • J Korean Med Sci 2012; 27: 653-660 Endocrinology, Nutrition & Metabolism
INTRODUCTION
Concerns have been raised on hypovitaminosis D due to its high worldwide prevalence, and elderly population has received at- tention in this matter as they are more prone to develop vitamin D deficiency than younger population. More than 90% of the pigmented populace in the United States (including Asians) are reported to have vitamin D insufficiency (50-75 nM or 20-30 ng/mL), and estimated prevalence of vitamin D deficiency (de- fined as < 50 nM or < 20 ng/mL) in elderly has been reported to be about 50% worldwide (1, 2).
The role of vitamin D in many biological systems has been actively researched in recent years. At the same time, insulin re- sistance, a physiological state where insulin becomes less effec- tive in lowering blood sugars, and metabolic syndrome, a group of cardiometabolic disease risk factors, has also received much attention for their increasing prevalence and consequent effects.
The issue on the association of serum 25-hydroxyvitamin D (OHVD) levels with insulin resistance (IR) and metabolic syn-
drome (MS) has become a subject supported and challenged by increasing reports of evidence as well as controversy. With increasing reports on the role of vitamin D on elements of dia- betes and metabolic syndrome such as adiposity, glucose ho- meostasis, lipid profiles and blood pressure, further investiga- tion for evidence is greatly encouraged (3-9).
While longitudinal studies and intervention trials have shown inconsistent results for the association between vitamin D and IR or MS, numerous cross-sectional studies have demonstrated in favor of the relationship. However, limitation of the study de- signs has brought about a demand for better approach. Thus we carried out a panel study, as it controls time-invariant indi- vidual characteristics by design, therefore is suitable for analyz- ing of short-term changes in continuous variables.
In a national level prospective cohort study of 35,671 subjects followed in Korea from 2004 to 2006, significant increasing trend for MS was observed with increasing age (P < 0.001 for both sex) (10). Along with susceptibility to hypovitaminosis D, the fact that elderly population is more vulnerable to cardiometabolic
disease risks draws attention to further examine the association between low serum OHVD concentration and metabolic syn- drome in the elderly. Confirming the association would be more important as supplementing vitamin D is practical and uncom- plicated, such as sunbathing and dietary modification, espe- cially for the less-active elderly population.
The purpose of our study was to investigate the relationship of serum OHVD levels with IR and MS in elderly Koreans by re- peated measures up to 3 times.
MATERIALS AND METHODS Subjects
The study is a part of the Korean Elderly Environmental Panel (KEEP) study on Koreans over 60 yr old residing in Seongbuk- gu, Seoul, Republic of Korea. Of all 560 subjects, this research is focused on 301 subjects who had their serum OHVD levels mea- sured more than once out of three opportunities, from August 2008 through August 2010.
Four hundred and eight subjects attended initial series of vis- its between September and December 2008, and 302 subjects attended second series of visits from April to September 2009.
Third series of visits were attended by 173 subjects, between March to August 2010. Of the 302 subjects who made at least two visits, one subject was excluded as she participated from the second series of visits.
Variables
A standard questionnaire was used by trained interviewers to collect information on age, sex, smoking (current/ex-/non- smoker), alcohol drinking (yes/no), regular exercise (yes/no), and self-reported diabetes, hypertension, and dyslipidemia. A food frequency questionnaire on previous one year’s dietary intake was also carried out to calculate total (both animal and vegetable) calcium intake. Blood pressure after five minutes-rest, height and weight were measured, and venous blood samples were collected to measure the following: fasting blood sugar (FBS), insulin, triglyceride (TG), high-density lipid (HDL) cho- lesterol, OHVD.
Data on moving-average amount of sunshine in Seongbuk-gu from the day each subject visited were gained from the Korea Meteorological Administration (http://www.kma.go.kr). The physical examination and blood test were repeated on the sec- ond and third series of visits.
Insulin resistance (IR) was measured using the homeostasis model assessment of insulin resistance (HOMA-IR) index, which is calculated as [glucose × insulin]/22.50. For the definition of abnormal levels of the markers, we used criteria for metabolic syndrome according to National Cholesterol Education Program Adult Treatment Panel III (NCEP-ATP III) Criteria for Asian Amer- icans: triglyceride ≥ 1.695 mM (≥ 150 mg/dL), HDL cholesterol
< 1.036 mM (< 40 mg/dL) for men and < 1.295 mM (< 50 mg/
dL) for women, blood pressure ≥ 130/85 mmHg or current use of antihypertensive medications, and fasting glucose ≥ 5.55 mM (≥ 100 mg/dL) or previously diagnosed type 2 diabetes or using oral hypoglycemic agents or insulin. With lack of data for waist circumference, we used alternative definition of BMI ≥ 23 kg/m2 instead.
Laboratory methods
All blood samples were collected in 8 mL plain tubes around 10 a.m. in the morning after overnight fasting and centrifuged within 30-60 min of collection. It was then serum-separated in screw cap tubes and immediately stored in -70°C freezers until analysis.
Analyses were performed in a central laboratory (Neodin Medical Laboratories, Seoul, Korea). Hexokinase method with Hitachi 7600 II analyzer (Hitachi, Tokyo, Japan) was used for measuring fasting blood glucose levels. Enzymatic caliometry was used for measuring serum lipid levels. Serum insulin levels were measured using competitive RIA method on 1470 WIZ- ARD equipment (PerkinElmer, Turku, Finland), and serum OHVD levels were measured using chemiluminescentimmu- noassay on LIAISON equipment (DiaSorin Inc., Stillwater, MN, USA). Quality control for OHVD was maintained using Levey- Jening chart, with mean ± 2SD values set as allowable range.
Statistical analysis
Data analysis was carried out using SAS 9.2 (Cary, NC, USA) and R version 2.12.1 (The Comprehensive R Archive Network, http://cran.rproject.org). Mixed effect model was used for cal- culating the estimate effect of log-transformed OHVD levels on continuous variables by multiple regression, and generalized estimating equation model was used to calculate the estimate effect of OHVD on abnormal levels of the components of MS (discrete variables). For the graphical analysis of relationship between OHVD and marker levels, we used generalized addi- tive mixed model.
As participants made different number of visits, the non- random loss of follow-up due to different number of repeated measures may lead to selection bias (11). Thus weighting fol- low-up observations was carried out, by inverse probability of attaining a follow-up response (12). With data from participants who made more than one visit, we performed logistic regres- sion to predict follow-up probability (follow-up = 1, missing = 0), with covariates as previously measured age, sex, BMI, number of years of schooling, blood pressure, season, and temperature.
Weight value of 1 was given to first observations of each partici- pant, and more weight was given to more likely missing obser- vations (13).
For multiple regression analysis, age and sex were adjusted in model 1; age, sex, smoking, alcohol, exercise, diabetes, hyper-
tension and dyslipidemia were adjusted in model 2; variables in model 2 plus 7-days moving average for amount of sunshine were adjusted in model 3. In examining the association between OHVD levels and each of MS components, we used the same models.
Ethics statement
The study protocol was approved by the institutional review board of Seoul National University Hospital (IRB No. H-0804- 045-241). Written informed consent was received from all par- ticipants.
RESULTS
Baseline characteristics of study subjects are shown in Table 1.
Of the 301 subjects, 68 were male and 233 were female, and their average age was 70.4 ± 5.23 (range: 60-84 yr). Percentages for current smoking and alcohol drinking were very low (smoking:
6.0%, alcohol drinking: 17.6%) while percentage of subject pop- ulation on regular exercise was relatively high (38.4%).
Mean serum OHVD level was 41.66 ± 19.436 nM, ranging from 5.0 to 159.0 nM. Of all the measurements, 76.6% fell under vitamin D deficiency (< 50 nM) while 16.9% and 6.6% fell under
insufficiency (50-75 nM) and sufficiency (> 75 nM). Percentag- es of subjects having hypertension, diabetes and dyslipidemia were derived from questionnaire results, and were found to be 45.5%, 16.0%, and 11.3% respectively.
Serum OHVD levels were calculated in percentiles and di- vided into quartiles, as Q1 (< 20.754 nM), Q2 (20.754-32.448 nM), Q3 (32.448-48.298 nM), and Q4 (≥ 48.298 nM). Characteristics of study subjects across quartiles of OHVD levels on all three visits are described in Table 2. For mean and standard deviation values for each variable across quartiles of OHVD levels, P values were significant for body mass index (BMI), SBP, DBP, triglycer- ide (TG) levels, HOMA-IR, and amount of sunshine of the study area on the day each subject visited. Significant difference across quartiles of OHVD levels were also observed with subjects’ smok- ing, alcohol drinking and regular exercise.
Numbers and their percentages of subjects for abnormal cat- egories of components for metabolic syndrome across quartiles of serum OHVD levels are shown in Table 3. Mantel-Haenszel chi- square test for trend showed significant difference in hypertriglyc- eridemia and hypertension across quartiles of OHVD levels.
Effects of serum OHVD levels on continuous variables (BMI, TG, HDL cholesterol, glucose, insulin, HOMA-IR, SBP, and DBP) across differently adjusted models were analyzed by mixed model Table 1. Baseline characteristics of study subjects by gender
Parameters All Male Female
P value
No./mean %/SD No./mean %/SD No./mean %/SD
No. (%) 301 68 233
Age (yr) 70.4 5.23 71.5 4.29 70.1 5.45 0.022
Body mass index (kg/m2) 24.72 2.950 24.04 3.068 24.91 2.893 0.524
Systolic blood pressure (mmHg) 133.3 17.85 131.7 20.37 133.7 17.06 0.059
Diastolic blood pressure (mmHg) 75.3 10.64 75.1 11.66 75.3 10.35 0.206
Vitamin D (nM) 41.658 19.436 51.218 18.034 38.863 18.975 0.633
Triglyceride (mM/L) 1.558 0.943 1.532 1.038 1.566 0.916 0.184
HDL cholesterol (mM/L) 1.279 0.316 1.204 0.352 1.300 0.302 0.103
Glucose (mM/L) 5.261 1.222 5.356 1.282 5.228 1.204 0.495
Insulin (pM/L) 51.230 38.207 44.342 32.754 53.239 39.498 0.072
HOMA-IR 31.5 27.828 27.54 22.86 32.58 29.07 0.021
Calcium intake (mM/d) 17.92 8.1675 18.865 8.3325 17.6575 8.1225 0.781
Total amount of sunshine (hr) lag 0
lag 0-1 lag 0-7 lag 0-14
5.6 5.8 6.0 6.4
3.88 4.01 3.77 3.50
5.9 5.7 5.8 5.9
3.73 4.38 4.16 3.60
5.5 5.8 6.0 6.6
3.92 3.91 3.66 3.47
0.627 0.221 0.170 0.666 Daily mean temperature (°C)
lag 0 lag 0-1 lag 0-7 lag 0-14
15.3 15.5 15.2 16.1
9.42 8.87 9.63 9.74
16.6 17.0 16.7 18.2
9.69 8.83 8.64 8.80
14.8 15.1 14.7 15.6
9.32 8.86 9.88 9.94
0.665 1 0.194 0.237
Smoking (%) 18 6.0 17 25 1 0.4 < 0.001
Alcohol drinking (%) 53 17.6 32 47.1 21 9.0 < 0.001
Regular exercise (%) 183 61.6 38 55.9 145 63.3 0.269
Hypertension (%) 137 45.5 35 51.5 102 43.8 0.263
Diabetes (%) 48 16.0 12 17.7 36 15.5 0.664
Dyslipidemia (%) 34 11.3 8 11.8 26 11.2 0.890
HDL cholesterol, high-density lipoprotein cholesterol; HOMA-IR, homeostasis model assessment of insulin resistance index.
Table 2. Characteristics of study subjects across quartiles of serum OHVD levels, over all visit periods combined Parameters
Q1:
< 20.754 nM Q2:
20.754-32.448 nM Q3:
32.448-48.298 nM Q4:
≥ 48.298 nM P value
No./mean %/SD No./mean %/SD No./mean %/SD No./mean %/SD
No. (%) 194 193 195 194
Age (yr) 72.0 5.63 71.8 5.77 70.2 5.01 71.3 4.77 0.004
Female sex (%) 171 87.69 158 81.87 144 73.85 134 69.07 < 0.001
Body mass index (kg/m2) 24.83 3.104 25.28 3.094 24.85 2.869 24.07 2.706 0.001
Systolic blood pressure (mmHg) 132.6 16.92 131.1 17.01 130.8 17.14 126.1 17.68 0.002
Diastolic blood pressure (mmHg) 74.8 10.99 74.2 10.40 73.8 10.25 71.0 9.90 0.002
Triglyceride (mM/L) 1.64 0.950 1.57 0.944 1.43 0.748 1.43 0.812 0.031
HDL cholesterol (mM/L) 1.34 0.354 1.33 0.326 1.32 0.333 1.33 0.359 0.934
Glucose (mM/L) 5.59 1.267 5.60 1.564 5.44 1.377 5.37 1.063 0.246
Insulin (pM/L) 60.84 79.470 62.42 64.310 52.09 37.489 48.79 40.675 0.055
HOMA-IR 40.68 62.514 43.2 61.956 32.94 28.962 31.14 34.092 0.044
Calcium intake (mM/d) 15.763 6.345 19.3 8.371 16.795 8.634 18.828 8.005 0.091
Total amount of sunshine (hr) lag 0
lag 0-1 lag 0-7 lag 0-14
5.7 5.5 6.2 5.9
4.24 4.20 4.31 4.09
5.6 5.3 5.7 5.9
4.22 4.03 4.14 4.24
5.1 5.6 5.5 5.9
4.10 4.35 4.08 3.81
4.8 5.3 5.8 5.9
4.00 4.10 3.90 3.84
0.167 0.869 0.372 0.999 Daily mean temperature (°C)
lag 0 lag 0-1 lag 0-7 lag 0-14
12.7 12.9 11.8 10.6
7.62 7.21 7.52 7.82
15.8 15.8 15.3 14.4
8.05 8.14 8.33 9.38
17.9 18.1 17.9 17.8
8.65 8.17 8.48 8.50
18.5 18.8 18.3 18.3
8.35 7.90 9.18 8.82
< 0.001
< 0.001
< 0.001
Current smoking (%) 5 2.6 10 5.2 8 4.1 23 11.9 0.004
Current drinking (%) 23 11.8 34 17.6 37 19.0 44 22.7 0.006
No regular exercise (%) 135 67.0 112 59.3 114 59.7 108 55.7 0.007
Hypertension (%) 94 48.2 87 45.1 94 48.2 78 40.2 0.192
Diabetes (%) 25 12.8 33 17.1 26 13.3 39 20.1 0.123
Dyslipidemia (%) 19 9.7 18 9.3 19 9.7 34 17.5 0.021
HDL cholesterol, high-density lipoprotein cholesterol; HOMA-IR, homeostasis model assessment of insulin resistance index.
Table 3. “Positive” or “negative” proportions in five categories of metabolic syndrome; in total number of measurements, across quartiles of serum OHVD levels
Categories of metabolic syndrome
Total number of measurements
Number of subjects distributed over quartiles of OHVD levels
P value Q1:
< 20.754 nM Q2:
20.754-32.448 nM Q3:
32.448-48.298 nM Q4:
≥ 48.298 nM
No. % No. % No. % No. % No. %
Body mass index (kg/m2) < 23
≥ 23
203 574
26.13 73.87
50 145
25.64 74.36
47 146
24.35 75.65
43 152
22.05 77.95
63 131
32.47 67.53
0.198 Triglyceride (mM/L)
< 1.695 ≥ 1.695
532 245
68.47 31.53
123 72
63.08 36.92
131 62
67.88 32.12
131 64
67.18 32.82
147 47
75.77 24.23
0.012 HDL cholesterol
≥ 1.036 mM/L (men) or ≥ 1.295 mM/L (women) < 1.036 mM/L (men) or < 1.295 mM/L (women)
448 329
57.66 42.34
106 89
54.36 45.64
112 81
58.03 41.97
116 79
59.49 40.51
114 80
58.76 41.24
0.354
Hypertensive < 130/85 mmHg ≥ 130/85 mmHg or currently in medication
226
551 29.09
70.91 48
147 24.62
75.38 53
140 27.46
72.54 49
146 25.13
74.87 76
118 39.18
60.82 0.005 Diabetic
FBS < 5.55 mM/L FBS ≥ 5.55 mM/L or using oral medication/insulin or previously diagnosed T2DM
512
265 65.89
34.11 118
77 60.51
39.49 124
69 64.25
35.75 139
56 71.28
28.72 131
63 67.53
32.47 0.065
HDL cholesterol, high-density lipoprotein cholesterol.
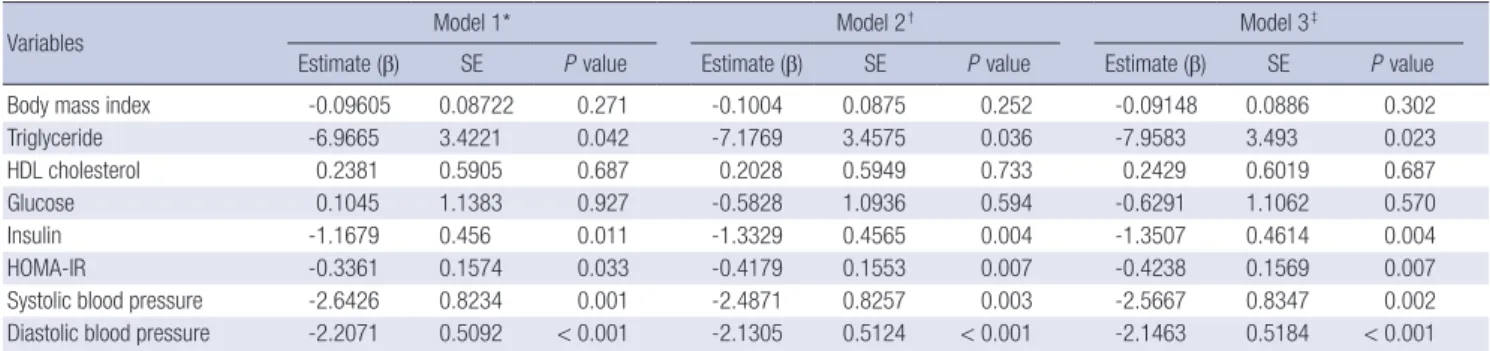
analysis, and are shown in Table 4. Significant inverse relation- ship with serum OHVD levels were found with TG, insulin, HOMA-IR, SBP and DBP across all three models, but no signifi- cance was found with BMI, HDL cholesterol and glucose in any of the models. Results were consistent in direction and signifi- cance across all the selected moving average for amount of sun- shine, and the effect size was greatest at lag 0-7. To confirm for the linear association between log-transformed OHVD levels and various outcome variables in the mixed model analysis, we implemented generalized additive mixed models, as shown in Fig. 1 (14).
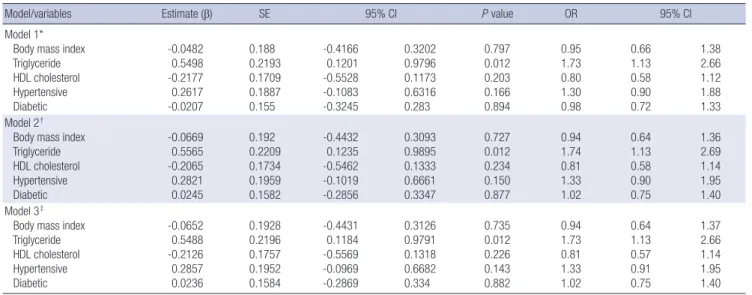
Effects of OHVD levels on categorical variables of MS com- ponents across differently adjusted models were analyzed by generalized estimating equations. From analysis of outcome variables across all quartiles of OHVD levels, highest odds ratios Table 4. Multiple regression of serum OHVD levels on measured outcome variables and HOMA-IR
Variables Model 1* Model 2† Model 3‡
Estimate (β) SE P value Estimate (β) SE P value Estimate (β) SE P value
Body mass index -0.09605 0.08722 0.271 -0.1004 0.0875 0.252 -0.09148 0.0886 0.302
Triglyceride -6.9665 3.4221 0.042 -7.1769 3.4575 0.036 -7.9583 3.493 0.023
HDL cholesterol 0.2381 0.5905 0.687 0.2028 0.5949 0.733 0.2429 0.6019 0.687
Glucose 0.1045 1.1383 0.927 -0.5828 1.0936 0.594 -0.6291 1.1062 0.570
Insulin -1.1679 0.456 0.011 -1.3329 0.4565 0.004 -1.3507 0.4614 0.004
HOMA-IR -0.3361 0.1574 0.033 -0.4179 0.1553 0.007 -0.4238 0.1569 0.007
Systolic blood pressure -2.6426 0.8234 0.001 -2.4871 0.8257 0.003 -2.5667 0.8347 0.002
Diastolic blood pressure -2.2071 0.5092 < 0.001 -2.1305 0.5124 < 0.001 -2.1463 0.5184 < 0.001
*Model 1, adjusted for age and sex. †Model 2, adjusted for age, sex, smoking, alcohol, exercise, diabetes, hypertension and dyslipidemia. ‡Model 3, adjusted for all variables in model 2 plus 7-day moving average for amount of sunshine of Seongbuk-gu from the day each subject visited. HDL cholesterol, high-density lipoprotein cholesterol; HOMA-IR, homeostasis model assessment of insulin resistance index.
Fig. 1. Association between log-transformed OHVD levels and various outcome variables by generalized additive mixed models adjusted for age, sex, smoking, drinking, regular exercise, diabetes, hypertension, dyslipidemia, 7-day moving average for sunshine amount of Seongbuk-gu from the day each subject visited. BMI, body mass index; TG, triglyceride; HDL cholesterol, high-density lipoprotein cholesterol; HOMA-IR, homeostasis model assessment of insulin resistance index; SBP, systolic blood pressure; DBP, diastolic blood pressure; log(25(OH)D), log-transformed 25-hydroxyvitamin D.
BMI
4
2
0
-2
log (25[OH]D) 1.0 1.5 2.0 2.5 3.0 3.5 4.0
HDL cholesterol
3 2 1 0 -1 -2 -3
log (25[OH]D) 1.0 1.5 2.0 2.5 3.0 3.5 4.0
TG
30 20 10 0 -10 -20 -30
log (25[OH]D) 1.0 1.5 2.0 2.5 3.0 3.5 4.0
Glucose
5
0
-5
log (25[OH]D) 1.0 1.5 2.0 2.5 3.0 3.5 4.0
Insulin
4 2 0 -2 -4
log (25[OH]D) 1.0 1.5 2.0 2.5 3.0 3.5 4.0
SBP
5
0
-5
log (25[OH]D) 1.0 1.5 2.0 2.5 3.0 3.5 4.0
HOMA-IR
1.5 1.0 0.5 0.0 -0.5 -1.0 -1.5
log (25[OH]D) 1.0 1.5 2.0 2.5 3.0 3.5 4.0
DBP
6 4 2 0 -2 -4 -6
log (25[OH]D) 1.0 1.5 2.0 2.5 3.0 3.5 4.0
for significant variables were estimated at the 75th percentile level of 48.298 nM (data not shown). As 50 nM is the definition level for vitamin D deficiency and as odds ratios at 48.298 nM and 50 nM did not largely differ, we evaluated the estimate ef- fect of vitamin D at 50 nM on abnormal levels of markers. Table 5 shows odds ratios of OHVD deficiency level on abnormal levels of markers across adjusted models. At serum OHVD level of 50 nM, odds ratios and their 95% confidence intervals were signifi- cant with only hypertriglyceridemia category of MS, with simi- lar effect size across all models (odds ratio [OR]: 1.74 [95% con- fidence interval: 1.13-2.70] in model 3).
DISCUSSION
Our results showed statistically significant inverse association of
OHVD levels with IR, TG and blood pressure. Subjects with se- rum OHVD level less than 50 nM showed increased odds ratio of 1.74 for hypertriglyceridemia when we used criteria for MS.
Average serum OHVD level found in our study was 41.66 nM and proportion of vitamin D deficiency (< 50 nM) was 76.6%.
These results are comparable with a population-based cross- sectional study on middle-aged and elderly Chinese popula- tion, which showed that their average OHVD level was 16.19 ng/
mL (40.41 nM) with deficiency proportion of 69.2% (6). Another cross-sectional study on elderly Spanish found average as 17.21 ng/mL (42.96 nM) and proportion of OHVD level below 25 ng/
mL (62 nM) as 86% (15). A cohort study on population over 30 yr old (mean age 49.6) with high risk for type 2 diabetes and/or MS found the average level as 22.36 ng/mL (55.81 nM) (16); the slight- ly higher average level of OHVD in the study could be explained by younger age-distribution of the study population. The lower serum OHVD levels in the elderly is possibly due to specific phys- iological and lifestyle factors linked to advanced age, such as impaired production of 7-dehydrocholesterol in the skin, insuf- ficient exposure to sunlight, poor dietary intake of vitamin D, as well as chronic diseases, pharmacological treatments and dis- ability (17).
Associations of serum OHVD levels and serum lipids have been reported. The Tromsø study in Norway showed significant increase in total cholesterol, HDL cholesterol and LDL choles- terol levels and decrease in serum TG levels across increasing serum OHVD quartiles in cross-sectional study, but significant association was found with serum TG levels only in longitudi- nal study (18). Other cross-sectional studies also supported the association of OHVD levels and lipid levels, but significance was confirmed with TG levels only (19, 20).
Our results on OHVD levels and insulin or HOMA-IR showed
clear inverse relationship, and conforms with previous studies that used HOMA-IR as a marker to indicate IR. Numerous cross- sectional studies, with subjects in varying age group, in non-di- abetic status or in risk of diabetes and/or MS and in various con- founder-adjusted models, reported significant association with low serum OHVD levels and insulin resistance (16, 21-26). In a prospective study on non-diabetic subjects aged 40-69 yr, base- line OHVD level was inversely associated with 10-yr risk of 2-hr glucose, insulin, and HOMA-IR (22).
Recently reported studies favor our finding on the relation- ship of OHVD levels with blood pressure. In a meta-analysis in- cluding 4 prospective studies and 14 cross-sectional studies, the odds ratio for a 16 ng/mL or 39.94 nM (2 SD) increment in se- rum OHVD level was 0.84 (95% CI 0.78-0.90) (27). The same study group also performed a cross-sectional study where they measured supine and 24-hr blood pressure measurements to lessen classification bias. Their results showed that men with OHVD levels < 15.02 ng/mL or < 37.49 nM had a 3-fold higher prevalence of hypertension compared to those with ≥ 15.02 ng/mL or ≥ 37.49 nM (28). In another recent study on initially normotensive, middle-aged Koreans with median OHVD level of 46.8 nM, odds ratio was substantially higher for new hyper- tension after 4 yr in subjects with OHVD levels below the medi- an value compared with those above median (OR 2.74; 95% CI 1.40-5.34) (29).
Relationship between OHVD levels and insulin, HOMA-IR, SBP, DBP as continuous variables in our study showed statisti- cal significance, but relationship between OHVD levels and ‘hy- pertensive’, ‘diabetic’ categories of MS did not. The latter insig- nificant results could be explained by the different value char- acteristics: serum OHVD, FBS levels and blood pressure reflect changes on daily basis while the ‘hypertensive’ and ‘diabetic’
Table 5. Effect of serum OHVD levels on five categories of MS at definition level for vitamin D deficiency (50nM)
Model/variables Estimate (β) SE 95% CI P value OR 95% CI
Model 1*
Body mass index Triglyceride HDL cholesterol Hypertensive Diabetic
-0.0482 0.5498 -0.2177 0.2617 -0.0207
0.188 0.2193 0.1709 0.1887 0.155
-0.4166 0.1201 -0.5528 -0.1083 -0.3245
0.3202 0.9796 0.1173 0.6316 0.283
0.797 0.012 0.203 0.166 0.894
0.95 1.73 0.80 1.30 0.98
0.66 1.13 0.58 0.90 0.72
1.38 2.66 1.12 1.88 1.33 Model 2†
Body mass index Triglyceride HDL cholesterol Hypertensive Diabetic
-0.0669 0.5565 -0.2065 0.2821 0.0245
0.192 0.2209 0.1734 0.1959 0.1582
-0.4432 0.1235 -0.5462 -0.1019 -0.2856
0.3093 0.9895 0.1333 0.6661 0.3347
0.727 0.012 0.234 0.150 0.877
0.94 1.74 0.81 1.33 1.02
0.64 1.13 0.58 0.90 0.75
1.36 2.69 1.14 1.95 1.40 Model 3‡
Body mass index Triglyceride HDL cholesterol Hypertensive Diabetic
-0.0652 0.5488 -0.2126 0.2857 0.0236
0.1928 0.2196 0.1757 0.1952 0.1584
-0.4431 0.1184 -0.5569 -0.0969 -0.2869
0.3126 0.9791 0.1318 0.6682 0.334
0.735 0.012 0.226 0.143 0.882
0.94 1.73 0.81 1.33 1.02
0.64 1.13 0.57 0.91 0.75
1.37 2.66 1.14 1.95 1.40
*Model 1, adjusted for age and sex. †Model 2, adjusted for age, sex, smoking, alcohol and exercise. ‡Model 3, adjusted for all variables in model 2 plus 7-day moving average for sunshine amount of Seongbuk-gu from the day each subject visited. HDL cholesterol, high-density lipoprotein cholesterol.
categories reflect changes on longer term basis, as diabetes and hypertension are disease states attained possibly through years (i.e. not easily changed over time). Another possible explana- tion for the disappeared significance is that the effect of hypovi- taminosis D may not be as influential as to reach body’s “thresh- old” at which diabetes or hypertension can be developed. Al- though insignificant, increased odds ratios of ‘hypertensive’ and
‘diabetic’ categories at vitamin D deficiency level support the assumption (‘hypertensive’: OR 1.33, 95% CI: 0.91-1.95; ‘diabet- ic’: OR 1.02, 95% CI: 0.75-1.40).
Because another Korean study suggested that the relationship between vitamin D and the risk of hypertension might be asso- ciated with a low habitual calcium intake and a high prevalence of vitamin D deficiency in Korea (29), we also analyzed for sig- nificance of total calcium intake across quartiles of OHVD lev- els by ANOVA (Table 2), and found no significant association.
However, we could not further investigate this association in the mixed effects or generalized estimating equation model analy- ses, as calcium intake measurement was taken only once.
To our knowledge, this is the first study that has performed a repeated measure analysis in investigating the effect of OHVD levels on IR and MS. The advantage of this approach over exist- ing cross-sectional analyses is to provide increased power to the outcome association. In mixed models, intra-individual varia- tion as well as inter-individual variation is taken into account, thus providing increased validity for the association. However, it must also be noted that repeated measure analysis is limited in deducing causality.
Our study has several limitations. We did not account for para- thyroid hormone (PTH) levels. With the role of OHVD/PTH axis as maintaining extracellular calcium homeostasis, PTH levels may play a role for the effect of OHVD. However, effects of PTH levels on IR or MS still remains a controversy as the previous results have been inconsistent. In one study, researchers found MS positively related to PTH levels in older men but not in wom- en (9), while other found no evidence of independent associa- tion between PTH levels and MS (5). Another study reported results favoring PTH and not OHVD levels as an independent predictor of MS, but results were limited to morbidly obese Cau- casians (30). A more recent study showed inconsistent associa- tions of PTH levels with IR and MS across different OHVD levels (26). In the study on middle-aged Koreans, serum PTH and cal- cium levels were significantly higher in subjects with MS com- pared with those without, but the association of serum vitamin D levels and MS/hypertension were unchanged after adjustment for PTH and serum calcium levels, indicating that the associa- tions were independent of these factors (29).
Although we adjusted for regular exercise and moving aver- age of sunshine amount on days each subject visited, it would have been more accurate if we adjusted for actual outdoor phys- ical activity and exposure amount to sunshine. Also, although
oral vitamin D supplements are not available in Korea, we did not account for additional measures of vitamin D-rich food in- take.
To allow for ethnicity, we used updated NCEP-ATP III criteria for Asian Americans for definition of MS. However, we used cal- culated BMI instead of waist circumference. Threshold level of 23 kg/m2 was used as this is the level classified as “overweight”
in Asian populations (31). Waist circumference measurements in elderly could be inaccurate; nonetheless, BMI is less reflec- tive of central obesity than waist circumference. Each subjects’
visit dates were on different intervals and seasons. To compen- sate for possible bias effect due to different seasons, we adjust- ed 7-days moving average for total amount of sunshine on each visit date in the final model.
In conclusion, we have found from our repeated measure analysis that decreasing OHVD levels are associated with in- creasing insulin resistance, increasing serum triglyceride levels and increasing blood pressure in elderly Koreans, and confirmed on the risk of ‘hypertriglyceridemia’ in vitamin D deficient sub- jects.
ACKNOWLEDGMENTS
The authors appreciated that Ki-Moon Kim, Gyeong-Hee Cho, and Yu-mi Choi interviewed study participants and did data cleaning of collected data.
REFERENCES
1. Adams JS, Hewison M. Update in Vitamin D. J Clin Endocrinol Metab 2010; 95: 471-8.
2. Holick MF. Vitamin D deficiency. N Engl J Med 2007; 357: 266-81.
3. Alvarez JA, Ashraf A. Role of Vitamin D in insulin secretion and insulin sensitivity for glucose homeostasis. Int J Endocrinol 2010; 2010: 351385.
4. Lauretani F, Maggio M, Valenti G, Dall’aglio E, Ceda GP. Vitamin D in older population: new roles for this ‘classic actor’? Aging Male 2010; 13:
215-32.
5. Lee DM, Rutter MK, O’Neil TW, Boonen S, Vanderschueren D, Bouil- lon R, Bartfai G, Casanueva FF, Finn JD, Forti G, et al. Vitamin D, para- thyroid hormone and the metabolic syndrome in middle-aged and older European men. Eur J Endocrinol 2009; 161: 947-54.
6. Lu L, Yu Z, Pan A, Hu FB, Franco OH, Li H, Li X, Yang X, Chen Y, Lin X.
Plasma 25-hydroxyvitamin D concentration and metabolic syndrome among middle-aged and elderly Chinese individuals. Diabetes Care 2009; 32: 1278-83.
7. Ozfirat Z, Chowdhury TA. Vitamin D deficiency and type 2 diabetes.
Postgrad Med J 2010; 86: 18-25.
8. Pittas AG, Chung M, Trikalinos T, Mitri J, Brendel M, Patel K, Lichten- stein AH, Lau J, Balk EM. Systematic review: vitamin D and cardiometa- bolic outcomes. Ann Intern Med 2010; 152: 307-14.
9. Reis JP, von Mühlen D, Miller ER 3rd. Relation of 25-hydroxyvitamin D and parathyroid hormone levels with metabolic syndrome among US adults. Eur J Endocrinol 2008; 159: 41-8.
10. Song M. The relationship between high-sensitive C-reactive protein and metabolic syndrome in 35,671 health adult population above 40 years of age in Korea, in biomedical Science. Seoul: Seoul National University, 2010. Thesis dissertation.
11. Rubin DB. Inference and missing data. Biometrika 1976; 63: 581-92.
12. Robins JM, Rotnitzky A, Zhao LP. Analysis of semiparametric regression models for repeated outcomes in the presence of missing data. J Am Stat Assoc 1995; 90: 106-21.
13. McCracken J, Baccarelli A, Hoxha M, Dioni L, Melly S, Coull B, Suh H, Vokonas P, Schwartz J. Annual ambient black carbon associated with shorter telomeres in elderly men: Veterans Affairs Normative Aging Study. Environ Health Perspect 2010; 118: 1564-70.
14. Fahrmeir L, Lang S. Bayesian inference for generalized additive mixed models based on Markov random field priors. J R Stat Soc Ser C Appl Stat 2001; 50: 201-20.
15. Almirall J, Vaqueiro M, Baré ML, Anton E. Association of low serum 25-hydroxyvitamin D levels and high arterial blood pressure in the el- derly. Nephrol Dial Transplant 2010; 25: 503-9.
16. Kayaniyil S, Vieth R, Retnakaran R, Knight JA, Qi Y, Gerstein HC, Per- kins BA, Harris SB, Zinman B, Hanley AJ. Association of vitamin D with insulin resistance and ß-cell dysfunction in subjects at risk for type 2 dia- betes. Diabetes Care 2010; 33: 1379-81.
17. Oudshoorn C, van der Cammen TJ, McMurdo ME, van Leeuwen JP, Colin EM. Ageing and vitamin D deficiency: effects on calcium homeo- stasis and considerations for vitamin D supplementation. Br J Nutr 2009; 101: 1597-606.
18. Jorde R, Figenschau Y, Hutchinson M, Emaus N, Grimnes G. High se- rum 25-hydroxyvitamin D concentrations are associated with a favor- able serum lipid profile. Eur J Clin Nutr 2010; 64: 1457-64.
19. Hyppönen E, Boucher BJ, Berry DJ, Power C. 25-hydroxyvitamin D, IGF-1, and metabolic syndrome at 45 years of age: a cross-sectional study in the 1958 British Birth Cohort. Diabetes 2008; 57: 298-305.
20. Martins D, Wolf M, Pan D, Zadshir A, Tareen N, Thadhani R, Felsenfeld A, Levine B, Mehrotra R, Norris K. Prevalence of cardiovascular risk fac- tors and the serum levels of 25-hydroxyvitamin D in the United States:
data from the Third National Health and Nutrition Examination Sur- vey. Arch Intern Med 2007; 167: 1159-65.
21. Chiu KC, Chu A, Go VL, Saad MF. Hypovitaminosis D is associated with
insulin resistance and ß cell dysfunction. Am J Clin Nutr 2004; 79: 820-5.
22. Forouhi NG, Luan J, Cooper A, Boucher BJ, Wareham NJ. Baseline se- rum 25-hydroxy vitamin D is predictive of future glycemic status and in- sulin resistance: the Medical Research Council Ely Prospective Study 1990-2000. Diabetes 2008; 57: 2619-25.
23. Liu E, Meigs JB, Pittas AG, McKeown NM, Economos CD, Booth SL, Jacques PF. Plasma 25-hydroxyvitamin D is associated with markers of the insulin resistant phenotype in nondiabetic adults. J Nutr 2009; 139:
329-34.
24. Pinelli NR, Jaber LA, Brown MB, Herman WH. Serum 25-hydroxy vita- min D and insulin resistance, metabolic syndrome, and glucose intoler- ance among Arab Americans. Diabetes Care 2010; 33: 1373-5.
25. Scragg R, Sowers M, Bell C; Third National Health and Nutrition Exam- ination Survey. Serum 25-hydroxyvitamin D, diabetes, and ethnicity in the Third National Health and Nutrition Examination Survey. Diabetes Care 2004; 27: 2813-8.
26. Zhao G, Ford ES, Li C. Association of serum concentrations of 25-hy- droxyvitamin D and parathyroid hormone with surrogate markers of insulin resistance among U.S. adults without physician-diagnosed dia- betes: NHANES, 2003-2006. Diabetes Care 2010; 33: 344-7.
27. Burgaz A, Orsini N, Larsson SC, Wolk A. Blood 25-hydroxyvitamin D concentration and hypertension: a meta-analysis. J Hypertens 2011; 29:
636-45.
28. Burgaz A, Byberg L, Rautiainen S, Orsini N, Håkansson N, Arnlöv J, SundströmJ, Lind L, Melhus H, Michaëlsson K, et al. Confirmed hyper- tension and plasma 25(OH)D concentrations amongst elderly men. J In- tern Med 2011; 269: 211-8.
29. Kim MK, Il Kang M, Won Oh K, Kwon HS, Lee JH, Lee WC, Yoon KH, Son HY. The association of serum vitamin D level with presence of meta- bolic syndrome and hypertension in middle-aged Korean subjects. Clin Endocrinol (Oxf) 2010; 73: 330-8.
30. Hjelmesaeth J, Hofsø D, Aasheim ET, Jenssen T, Moan J, Hager H, Røis- lien J, Bollerslev J. Parathyroid hormone, but not vitamin D, is associat- ed with the metabolic syndrome in morbidly obese women and men: a cross-sectional study. Cardiovasc Diabetol 2009; 8: 7.
31. WHO Expert Consultation. Appropriate body-mass index for Asian populations and its implications for policy and intervention strategies.
Lancet 2004; 363: 157-63.