(Received November 03, 2015; Revised December 08, 2015; Accepted December 10, 2015)
Corrosion of zirconium fuel cladding is known to limit the lifetime and reloading cycles of fuel in nuclear reactors. Oxide layers formed on ZIRLOTM cladding samples, after immersion for 300-hour and 50-day in a simulated primary water chemistry condition (360 oC and 20 MPa), were analyzed by using the scanning transmission electron microscopy (STEM), in-situ transmission electron microscopy (in-situ TEM) with the focused ion beam (FIB) technique, and X-ray diffraction (XRD). Both samples (immersion for 300 hours and 50 days) revealed the presence of the ZrO sub-oxide phase at the metal/oxide interface and columnar grains developed perpendicularly to the metal/oxide interface. Voids and micro-cracks were also detected near the water/oxide interface, while relatively large lateral cracks were found just above the less advanced metal/oxide interface. Equiaxed grains were mainly observed near the water/oxide interface.
Keywords : ZIRLO, oxide, pre-transition, primary water, in-situ transmissionelectron microscopy
†Corresponding author: bahn@pusan.ac.kr
1. Introduction
Extensive studies have been conducted for a better un- derstanding of corrosion and its failure mechanism of zir- conium fuel cladding in nuclear reactors and thus to pro- long the lifetime and reloading cycles of the fuel for en- hanced plant economics. Considerable amounts of re- searches have been devoted to understand the micro- structure of Zr oxides formed in high temperature water.
Zr oxidation process is known to show a transition behav- ior in terms of oxide growth kinetics (e.g., from cubic to linear growth). It has well reported that a large variation in the width of ZrO sub-oxide phase at different met- al/oxide interface locations was observed, suggesting that the transition is an extremely local process1). This oxide growth kinetics transition has been proposed to be attrib- uted to accumulated stresses during oxide growth and in- terconnection of porosity2). The metal/oxide interface roughness was linked to the location of lateral cracks with- in oxides3). And the formation of the lateral cracks was also associated with the transition of the oxide3,4). The transition was known to be affected by large compressive stresses by the oxide volume expansion5-7). The cracks
found in the oxide are mainly oriented parallel to the met- al/oxide interface. Some researchers suggested that lateral cracks act as obstacles for diffusion of oxidizing species8), while others assumed that they act as easy diffusion paths for surface diffusion9). Bossis et al. reported a porous outer layer in a pre-transition oxide analyzed by a secondary ion mass spectrometry (SIMS) and an electrochemical im- pedance spectroscopy (EIS)3). Cox et al. anticipated that porosity provides connected paths between the external oxidizing medium and the underlying metal10). Ni et al.
reported the interconnected nano-pores along the grain boundaries in the oxide and concluded that development of interlinked porosity down to the metal/oxide interface is a key mechanism for the transition in oxidation ki- netics1). Gong et al. also reported nano-pores in strings formed on Zr-Nb-Y alloy and N18 alloy (Zr-0.39Nb- 0.93Sn-0.31Fe-0.08Cr-0.048O) at grain boundaries, and they suggested that initiation mechanism of porosity is Kirkendall effect11). In the oxide, columnar grains are more dominant in the inner part and equiaxed grains are frequently observed at the oxide surface. It also appears that larger columnar grains have better corrosion resist- ance than smaller equiaxed grains12-14). Gabory et al.
showed large amorphous ZrFeNb precipitates which were observed far away (700 nm) from the metal/oxide inter-
Table 1. Nominal chemical composition of ZIRLOTM tube samples investigated in this work
Nb Sn O Fe C N Hf Zr
Ratio
(wt.%) 0.96 0.76 0.62 0.18 0.1 0.03 0.002 Bal.
Table 2. Dimension of tube sample
Outer diameter Inner diameter Thickness
Scale (mm) 9.5 8.3 0.6
Table 3. Average thickness and standard deviation of oxide formed on 300-hour and 50-day corroded samples
Exposure time Average thickness (nm)
Standard deviation (nm)
300-hour 960 87.62
50-day 1860 119.81
face, while closest small amorphous β-Nb precipitates were found at 400 nm position from the metal/oxide inter- face in ZIRLOTM samples and deduced that large ZrFeNb precipitates can stay unoxidized longer in the oxide than the smaller β-Nb precipitates 15). Tejland and Andrén sug- gested crack initiation mechanism at second phase particle (SPP)16).
We report here microscopic examination of early pre- transition oxide formed on ZIRLOTM cladding tube sam- ples in a simulated primary water chemistry condition by using scanning transmission electron microscopy (STEM), in-situ transmission electron microscopy (in-situ TEM) with focused ion beam (FIB) technique, and X-ray dif- fraction (XRD). Since earlier literatures mainly mentioned the transition and/or post-transition oxides, and the early pre-transition oxide was not well characterized, this work focused on the characterization of the early pre-transition oxide. Initial and early stage behaviors of metal oxidation in aqueous environments are important to understand met- al corrosion.
2. Experimental
Commercial zirconium alloy, ZIRLOTM tube has been oxidized in an autoclave connected to a recirculation water loop at 360 oC and 20 MPa for 300-hour and 50-day under a simulated primary water chemistry condition (pure H2O with dissolved hydrogen of 30 cc/kg, dissolved oxygen of 0~5 ppb, 2 ppm Li as LiOH and 1200 ppm B as H3BO3). Dissolved hydrogen and oxygen were measured by DH and DO meter, respectively. The pressure differ- ence between interior and exterior of the cladding sample was maintained at 11.7 MPa by pressurizing argon gas to 4.56 MPa at room temperature (RT) during the ex- posure in the recirculation loop in order to simulate the compressive stress condition in the actual fuel cladding.
Nominal chemical composition and dimension of test sam-
ple are given in Table 1 and Table 2, respectively. After an immersion corrosion test, a protective coating of plati- num was deposited on the oxide surface, and then in-situ lift-out FIB sectioning was carried out with a FEI Quanta 3D FEG, instrument operated at 2-30 kV, with currents between 1 pA and 65 nA to prepare TEM thin foils. STEM observations were carried out with a high resolution trans- mission electron microscope JEM-2100F (JEOL) operated at 200 kV. The oxygen content at the metal/oxide interface and composition of the second-phase particle (SPP) were characterized, respectively, by an energy dispersive X-ray spectroscopy (EDS) line profile and elemental mapping.
TEM analysis was performed at RT and 360 oC on JEM-3011 (JEOL) operated at 300 kV. Run-time of tem- perature rising from 25 oC to 75 oC and from 75 oC to 100 oC was 3 min and from 100 oC to 360 oC was 75 min, followed by holding at 360 oC for 15 min. Since all samples showed a single oxide layer, it was expected to be a pre-transition oxide. XRD measurements were also conducted with cross-section of bulk ZIRLOTM tube sam- ples using a Bruker D8 ADVANCE instrument to charac- terize crystal structures.
3. Results
3.1. Oxide morphology
Cross-section view of oxide formed in 360 oC water for 300-hour and 50-day is shown in Fig. 1 and an average oxide thickness is estimated to be 0.96 μm and 1.86 μm, respectively. Before the immersion corrosion test, an air-formed oxide is less than 10 nm thick. Table 3 shows the average thickness and the standard deviation of oxide formed on each sample, indicating that the interface un- dulation increases with the exposure time during the pre- transition stage. These results are in good agreement with other study conducted under similar water chemistry con- ditions (simulated primary water condition, 2 ppm Li as LiOH and 1000 ppm B as H3BO3)17). Large lateral cracks related to undulating metal/oxide interface can be clearly seen just above the interface summit in the oxide formed on both 300-hour and 50-day samples in dashed circles
`
Fig. 1. (a) Bright-field STEM images showing the oxide layer of 300-hour corroded sample (b) Dark-field panorama images of (a) (c) Bright-field STEM image showing the oxide of 50-day corroded sample (d) Dark-field image of (c).
(Fig. 1). It should be noted, however, that the width of these large cracks could be extended during the FIB process. Columnar oxide grains near the metal/oxide inter- face as well as equiaxed grains near the water/oxide inter- face can be observed at high resolution TEM images. It seems that cracks tend to have crescent shape in the outer oxide and number of cracks increase with exposure time.
Precipitates are clearly seen near the metal/oxide interface
in both 300-hour and 50-day images, but as approaching closer to the water/oxide interface, they are gradually amorphized.
3.2. Metal/oxide interface
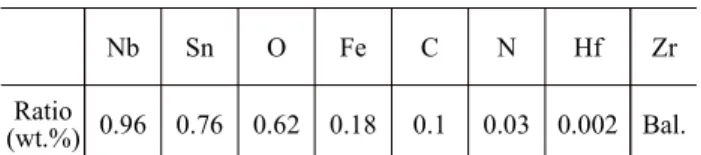
Dark-field TEM images of 300-hour sample showed some local faint area along the metal/oxide interface. EDS
Fig. 2. (a) Dark-field TEM image of 300-hour sample showing the faint area at the metal/oxide interface (b) EDS line profile data of (c) Dark-field TEM image of 300-hour sample showing the clear metal/ oxide interface (d) EDS line profile data of (c) (e) Dark-field TEM image of 50-day sample showing the faint area at the metal/oxide interface.
line profile of one faint area is given in Figs. 2(a) and (b). Since the faint area has Zr:O ratio of 1:1 (between 45 and 55 at.%), this area is assumed as ZrO sub-oxide layer which has about 20 nm width. EDS line profile at the interface that does not contain the sub-oxide layer is shown in Figs. 2(c) and (d). On the contrary, the met- al/oxide interface shown in Fig. 2(c) has a rapid change of Zr:O ratio. This sub-oxide layer also appears in 50-day corroded samples (Fig. 2(e)). However, there is a possi- bility that faint area (believed to be sub-oxide) is a region where metal and oxide overlap through thickness direction of micro size samples. To unambiguously confirm the presence of sub-oxide layer other analyzing methods may have to be used, such as electron energy loss spectroscopy (EELS)1) or microbeam synchrotron radiation diffraction-
fluorescence techniques18). Ni et al. showed ~40 nm thick stoichiometry ZrO layer containing unidentified grains at the metal/oxide interface of 100-day corroded ZIRLOTM recrystallized sample1). Dominance of columnar oxide grains near the metal/oxide interface without porosity, as shown in Fig. 3, is known to have the high resistance to corrosion19).
Fig. 4(a) shows an average value of oxide thickness formed on 300-hour sample measured at different loca- tions in the presence of three types of lateral cracks. In order to characterize the oxide nature of 300-hour sample, three FIB thin foils with the total length of about 30 μm were prepared. Each form of three types of lateral crack is described within the plots. It clearly shows that an aver- age oxide thickness under a large crack (over 500 nm
Fig. 3. Bright-field TEM image showing columnar oxide grains along the metal/oxide interface.
Fig. 4. (a) Average oxide thickness on the 300-hour sample and under three types of lateral crack (b) Average oxide thickness on the 50-day sample and under three types of lateral cracks.
Fig. 5. (a) High resolution TEM images of 300-hour sample showing equiaxed oxide grains and some interlinked voids at the water/oxide interface (b) STEM image of outer oxide formed on 50-day sample.
Fig. 6. XRD data taken from 300-hour and 50-day corroded cross- section of bulk ZIRLOTM tube sample.
length) is much thinner than the overall average oxide thickness. Crack position is known to be related with un- dulated interface. Parise et al. presented stress distribution of undulated interface through metal-oxide system model- ing during Zr alloy oxidation. They showed high tensile stress just above interface summit working perpendicular to metal/oxide interface and proposed that this tensile stress is the cause of lateral cracks frequently seen above interface summit20). However, the oxide thickness under small crack or small cracks (shorter than 320 nm length) near the metal/oxide interface is comparable with the aver- age value in the 300-hour samples. Fig. 4(b) shows an average oxide thickness of 50-day sample. In Fig. 4(b), the even oxide thickness under the large crack was not much different from the average value, which is incon- sistent with the observation in the 300-hour samples.
However, the large crack in the 50-day sample was still
formed just above the interface summit. More analysis with multiple 50-day corroded samples is needed to draw a concrete conclusion.
3.3. Water/oxide interface
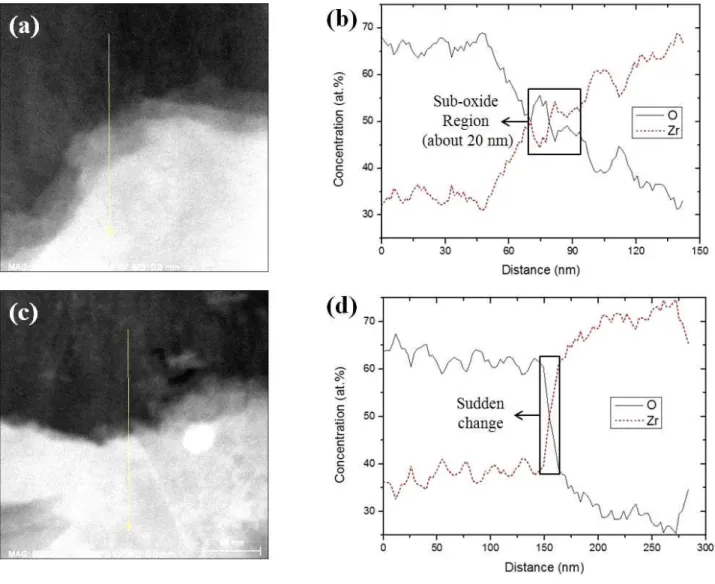
Fig. 5 shows the high resolution TEM images of oxide near the water/oxide interface. In the outer oxide of 300-hour sample, equiaxed oxide grains and some voids which seem to be interlinked are clearly seen in Fig. 5(a).
Outer oxide image of 50-day sample is shown in Fig. 5(b), where outermost equiaxed oxide grains with columnar ox- ide are observed. Fig. 6 shows the XRD spectra of cross- section of bulk ZIRLOTM tube sample tested for 300 hours and 50 days. XRD data shows a minute peak of tetragonal ZrO2 near 30° in 2θ. Peak intensities of monoclinic and tetragonal phases become stronger as the exposure time in the high temperature water increases. However, α-Zr and monoclinic ZrO2 peaks are predominantly present, but zirconium hydride peak is not detected. One can thus pos- tulate that 300-hour and 50-day immersion in 360 oC may not be enough to form zirconium hydride or the volume of zirconium hydride may be too small to be detected.
Fig. 7 shows TEM bright/dark-field images of the oxide near the water/oxide interface. In dark-field images of 300-hour sample (Fig. 7(b)), black spots are observed.
Some black spots of dark-field images turn into white ap- pearances on bright-field images (Fig. 7(a), solid circles), and dashed circle indicates precipitate. Therefore, it is be- lieved that some are voids and others are amorphized pre- cipitates (dashed circle). Outer oxide dark-field images of 50-day sample also clearly reveal some porosity with a crescent shape (see Fig. 7(d)). White spots in Fig. 7(b) could be caused by TEM beam during its operation, and artifact during sample preparation using a FIB technique
Fig. 7. (a) Bright-field TEM images of 300-hour sample oxide near the water/oxide interface (b) Dark-field panorama images of (a) (c) Bright-field panorama STEM images of 50-day sample oxide near water/oxide interface (d) Dark-field panorama images of (c) Solid and dashed circles indicate voids and amorphous precipitate, respectively.
can be remained. More technical discussion on this dam- age or artifact is described later.
3.4. Precipitates
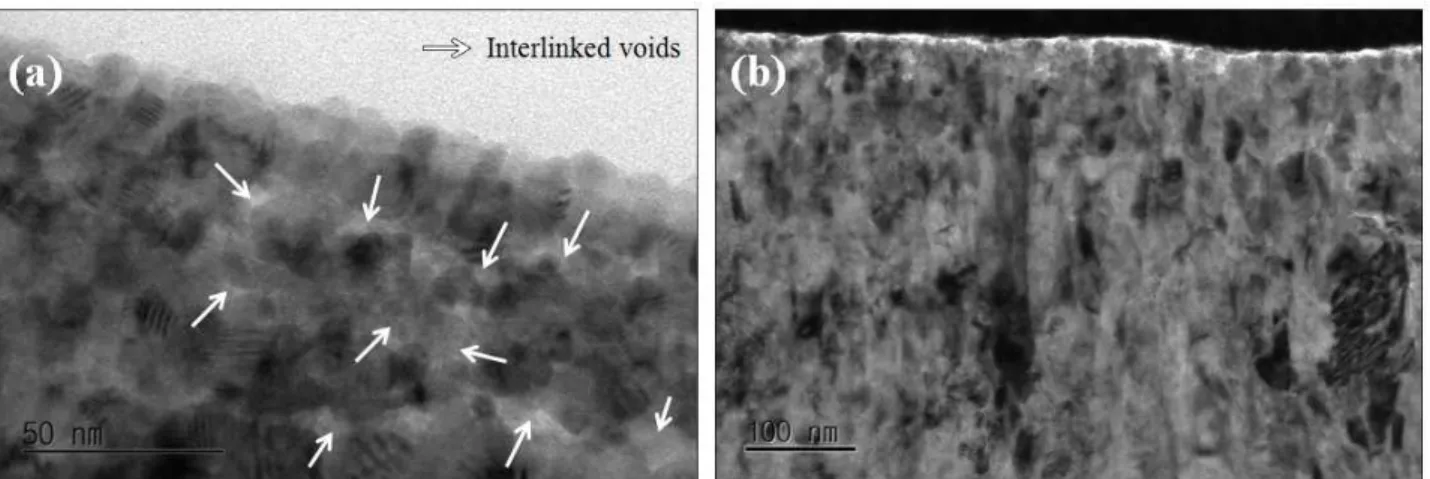
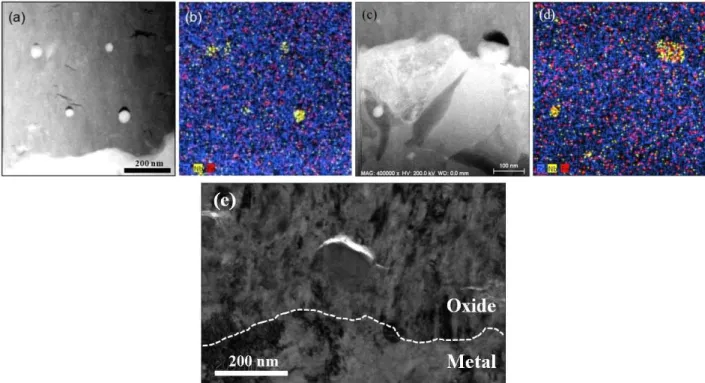
Two types of precipitates are mainly observed in 300- hour and 50-day corroded ZIRLOTM tube samples. They are β-Nb and ZrFeNb precipitates. ZrFeNb precipitate is bigger than β-Nb precipitate. Fig. 8(a) shows smaller β-Nb precipitates in 300-hour sample oxide near the metal/oxide interface, and Fig. 8(b) shows element mapping result.
A few cracks are observed near or on top of precipitates, which may be an artifact during FIB process. Fig. 8(c) shows a large ZrFeNb precipitate located at the met- al/oxide interface and a similar presence and location of crack are observed. Every precipitate in 300-hour sample oxide had a crack on top. The distance between outermost non-amorphized precipitate and the metal/oxide interface is estimated to be 400 nm for 300-hour corroded samples.
Fig. 9 shows TEM images of 50-day corroded sample oxide. It should be noted that a crack is present on top of some precipitates (solid circles) but others do not (dashed circles). Therefore, we conclude that cracks lo- cated on top of precipitate are not formed during the sam- ple preparation by the FIB technique. A theoretical mecha- nism of the crack initiation on top of the precipitates was suggested16).
3.5. In-situ TEM observation
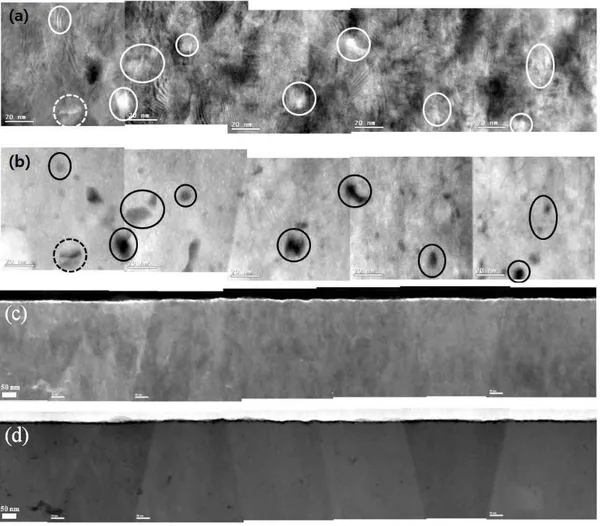
All microscopic examination described above was con- ducted at room temperature. Since the oxidation process occurred at 360 oC, it is worthwhile to raise the specimen temperature to 360 oC and observe if there would be any change in the microstructure, which has been conducted by Kim et al.21). Fig. 10(a) and (b) show the effect of TEM operating temperatures between RT and 360 oC on 300-hour sample oxide near the water/oxide interface,
Fig. 8. (a) Smaller β-Nb precipitates with a crack on top in 300-hour sample oxide near metal/oxide interface. (b) EDS mapping of (a). (c) Bigger ZrFeNb precipitates in 300-hour sample oxide at the metal/oxide interface. β-Nb precipitates are also observed in Zr matrix region (d) EDS mapping of (c) (e) ZrFeNb precipitate in 300-hour sample oxide showing clearly a crack on top.
Fig. 9. Precipitates in the oxide formed on 50-day corroded sample.
Some have a crack on top (solid circles) but others do not (dashed circles).
showing little contrast change, as well as some voids which seem to be interlinked. Contrast change and voids are also identified on 50-day sample (Figs. 10(c) and (d)).
Kim et al. suggested that the contrast change is caused by the difference in thermal expansion coefficient between zirconium matrix and oxide due to lower coefficient of linear thermal expansion of zirconium compared with that of zirconium oxide21). The little contrast change could be also caused by sample bending during temperature rising.
The contrast change was barely noticeable on TEM im- ages of the 50 day-corroded sample near the metal/oxide interface, as shown in Fig. 11. The heating and cooling cycle caused no significant change in the microstructure near the metal/oxide interface except the contrast change, although this observation needs to be supported by the high resolution TEM images. The micro-crack (or cavity) on top of precipitates showed no significant change during the heating and cooling cycle. The damage area composed of a crack network also did not show noticeable change.
4. Discussion
By examining the oxide formed on ZILROTM tube sam- ples which are corroded in 360 oC water in a PWR primary water for the early (300-hour) and mid (50-day) pre-tran- sition, oxide morphologies, phases, and microstructures at each pre-transition stage are analyzed. Such examinations
Fig. 10. (a) TEM images of outer oxide formed on 300-hour corroded sample at RT (b) Images of (a) at 360 oC in the same location (c) TEM images of outer oxide formed on 50-day corroded sample at RT (d) Images of (c) at 360 oC in the same location.
for the early pre-transition stage have not been reported well in literatures.
Some researchers proposed that the interlinked porosity at grain boundaries plays an important role for the tran- sition in oxidation kinetics1,11). In our samples, some voids,
Fig. 11. (a) TEM image of metal/oxide interface of 50-day corroded sample at RT (b) Images of (a) at 360 oC in same location (c) After cooling from 360 oC of (b) in same location. This contrast change is believed to be contributed by the different thermal expansion behaviors between zirconium matrix and zirconium oxide or sample bending during temperature rising.
Fig. 12. EDS element mapping of Ga ion for 50-day corroded sample from the water/oxide interface to metal/oxide interface.
which seem to be interlinked, were observed in the oxide near the water/oxide interface. However, some of them may be artifact formed during sample preparation by the FIB process or beam damage during TEM operation. Therefore,
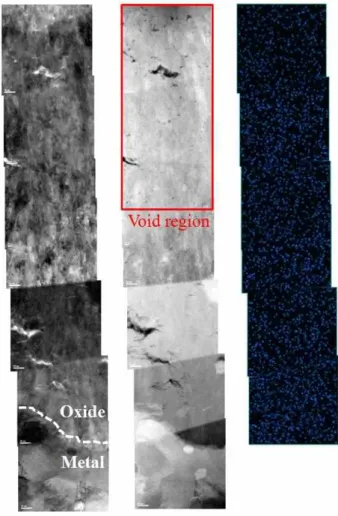
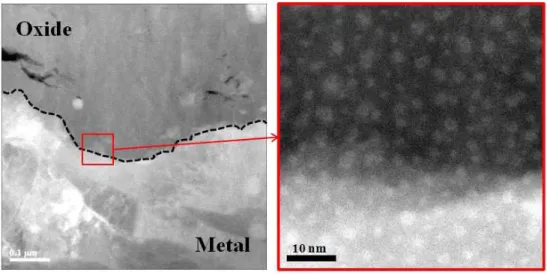
in order to inspect the possible formation of voids by sam- ple preparation, we performed an additional EDS element mapping of Ga from the water/oxide interface to the met- al/oxide interface of the 50-day corroded sample because Ga ions was used during the FIB process. TEM images and EDS results are shown in Fig. 12. If voids are artifact formed during the thin foil preparation by FIB process, Ga concentration through EDS element mapping could show local hot spots where voids are observed. However, from the water/oxide interface to the metal/oxide interface, Ga concentration appears to be uniform in the oxide layer.
Fig. 13 shows The distribution of white spots in Fig. 13 can be typical TEM beam damages by high voltage TEM operation at the metal/oxide interface valley region in the 50-day corroded sample. These TEM beam damages look certainly different from the observed voids. Therefore, it suggests that voids are formed during the actual oxidation process, however more study is needed for a better under- standing of void formation and also plausible mechanisms for the void formation (for example, impurity dissolution).
Other researchers suggested a correlation between tran- sition time and compressive hoop stress in the oxide layer and carried out modeling based on stress20,22). Lateral cracks are often observed in the oxide and on top of pre- cipitates, especially a very large lateral crack is found just above the metal/oxide interface summit. It strongly sug- gests that the undulated metal/oxide interface induced less advanced oxide, which in turn leads to crack formation.
Parise et al.20) showed basis of this assumption through stress distribution modeling about undulated metal/oxide interface. Tejland and Andrén16) suggested a crack ini- tiation mechanism at top of SPP. However, these cracks might be susceptible to be widened during the sectioning by the FIB technique. On the contrary, crescent shape cracks (or cavities) are observed in the oxide near the water/oxide interface. Undulation of the metal/oxide inter-
Fig. 13. STEM dark-field image showing typical TEM beam damage by high voltage TEM operation at the metal/oxide interface valley region in 50-day corroded sample.
face causing unstable stress state is believed to generate lateral cracks near the metal/oxide interface summit, whereas the cause of formation of crescent shape cracks (or cavities) near the water/oxide interface is not well known. It is thus planned to analyze the 100-day corroded ZIRLOTM cladding samples and be compared with 300- hour and 50-day corroded pre-transition samples. If 100- day sample shows increased number density of cavities or micro-cracks at water/oxide interface, this may suggest that cavities or micro-cracks are not just artifact by the FIB sectioning but formed during oxidation.
5. Conclusions
Microscopic examinations by STEM, in-situ FIB-TEM, and XRD were conducted to characterize the oxide formed on ZIRLOTM cladding tube samples oxidized in simulated primary water chemistry conditions. The main conclusions are as follows:
• The 300-hour and 50-day corroded samples show an average oxide thickness 0.96 μm and 1.86 μm, respectively. Lateral cracks and columnar grains are dominant near the metal/oxide interface while crescent shape cracks (or cavities) and equiaxed grains are domi- nant near the water/oxide interface. Large lateral crack and band of large cracks are observed respectively just above the metal/oxide interface summit where is the least advanced in 300-hour and 50-day corroded samples.
• Local sub-oxide layer is shown as faint area on dark- field TEM image along the metal/oxide interface and it has Zr:O ratio of 1:1 (between 45 and 55 at.%) with about 20 nm width in 300-hour corroded samples.
This sub-oxide layer also appears in 50-day corroded samples.
• Some voids are observed in the oxide near water/oxide interface on both early (300-hour) and mid (50-day) pre- transition samples. As approaching close to the metal/
oxide interface, the number density of voids tends to decrease. These voids appear to be actual defects formed/
grown during the oxidation process rather than TEM beam damage or artifact by the FIB process.
• XRD data taken from cross-section of bulk ZIRLOTM tube sample predominantly consist of α-Zr and mono- clinic ZrO2 phases. A minute peak of tetragonal ZrO2
is detected and intensities of these peaks become stron- ger when exposure time increases. However, zirco- nium hydride peak is not detected.
• The oxide near the metal/oxide interface shows little contrast change was analyzed between at RT and at 360 oC. This contrast change is believed to be con- tributed by the different thermal expansion behaviors between zirconium matrix and zirconium oxide or sample bending during temperature rising. However, the micro-crack (or cavity) on top of precipitates shows no significant change during the heating and cooling cycle. The damage area composed of a crack network also showed no noticeable change.
Acknowledgements
This work was financially supported by the International Collaborative Energy Technology R&D Program (No.
20138530030010) of the Korea Institute of Energy Tec- hnology Evaluation and Planning (KETEP).
References
1. N. Ni, D. Hudson, J. Wei, P. Wang, S. Lozano-Perez, G. D. W. Smith, J. M. Sykes, S. S. Yardley, K. L. Moore, S. Lyon, R. Cottis, M. Preuss, C. R. M. Grovenor, Acta Mater., 60, 7132 (2012).
2. A. T. Motta, M. Gomes da Silva, A. Yilmazbayhan, R.
J. Comstock, Z. Cai, B. Lai, J. ASTM Int., 5, 20 (2008).
3. P. Bossis, G. Lelievre, P. Barberis, X. Iltis, F. Lefebvre, ASTM STP., 1354, 918 (2000).
4. J. S. Bryner, J. Nucl. Mater., 82, 84 (1979).
5. B. Griggs, H. P. Maffei, D. W. Shannon, J. Electrochem.
Soc., 109, 665 (1962).
6. B. Lustman, F. Kerze, The Metallurgy of Zirconium, Vol.4, McGraw-Hill, New York (1955).
7. M. Preuss, P. Frankel, E. Polatidis, J. Wei, J. Smith, C.
English, F. Wang, R. Cottis, S. Lyon, S. Lozano-Perez, D. Hodson, N. Ni, C. Grovenor, G. Smith, J. Sykes, A.
Cerezo, S. Storer, M. Fitzpatrick, proceedings of the 16th Int'l Symposium on Zirconium in the Nuclear Industry, J. ASTM Int., USA (2011).
8. N. Ni, S. Lozano-Perez, J. M. Sykes, G. D. W. Smith, C. R. M. Grovenor, Corros. Sci., 53, 4073 (2011).
9. P. Tejland, H. O. Andrén, J. Nucl. Mater., 430, 64 (2012).
10. B. Cox, J. Nucl. Mater., 336, 331 (2005).
11. W. Gong, H. Zhang, C. Wu, H. Tian, X. Wang, Corros.
Sci., 77, 391 (2013).
12. H. J. Beie, F. Garzarolli, H. Ruhmann, H. J. Sell, A.
Mitwalsky, 10th Int'l Symposium on Zirconium in the Nuclear Industry, p. 818, J. ASTM Int., USA (1994).
13. Jeong-Yong Park, Seung-Jo Yoo, Byung-Kwon Choi, Yong Hwan Jeong, J. Alloy. Compd., 437, 274 (2007).
14. A. Yilmazbayhan, E. Breval, A. T. Motta, R. J. Comstock, J. Nucl. Mater., 349, 265 (2006).
15. B. de Gabory, A. T. Motta, K. Wang, J. Nucl. Mater., 456, 272 (2015).
16. P. Tejland, M. Thuvander, H. O. Andrén, S. Ciurea, T.
Andersson, M. Dahlbäck, L. Hallstadius, proceedings of the 16th Int'l Symposium on Zirconium in the Nuclear Industry, p. 595, J. ASTM Int., USA (2011).
17. J. Wei, P. Frankel, E. Polatidis, M. Blat, A. Ambard, R.
J. Comstock, L. Hallstadius, G. D. W. Smith, C. R. M.
Grovenor, M. Klaus, R. A. Cottis, S. Lyon, M. Preuss, Acta Mater., 61, 4200 (2013).
18. D. J. Spengler, A. T. Motta, R. Bajaj, J. R. Seidensticker, Z. Cai, J. Nucl. Mater., 464, 107 (2015).
19. Seung-Jo Yoo, Jeong-Yong Park, Byung-Kwon Choi, Yong- Hwan Jeong, Korean J. Met. Mater., 45, 416 (2007).
20. M. Parise, O. Sicardy, G. Cailletaud, J. Nucl. Mater., 256, 35 (1998).
21. Hyun-Gil Kim, Il-Hyun Kim, Jeong-Yong Park, Seung-Jo Yoo, Jin-Gyu Kim, J. Nucl. Mater., 451, 189 (2014).
22. A. Ly, A. Ambard, M. Blat-Yrieix, L. Legras, P. Frankel, M. Preuss, C. Curfs, G. Parry, Y. Bréchet, J. ASTM Int., 8, 1 (2011).