Abstract :
Key Words :
Surgical management of parathyroid adenoma and hyperplasia
Dal Won Song, M.D.
Department of Otolaryngology,
Keimyung University School of Medicine, Daegu, Korea
261
Table 1. Laboratory findings of presented cases
1 10.6 1.9 13/1.1 77 203.8 7.7/4.6 8.8 3.0 47.0
2 15.1 2.1 10/1.1 193 416.6 7.6/4.9 8.0 3.0 34.3
3 11.9 1.8 12/0.5 2129 1721 7.2/4.9 7.9 4.2 13.6
4 9.7 3.0 62/8.0 814 >3000 6.8/3.8 6.5 3.3 59.8
P ( / ) Total Ca
2+(mEq/ )
Case BUN/Cr
( / )
ALP (IU/ )
PTH (pg/ )
Total protein/
albumin (g/ )
Total Ca
2+(mEq/ ) P ( / )
PTH (pg/ )
Preoperative Postoperative
Table 2. Preoperative localization study and operative results
1 + Right Lower
2 + + Right Lower
3 + + + Right Upper
4 + + Right Upper
Left Upper Right Lower Left Lower + : detected the parathyroid mass; - : can t detected the parathyroid mass; blank : not examined.
Adenoma (3.0 1.0 1.0 cm)
Adenoma (2.3 0.8 0.6 cm)
Hyperplasia (2.9 1.6 0.7 cm)
Hyperplasia (3.0 1.8 1.0 cm
0.8 0.8 0.3 cm 1.3 1.0 0.7 cm 1.3 1.8 1.2 cm) Case
Localization study Ultra-
sonography
Computerized tomography
Parathyroid scan
Pathology and size (cm)
Location of
tumor
Fig. 1. Neck ultrasonogram in case 4 shows 16 8 mm sized hypoechogenic mass at inferior to right thyroid gland.
Fig. 2. Neck dynamic computerized tomogram in case 3 shows 13 22 mm sized well defined low density mass (arrow) lesion behind the right thyroid gland.
Fig. 3. Parathyroid scan (Tc-99m tetrofosmin) in case 1
shows a focal spot (arrow) on inferior pole of
right thyroid gland in early phase, without
washout in delay phase.
263
Fig. 4. A. Microscopic finding in case 1 showing a rim of a tumor mass is well-circumscribed and contains no stromal fat cells (H&E stain, 20). B. A glandular pattern and the majority of tumor cells are composed of closely packed chief cells in same case (H&E stain, 100).
Fig. 5. A. Microscopic finding in case 4 showing a multinodular arrangement of proliferating chief cells (H&E stain,
20). B. Individual nodules were composed of chief cells although nodules of oncocytic cells were also seen
in same case (H&E stain, 100).
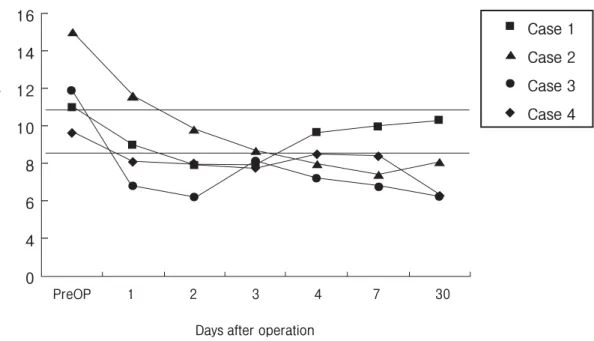
Fig. 6. The graphs show the change of serum calcium level following surgery for hyperparathyroidism (normal range : 8.5-11.0 mEq/ ). PreOP: pre-operation.
- - - - - - -
16 14 12 10 8 6 4 0
Serum calcium, mEq/dL
PreOP
Days after operation
1 2 3 4 7 30
▲
▲
▲
▲
▲ ▲ ▲
▲
●
●
●
● ●
●
●
●
■
■
■ ■
■
■
■
■ ■
■
■ ■
■ ■ ■
■ Case 1
Case 2
Case 3
Case 4
265
Fig. 7. The graphs show the change of parathyroid hormone level following surgery for hyperparathyroidism (normal range : 10-65 pg/ ). PreOP: pre-operation.
- - - - - - - - - -
3000 1800 1700 700 600 500 400 300 200 100 0
PreOP
Months after operation
1 3 6 12 24
▲
▲
▲ ▲ ▲ ▲
●
● ● ● ●
■
■
■ ■ ■■
■
■
■ ■ ■ ■
■■
■
■
▲
●
■