Received on December 10, 2013. Revised on February 4, 2014. Accepted on February 4, 2014.
CC This is an open access article distributed under the terms of the Creative Commons Attribution Non-Commercial License (http://creativecommons.org/licenses/by-nc/3.0) which permits unrestricted non-commercial use, distribu- tion, and reproduction in any medium, provided the original work is properly cited.
*Corresponding Authors. Sun U. Song, Translational Research Center, Inha University School of Medicine, 7-206 Shinheung 3-ga, Jung-gu, Incheon, Korea. Tel: 82-32-890-2460; Fax: 82-32-890-2460; E-mail: [email protected], Myung-Shin Jeon, Translational Research Center, Inha University School of Medicine, 7-206 Shinheung 3-ga, Jung-gu, Incheon, Korea. Tel: 82-32-890-3682; Fax: 82-32-890-2460; E-mail: [email protected]
#These authors equally contributed to this work.
Keywords: hcMSC, Mesenchymal stem cell, Neural differentiation, Microarray, Methylation, Subfractionation culturing method
Abbreviations: MSC, mesenchymal stem cell; hcMSC, human clonal mesenchymal stem cell; SCM, subfractionation cultur- ing method; BM, bone marrow
Molecular Characterization of Neurally Differentiated Human Bone Marrow-derived Clonal Mesenchymal Stem Cells
TacGhee Yi1,2,4#, Hyun-Joo Lee3#, Yun-Kyoung Cho4, Myung-Shin Jeon1,2* and Sun U. Song1,4*
1Translational Research Center, 2Inha Research Institute for Medical Sciences of Biomedical Sciences, and 3Drug Development Program, Department of Medicine, Inha University School of Medicine, Incheon 400-712, 4HomeoTherapy Co. Ltd., Incheon 400-711, Korea
Bone marrow-derived mesenchymal stem cells (MSCs) are multipotent, with the ability to differentiate into different cell types. Additionally, the immunomodulatory activity of MSCs can downregulate inflammatory responses. The use of MSCs to repair injured tissues and treat inflammation, including in neuroimmune diseases, has been extensively explored.
Although MSCs have emerged as a promising resource for the treatment of neuroimmune diseases, attempts to define the molecular properties of MSCs have been limited by the heterogeneity of MSC populations. We recently developed a new method, the subfractionation culturing method, to iso- late homogeneous human clonal MSCs (hcMSCs). The hcMSCs were able to differentiate into fat, cartilage, bone, neuroglia, and liver cell types. In this study, to better under- stand the properties of neurally differentiated MSCs, gene expression in highly homogeneous hcMSCs was analyzed.
Neural differentiation of hcMSCs was induced for 14 days.
Thereafter, RNA and genomic DNA was isolated and sub- jected to microarray analysis and DNA methylation array analysis, respectively. We correlated the transcriptome of hcMSCs during neural differentiation with the DNA methyl- ation status. Here, we describe and discuss the gene ex- pression profile of neurally differentiated hcMSCs. These findings will expand our understanding of the molecular prop- erties of MSCs and contribute to the development of cell
therapy for neuroimmune diseases.
[Immune Network 2014;14(1):54-65]
INTRODUCTION
Adult stem cells have lineage-restricted differentiation poten- tial. They are generally named according to their tissue of origin, for example, as mesenchymal stem cells (MSCs), hem- atopoietic stem cells, and endothelial progenitor cells. MSCs have been isolated from various mesenchymal tissues, includ- ing bone marrow (BM), adipose tissue, and umbilical cord blood (1,2). Because of their multifaceted immunomodulatory functions, MSCs have emerged as an attractive therapeutic ap- proach for the treatment of immune diseases (3). A number of studies have shown that MSCs are effective in treating im- mune-related or inflammatory diseases such as graft-ver- sus-host disease, colitis, and pancreatitis (4-6).
Multilineage plasticity is another property of MSCs. MSCs can differentiate into various cell types found in mesenchymal tissues, such as osteocytes, chondrocytes, and adipocytes (7).
MSCs can differentiate into ectodermal, endodermal, and mes- odermal lineages (8,9). MSCs have been used to repair spinal
cord injury in vivo and to promote neuronal recovery (10).
In addition, MSCs can adopt neuronal and glial phenotypes in vitro under the appropriate conditions (11,12). Whether the neuronal morphology observed during the neurogenic dif- ferentiation of MSCs is an artifact induced by the neurogenic medium is controversial (13,14), but several studies have pre- sented evidence supporting the neural differentiation poten- tial of MSCs (15,16).
Furthermore, MSCs are considered a potent therapeutic tool likely to have practical use in the near future. There have been extensive efforts over the past decade to treat various incurable diseases using stem cells, including neuroimmune disorders such as spinal cord injury, stroke, and multiple scle- rosis (17). Because they are multipotent and immunomo- dulatory, neural stem cells or neural precursor cells are a ther- apeutic option for the treatment of neuroimmune diseases (18,19). However, considering the simplicity of stem cell iso- lation, the ease of cell expansion, and the wide range of ap- plicability, MSCs offer a good alternative for the treatment of neuroimmune diseases, particularly given their neuroglial po- tential and immunomodulatory properties. Therefore, a de- tailed characterization of neurally differentiated MSCs is need- ed to improve cell-based treatments for neuroimmune dis- eases.
The density-gradient centrifugation method is the most popular technique for isolating MSCs from BM (20). MSCs ob- tained by this method are heterogeneous because they con- tain mixed populations of MSCs. Although all of the cells pos- sess MSC characteristics, their cell surface marker expression, differentiation potential, and cytokine secretion vary, suggest- ing that BM contains a variety of MSC populations with differ- ent biological capacities (21). Studies of heterogeneous MSCs have been informative, but the heterogeneity of the cell pop- ulation likely affects the interpretation of data acquired from experiments with these cells. In light of this shortcoming, we recently developed a novel method, the subfractionation cul- turing method (SCM), to isolate and establish homogeneous human clonal MSCs (hcMSCs) from small aspirates of human BM (21). hcMSC lines established with our protocol express well-known MSC markers and differentiate into various cell types, including osteocytes, chondrocytes, and adipocytes.
Additionally, the hcMSC clones express neural or hepatocytic phenotypes after neural or hepatogenic differentiation in vitro.
Although several microarray analyses have examined the expression profiles of MSCs (22,23), we could not find any
studies that analyzed gene expression in homogeneous clonal MSCs during differentiation. Because a number of MSC pop- ulations with different differentiation potentials might be pres- ent in the BM (21), we used hcMSCs with high neurogliogenic potency to compare gene expression before and after neural differentiation. In this study, we verified the neural potency of highly homogeneous hcMSCs and used microarray analysis to assess gene expression during their differentiation into neuroglial cells. Additionally, we performed CpG methylation array analysis and compared methylation status with gene ex- pression to obtain a more reliable profile of gene expression in neurally differentiated hcMSCs.
MATERIALS AND METHODS
Isolation of hcMSCs and cell surface phenotyping using flow cytometry
BM aspirates were taken from the iliac crest of a healthy male donor after informed consent was provided (approved by the INHA University Medical School Institutional Review Board;
IRB Number 10-51). Isolation of hcMSCs was carried out as previously described (21). Several cell surface antigens on the established hcMSC line, named KBHD502, were characterized by flow cytometry. The antibodies used for the analysis were anti-CD14, anti-CD29, anti-CD31, anti-CD34, anti-CD44, an- ti-CD73, anti-CD90, anti-CD105, anti-CD119, anti-CD133, an- ti-CD166, anti-HLA class I, anti-HLA-DR, anti-Stro-1, an- ti-c-Met, and anti-c-Kit (BD Biosciences Pharmingen, San Diego, CA, USA). The cells were analyzed in a FACSCalibur flow cytometer (BD Biosciences). Isotype-matched control antibodies were used as controls.
In vitro immunosuppression assay
The in vitro immunosuppressive activity of hcMSCs was de- termined by [3H]-thymidine incorporation. Briefly, 2×10⁵ pe- ripheral blood mononuclear cells (PBMCs) from two different healthy donors (1×10⁵ cells each) were mixed and cultured in a 96-well plate for mixed lymphocyte reactions. hcMSCs (4×10⁴ cells) were co-cultured at a ratio of 1:5 (hcMSCs:
PBMCs) in these reactions. [3H]-thymidine (1μCi/reaction) was added for the last 12∼16 h of culture. Radioactivity was measured in a beta-counter.
In vitro neural differentiation and immunofluore- scence (IF) staining
For IF staining, the cells were seeded onto an 8-well chamber
slide (Nunc, Naperville, IL, USA) at a density of 1×10⁴ cells/
well. After a 24-h incubation, the growth medium was re- moved and replaced with neurogenic differentiation medium (neurobasal medium supplemented with B27 supplement (Gibco-BRL, Gaithersburg, MD, USA), 1 mM dibutyryl cAMP (Sigma-Aldrich, St. Louis, MO, USA), 0.5 mM 1-methyl-3-iso- butylxanthine (Sigma-Aldrich), 20 ng/ml human epidermal growth factor (Sigma-Aldrich), 40 ng/ml basic fibroblast growth factor (Sigma-Aldrich), 10 ng/ml fibroblast growth factor 8 (Peprotech, Rocky Hill, NJ, USA), and 10 ng/ml brain-derived neurotrophic factor (R&D Systems, Minneapolis, MN, USA).
The cells were cultured in serum-free neurogenic differentia- tion medium for 2 weeks. At the end of the differentiation period, the cells were fixed with 4% paraformaldehyde and permeabilized with 0.5% TritonX-100/PBS. The cells were la- beled with primary antibodies (1:200∼1:1,000), including rabbit anti-human glial fibrillary acidic protein (GFAP; Sigma- Aldrich), mouse anti-neuron-specific class III β-tubulin (Tuj1;
Millipore, Billerica, MA, USA), and rabbit anti-microtubule- as- sociated protein 2 (MAP2; Millipore) overnight at 4oC. After incubation with the primary antibodies, the cells were in- cubated for 1 h with AlexaFluor488- or AlexaFluor594-conju- gated secondary antibodies (1:300; Molecular Probes, Carls- bad, CA, USA). The cells were subsequently stained with 4',6-diamidino-2-phenylindole (DAPI; Molecular Probes) or propidium iodide (PI; Molecular Probes) for 1 min. After mounting, the samples were analyzed by confocal micro- scopy (Zeiss LSM510 Meta Confocal Imaging System; Carl Zeiss, Thornwood, NY, USA). In vitro adipogenic, chondro- genic, hepatogenic, and osteogenic differentiation are de- scribed in the supplemental material (Supplemental Method 1).
Isolation of RNA and RT-PCR
At the end of neurogenic differentiation, total RNA was ex- tracted using TRIzol reagent (Invitrogen, Carlsbad, CA, USA).
cDNA was synthesized using the Reverse Transcription System (Promega, Madison, WI, USA). Semi-quantitative RT- PCR was performed using ExTaq DNA polymerase (Takara Biotechnology, Shiga, Japan). Amplified PCR products were electrophoresed on 1% agarose gels. PCR primer sequences are summarized in the supplemental material (Supplemental Method 2).
Microarray and genome-wide CpG methylation microarray
At the end of the neurogenic differentiation period, total RNA was isolated using TRIzol reagent. The synthesis of Target cRNA probes were synthesized and hybridized using Agilent’s Low RNA Input Linear Amplification kit (Agilent Technology, Palo Alto, CA, USA) according to the manufacturer’s instruc- tion. The Cy3/5-labeled cRNA amplicon was purified on a cRNA Cleanup Module (Agilent Technology). Labeled cRNA was quantified using an ND-1000 spectrophotometer (NanoDrop Technologies, Wilmington, DE, USA). After chec- king the labeling efficiency, the cRNA was fragmented by adding blocking agent and fragmentation buffer and incubat- ing at 60oC for 30 min. The cRNA fragments were re- suspended in hybridization buffer and directly pipetted onto Agilent’s Whole Human Genome Oligo Microarray (44K).
The arrays were hybridized at 65oC for 17 h in an Agilent Hybridization oven (Agilent Technology). According to the manufacturer’s protocol, the hybridized microarrays were washed. For microarray data acquisition and analysis, the hy- bridized arrays were scanned with Agilent’s DNA microarray scanner and quantified with the Feature Extraction software (Agilent Technology). Data was normalized, and regulated genes were identified with GeneSpring GX 7.3.1 (Agilent Technology). The averages of the normalized ratios were cal- culated by dividing the average of the normalized signal channel intensity by the average of the normalized control channel intensity. Functional annotation of genes was carried out according to the guidelines of the Gene Ontology™
Consortium (http://www.geneontology.org/index.shtml) us- ing GeneSpring GX 7.3.1.
For CpG methylation array analysis, genomic DNA samples from control and neurogenically differentiated hcMSCs were extracted using a Wizard Genomic DNA Purification kit (Pro- mega). Genomic DNA was sonicated to an average fragment length of 300 bp using a VCX130 ultrasonic processor (Sonics
& Materials, Newtown, CT, USA) and purified using a QIAquick PCR Purification kit (Qiagen, Valencia, CA, USA).
To isolate methylated genomic DNA, 2μg of His6-tagged methyl DNA-binding protein was incubated with 500 ng of sheared genomic DNA fragments from control and differ- entiated hcMSCs for 8 h at 4oC. The enriched methylated DNA was amplified using a Whole Genome Amplification kit (Sigma-Aldrich). The amplified products from control and dif- ferentiated cells were labeled with Cy3-dUTP and Cy5-dUTP, respectively, using the BioPrime Total for Agilent aCGH sys-
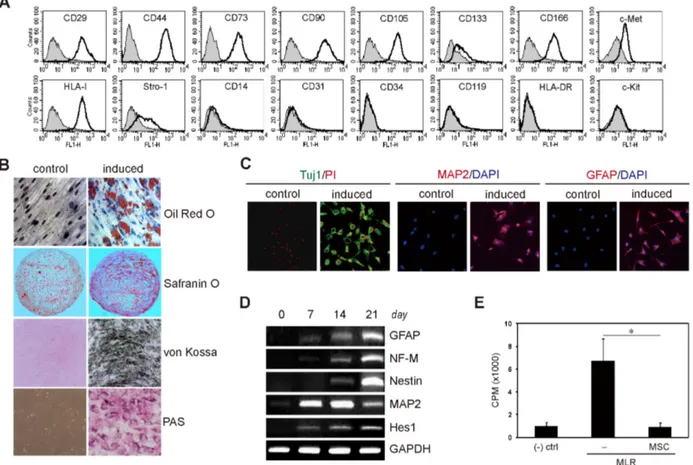
Figure 1. Characterization of hcMSCs and neural differentiation. The hcMSC line was established by SCM. (A) The cell surface markers were analyzed by flow cytometry. The cells were positive for CD29, CD44, CD73, CD90, CD105, CD133, CD166, HLA class I, Stro-1, and c-Met;
however, they were negative for CD14, CD31, CD34, CD119, HLA-DR, and c-Kit. Thus, hcMSCs expressed the cell surface antigens typical of MSCs. (B) To determine the multilineage differentiation potential of the hcMSCs, the cells were cultured in adipogenic, chondrogenic, hepatogenic, and osteogenic medium to induce differentiation. Cytochemical staining showed that the cells differentiated into adipocytes (evaluated with red lipid droplets by oil red O), chondrocytes (evaluated with red glycosaminoglycans by safranin O), hepatocytes (evaluated with red glycogen deposits by periodic acid-Schiff (PAS)), and osteocytes (evaluated with black calcified nodules by von Kossa), respectively. (C) To examine the neural differentiation potential of hcMSCs, the cells were induced for 14 days, and neural marker expression was analyzed by IF staining.
The differentiated cells exhibited neuronal and glial morphology and expressed several neural markers (GFAP, Tuj1, and MAP2), indicating that the hcMSC line has neural differentiation potential, as well as adipogenic, chondrogenic, hepatogenic, and osteogenic differentiation potential.
(D) To confirm the neural differentiation of the hcMSCs at the molecular level, mRNA expression was analyzed. RT-PCR showed that the expression of neuronal and glial marker genes, including NF-M, nestin, MAP2, GFAP, and Hes1, increased during neural differentiation. (E) To assess the immunosuppressive activity of hcMSCs, lymphocyte proliferation in a mixed lymphocyte reaction was measured by [3H]-thymidine incorporation in the presence of hcMSCs. hcMSCs significantly inhibited the proliferation of activated lymphocytes when co-cultured at a ratio of 1:5 (hcMSCs:PBMCs). (-) ctrl, negative control; *p=0.01.
tem (Invitrogen). The labeled DNA samples were mixed and hybridized to a human 244K CpG island microarray (Agilent Technology). The slides were scanned with an Agilent scan- ner, and the images were quantified with the Feature Extraction software (Agilent Technology). Two independent experiments were performed. Data were normalized and dif- ferentially regulated genes were identified using GeneSpring GX 7.3.1 software (Agilent Technology).
RESULTS
We isolated and established several hcMSCs from a healthy donor’s BM by SCM. One clone exhibited excellent multi- lineage plasticity. The clonal cells expressed known MSC markers, including CD29, CD44, CD73, CD90, CD105, CD133, CD166, HLA-class I, and Stro-1; however, they were negative for hematopoietic and endothelial markers, including CD14, CD31, CD34, and HLA-DR (Fig. 1A). Additionally, the cells
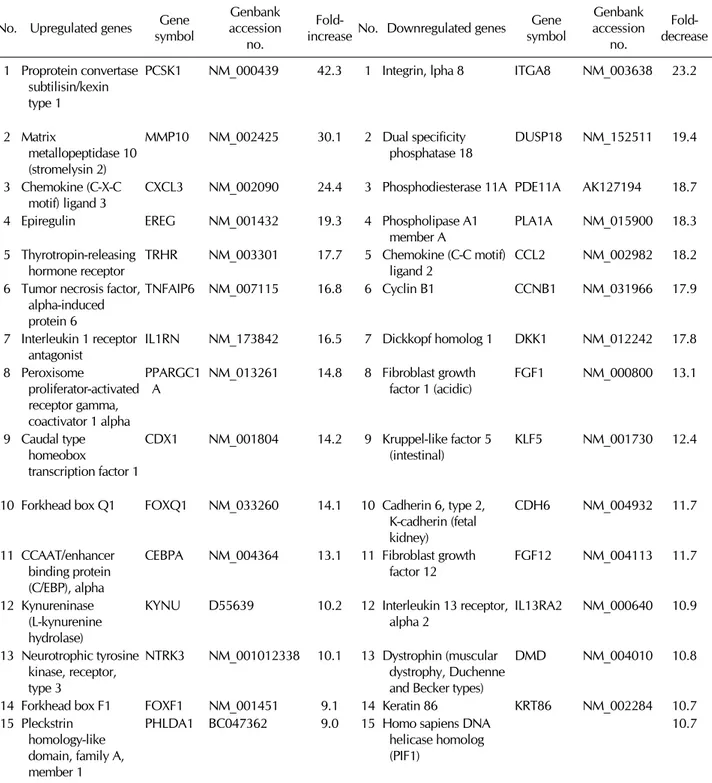
Table I. Top 30 upregulted or downregulated genes in neural differentaiton No. Upregulated genes Gene
symbol
Genbank accession
no.
Fold-
increase No. Downregulated genes Gene symbol
Genbank accession
no.
Fold- decrease 1 Proprotein convertase
subtilisin/kexin type 1
PCSK1 NM_000439 42.3 1 Integrin, lpha 8 ITGA8 NM_003638 23.2
2 Matrix
metallopeptidase 10 (stromelysin 2)
MMP10 NM_002425 30.1 2 Dual specificity
phosphatase 18 DUSP18 NM_152511 19.4 3 Chemokine (C-X-C
motif) ligand 3 CXCL3 NM_002090 24.4 3 Phosphodiesterase 11A PDE11A AK127194 18.7
4 Epiregulin EREG NM_001432 19.3 4 Phospholipase A1
member A PLA1A NM_015900 18.3
5 Thyrotropin-releasing
hormone receptor TRHR NM_003301 17.7 5 Chemokine (C-C motif)
ligand 2 CCL2 NM_002982 18.2
6 Tumor necrosis factor, alpha-induced protein 6
TNFAIP6 NM_007115 16.8 6 Cyclin B1 CCNB1 NM_031966 17.9
7 Interleukin 1 receptor
antagonist IL1RN NM_173842 16.5 7 Dickkopf homolog 1 DKK1 NM_012242 17.8
8 Peroxisome
proliferator-activated receptor gamma, coactivator 1 alpha
PPARGC1
A NM_013261 14.8 8 Fibroblast growth
factor 1 (acidic) FGF1 NM_000800 13.1
9 Caudal type homeobox transcription factor 1
CDX1 NM_001804 14.2 9 Kruppel-like factor 5
(intestinal) KLF5 NM_001730 12.4
10 Forkhead box Q1 FOXQ1 NM_033260 14.1 10 Cadherin 6, type 2, K-cadherin (fetal kidney)
CDH6 NM_004932 11.7
11 CCAAT/enhancer binding protein (C/EBP), alpha
CEBPA NM_004364 13.1 11 Fibroblast growth
factor 12 FGF12 NM_004113 11.7
12 Kynureninase (L-kynurenine hydrolase)
KYNU D55639 10.2 12 Interleukin 13 receptor,
alpha 2 IL13RA2 NM_000640 10.9
13 Neurotrophic tyrosine kinase, receptor, type 3
NTRK3 NM_001012338 10.1 13 Dystrophin (muscular dystrophy, Duchenne and Becker types)
DMD NM_004010 10.8
14 Forkhead box F1 FOXF1 NM_001451 9.1 14 Keratin 86 KRT86 NM_002284 10.7
15 Pleckstrin homology-like domain, family A, member 1
PHLDA1 BC047362 9.0 15 Homo sapiens DNA
helicase homolog (PIF1)
10.7 were positive for c-MET, but negative for CD119 and c-Kit.
The hcMSCs significantly inhibited T cell proliferation in mixed lymphocyte reactions, suggesting that they have in-
trinsic immunomodulatory activity (Fig. 1E). As expected, the cells successfully transdifferentiated into adipocytes, chon- drocytes, hepatocytes, and osteocytes when induced in vitro
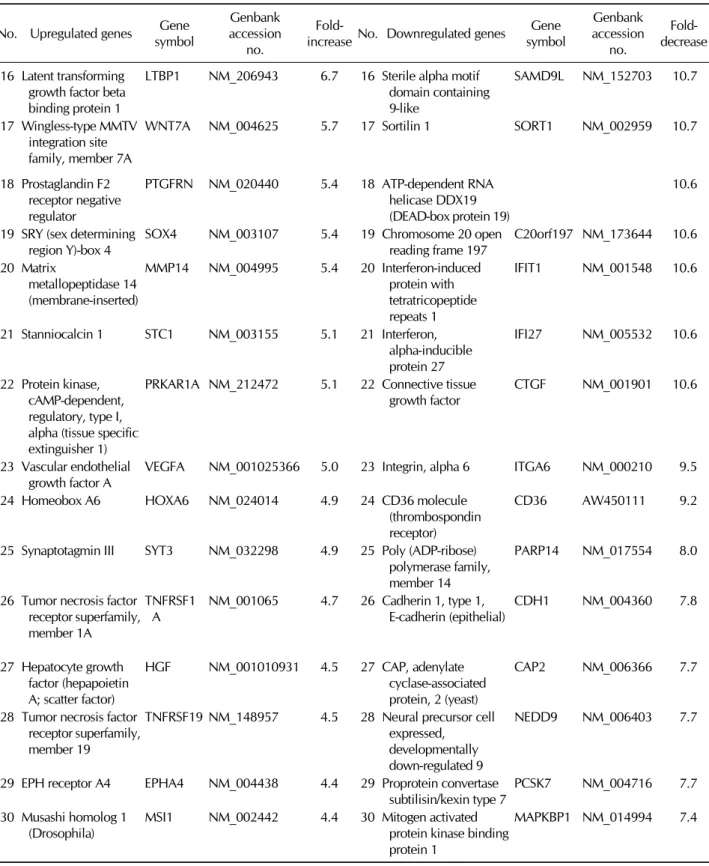
Table I. Continued
No. Upregulated genes Gene symbol
Genbank accession
no.
Fold-
increase No. Downregulated genes Gene symbol
Genbank accession
no.
Fold- decrease 16 Latent transforming
growth factor beta binding protein 1
LTBP1 NM_206943 6.7 16 Sterile alpha motif domain containing 9-like
SAMD9L NM_152703 10.7
17 Wingless-type MMTV integration site family, member 7A
WNT7A NM_004625 5.7 17 Sortilin 1 SORT1 NM_002959 10.7
18 Prostaglandin F2 receptor negative regulator
PTGFRN NM_020440 5.4 18 ATP-dependent RNA helicase DDX19 (DEAD-box protein 19)
10.6
19 SRY (sex determining region Y)-box 4
SOX4 NM_003107 5.4 19 Chromosome 20 open reading frame 197
C20orf197 NM_173644 10.6 20 Matrix
metallopeptidase 14 (membrane-inserted)
MMP14 NM_004995 5.4 20 Interferon-induced protein with tetratricopeptide repeats 1
IFIT1 NM_001548 10.6
21 Stanniocalcin 1 STC1 NM_003155 5.1 21 Interferon, alpha-inducible protein 27
IFI27 NM_005532 10.6
22 Protein kinase, cAMP-dependent, regulatory, type I, alpha (tissue specific extinguisher 1)
PRKAR1A NM_212472 5.1 22 Connective tissue
growth factor CTGF NM_001901 10.6
23 Vascular endothelial
growth factor A VEGFA NM_001025366 5.0 23 Integrin, alpha 6 ITGA6 NM_000210 9.5
24 Homeobox A6 HOXA6 NM_024014 4.9 24 CD36 molecule
(thrombospondin receptor)
CD36 AW450111 9.2
25 Synaptotagmin III SYT3 NM_032298 4.9 25 Poly (ADP-ribose) polymerase family, member 14
PARP14 NM_017554 8.0
26 Tumor necrosis factor receptor superfamily, member 1A
TNFRSF1 A
NM_001065 4.7 26 Cadherin 1, type 1, E-cadherin (epithelial)
CDH1 NM_004360 7.8
27 Hepatocyte growth factor (hepapoietin A; scatter factor)
HGF NM_001010931 4.5 27 CAP, adenylate cyclase-associated protein, 2 (yeast)
CAP2 NM_006366 7.7
28 Tumor necrosis factor receptor superfamily, member 19
TNFRSF19 NM_148957 4.5 28 Neural precursor cell expressed, developmentally down-regulated 9
NEDD9 NM_006403 7.7
29 EPH receptor A4 EPHA4 NM_004438 4.4 29 Proprotein convertase
subtilisin/kexin type 7 PCSK7 NM_004716 7.7 30 Musashi homolog 1
(Drosophila) MSI1 NM_002442 4.4 30 Mitogen activated protein kinase binding protein 1
MAPKBP1 NM_014994 7.4
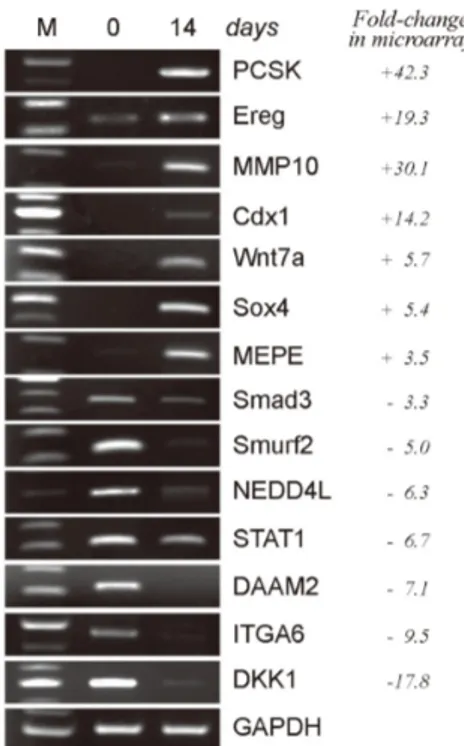
Figure 2. RT-PCR confirmation of the gene expression changes observed in the microarray analysis of neurally differentiated hcMSCs.
After the hcMSCs were differentiated for 14 days, mRNA was extracted and subjected to microarray analysis. To confirm the microarray data, the expression of randomly selected genes that changed 2-fold or more in the microarray analysis was assessed by RT-PCR. + denotes increase and - represents decrease.
with adipogenic, chondrogenic, hepatogenic, and osteogenic medium, respectively (Fig. 1B). Additionally, the cells ex- hibited a neural phenotype when cultured in the appropriate induction medium. After 14 days of differentiation, the cells were fixed and stained for IF analysis. When examined by confocal microscopy, the induced cells were positive for the neuronal and glial markers Tuj1, MAP2, and GFAP (Fig. 1C).
GFAP, neurofilament M (NFM), nestin, MAP2, and Hes1 mRNA levels increased during neural differentiation (Fig. 1D).
The mRNA levels of these neuroglial maker genes were in- creased or maintained for up to 21 days. These results showed that the hcMSC line could acquire a neural pheno- type after appropriate induction.
Although neuronal expression profiles of BM-derived MSCs have been reported (22,24), to our knowledge, no study has assessed a homogeneous MSC population. We chose homo- geneous hcMSCs rather than heterogeneous MSC pools in or- der to improve the reliability of the gene expression data and to eliminate the mixed information obtained from a heteroge- neous MSC population. Two independent RNA samples from the hcMSC line were isolated before and after neural in- duction for 14 days and then subjected to microarray analysis.
The average value of the two independent results was used for data analysis.
The microarray probe set included 27,958 genes. A 2-fold increase over expression in control cells was selected as the threshold for upregulated genes, and a 2-fold decrease was selected as the threshold for downregulated genes. With these criteria, we identified 1025 upregulated genes and 1415 downregulated genes. Table I shows the top 30 upregulated genes and the top 30 downregulated genes in differentiated MSCs. During neural differentiation, the expression of PCSK1, MMP10, and CXCL3 increased 42.3-fold, 30.1-fold, and 24.4- fold, respectively. Conversely, ITGA8, DUSP18, and DKK1 decreased 23.2-fold, 19.4-fold, and 17.8-fold, respectively.
The genes were sorted and classified into several groups ac- cording to gene ontology. We examined the data with respect to neuronal differentiation or nervous system differentiation (Supplemental Table). Forty-three genes, including Ereg, neu- rotrophic tyrosine kinase receptor 3 (NTrk3), Musashi homo- log 1 (MSI1), Sema4G, NDRG2, Amigo1, EphrinB1, Notch3, and Pax6 were upregulated, whereas only 3 genes (MyD88, GDAP2, and RQCD1) were downregulated. NTrk3, Notch3, NDRG2, MSI1, Amigo1, Sema4G, and EphrinB1 play im- portant roles in neurogenesis. The fact that these upregulated genes are involved in neuronal differentiation and nervous
system development provides evidence of the genuine neuro- genic potential of MSCs, refuting some controversial studies that suggest a false-positive gain of neural phenotype in MSCs treated with neural induction reagents.
To verify the gene expression profile generated by the mi- croarray analysis, genes were randomly selected for evalua- tion by RT-PCR (Fig. 2). The expression of PCSK, Ereg, MMP10, Cdx1, Wnt7a, Sox4, and MEPE increased, whereas the expression of Smad3, Smurf2, NEDD4L, STAT1, DAAM2, ITGA6, and DKK1 decreased. These results were consistent with the microarray data, indicating that our microarray ex- periments were highly reliable.
To generate additional gene expression data, we examined epigenetic changes by analyzing promoter methylation and compared the results with the gene expression profile. DNA methylation is a key epigenetic regulatory mechanism for de- velopment and gene expression (25,26) that typically occurs at CpG dinucleotides. Clusters of CpG dinucleotides, called CpG islands, are usually found in mammalian gene promoters
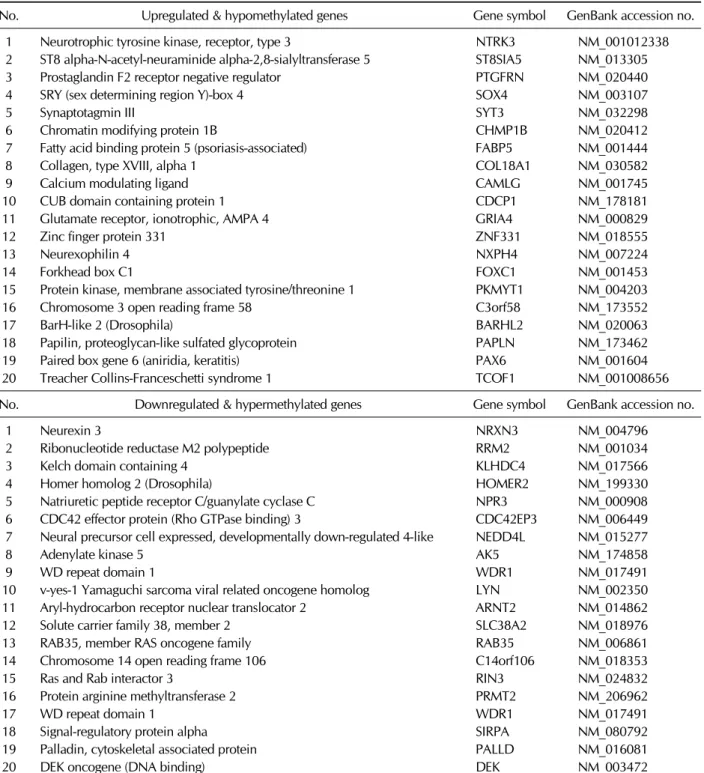
Table II. Promoter methylation patterns of some differentially expressed genes
No. Upregulated & hypomethylated genes Gene symbol GenBank accession no.
1 Neurotrophic tyrosine kinase, receptor, type 3 NTRK3 NM_001012338
2 ST8 alpha-N-acetyl-neuraminide alpha-2,8-sialyltransferase 5 ST8SIA5 NM_013305
3 Prostaglandin F2 receptor negative regulator PTGFRN NM_020440
4 SRY (sex determining region Y)-box 4 SOX4 NM_003107
5 Synaptotagmin III SYT3 NM_032298
6 Chromatin modifying protein 1B CHMP1B NM_020412
7 Fatty acid binding protein 5 (psoriasis-associated) FABP5 NM_001444
8 Collagen, type XVIII, alpha 1 COL18A1 NM_030582
9 Calcium modulating ligand CAMLG NM_001745
10 CUB domain containing protein 1 CDCP1 NM_178181
11 Glutamate receptor, ionotrophic, AMPA 4 GRIA4 NM_000829
12 Zinc finger protein 331 ZNF331 NM_018555
13 Neurexophilin 4 NXPH4 NM_007224
14 Forkhead box C1 FOXC1 NM_001453
15 Protein kinase, membrane associated tyrosine/threonine 1 PKMYT1 NM_004203
16 Chromosome 3 open reading frame 58 C3orf58 NM_173552
17 BarH-like 2 (Drosophila) BARHL2 NM_020063
18 Papilin, proteoglycan-like sulfated glycoprotein PAPLN NM_173462
19 Paired box gene 6 (aniridia, keratitis) PAX6 NM_001604
20 Treacher Collins-Franceschetti syndrome 1 TCOF1 NM_001008656
No. Downregulated & hypermethylated genes Gene symbol GenBank accession no.
1 Neurexin 3 NRXN3 NM_004796
2 Ribonucleotide reductase M2 polypeptide RRM2 NM_001034
3 Kelch domain containing 4 KLHDC4 NM_017566
4 Homer homolog 2 (Drosophila) HOMER2 NM_199330
5 Natriuretic peptide receptor C/guanylate cyclase C NPR3 NM_000908
6 CDC42 effector protein (Rho GTPase binding) 3 CDC42EP3 NM_006449
7 Neural precursor cell expressed, developmentally down-regulated 4-like NEDD4L NM_015277
8 Adenylate kinase 5 AK5 NM_174858
9 WD repeat domain 1 WDR1 NM_017491
10 v-yes-1 Yamaguchi sarcoma viral related oncogene homolog LYN NM_002350
11 Aryl-hydrocarbon receptor nuclear translocator 2 ARNT2 NM_014862
12 Solute carrier family 38, member 2 SLC38A2 NM_018976
13 RAB35, member RAS oncogene family RAB35 NM_006861
14 Chromosome 14 open reading frame 106 C14orf106 NM_018353
15 Ras and Rab interactor 3 RIN3 NM_024832
16 Protein arginine methyltransferase 2 PRMT2 NM_206962
17 WD repeat domain 1 WDR1 NM_017491
18 Signal-regulatory protein alpha SIRPA NM_080792
19 Palladin, cytoskeletal associated protein PALLD NM_016081
20 DEK oncogene (DNA binding) DEK NM_003472
(27). Methylation of the CpG islands in a promoter region inhibits gene expression, whereas lack of methylation permits gene expression (28). Therefore, examining the CpG methyl-
ation status of promoters may provide further insight into gene expression during the neural differentiation of MSCs.
We isolated genomic DNA from hcMSCs before and after neu-
ral induction for 14 days and used CpG methylation micro- array analysis to determine the genome-wide methylation profile.
In differentiated hcMSCs, 1141 promoters were hyper- methylated (≥2-fold increase) and 1276 promoters were hy- pomethylated (≥2-fold decrease) when compared with pro- moters in control hcMSCs. Among the hypomethylated genes, we looked for genes that were upregulated ≥2-fold in the microarray data. Similarly, among the hypermethylated genes, we looked for genes that were downregulated ≥2-fold in the microarray data. We identified 50 genes whose expression was upregulated and whose promoters were hypomethylated, along with 68 genes with downregulated expression and hy- permethylated promoters (Table II). The genes that were up- regulated and hypomethylated included NTrk3, Sox4, SYTIII, FABP5, GRIA4, NXPH4, FoxC1, BARHL2, PAPLN, and Pax6. Among these genes, NTrk3 and Sox4 belonged to the group of 30 genes with the highest expression in differentiated hcMSCs, as listed in Table I. Most of genes in Table II are involved in neurogenesis or nervous system development, confirming the high fidelity of our microarray data. Genes that were downregulated and hypermethylated included NRXN3, Cdc42EP3, NEDD4L, SIRPα, and DEK.
DISCUSSION
Microarray technology enables easy comparison of the differ- ential expression of a large number of genes. However, false-positive results present an obstacle to microarray data analysis. Given that microarray experiments are likely to show variation in their results, sample quality is another crit- ical factor in the analysis. Some studies have determined the gene expression profiles of neural differentiation in MSCs us- ing microarray analysis (16,24). The most common method for isolating MSCs is Ficoll-mediated density gradient cen- trifugation. The resulting MSC pool is heterogeneous because no additional purification process is used in this method.
Even the defined sorting method, which uses specific anti- bodies, might not completely eliminate heterogeneity in the isolated MSC population. We previously developed an easy and simple isolation method for obtaining hcMSCs called SCM (21). Because no reports have described microarray analysis of a homogeneous MSC population, we examined the gene expression profile of neurally differentiated hcMSCs. The mi- croarray results were confirmed with RT-PCR analysis. In ad- dition, we combined the microarray data with independent
promoter methylation chip array data to generate more accu- rate information.
According to the gene ontology analysis, the expression of neuronal-specific genes involved in neuronal differentiation and nervous system differentiation increased in neurally dif- ferentiated hcMSCs (Supplemental Table). Genes involved in synaptic transmission, such as EGR3 (listed in Supplemental Table), SYT3 (listed in Table II), nicotinic cholinergic receptor 5 (not listed, 4.5-fold increase), glycine receptor alpha 3 (not listed, 4.4-fold increase), protocadherin beta 13 (not listed, 3.1-fold increase), neurotensin receptor 1 (not listed, 2.1-fold increase), and a voltage-dependent calcium channel (not list- ed, 2.1-fold increase), were upregulated. Genes encoding channel proteins, including a voltage-gated potassium chan- nel, a glycine receptor, glutamate receptors, nicotinic chol- inergic receptors, and a voltage-dependent calcium channel, were also upregulated (not listed).
The canonical Wnt signaling pathway plays an important role in neurogenesis (29,30). According to our microarray analysis, the Wnt signaling molecule Wnt7a was highly upre- gulated at the mRNA level, whereas DKK1, a Wnt signaling inhibitor, was significantly downregulated 17.8-fold (Table I).
This is consistent with reports describing the functional role of Wnt signaling in neurogenesis (31,32). With regard to Wnt signaling molecules, the genes encoding Axin2 and FZD10 were upregulated, and those encoding TLE4 and DACT1 were downregulated in our microarray analysis (not listed). These results are consistent with those of a recent study demonstrat- ing that FZD10 promotes the development of sensory neurons (33).
One of the interesting gene groups identified in this study comprised E3 ubiquitin protein ligases, which catalyze protein ubiquitination (34,35). Protein ubiquitination is catalyzed by three groups of enzymes, ubiquitin-activating E1 enzymes, ubiquitin-conjugating E2 enzymes, and ubiquitin-ligating E3 ligases. Functionally, the E3 ligase determines which proteins are ubiquitinated. There are two types of E3 ligases: the RING type and the HECT type (36,37). In humans, most E3 ligases are RING-type enzymes; only 28 ligases are HECT-type en- zymes, such as those in the HERC family and NEDD4 family (36,37). In neurally differentiated hcMSCs, the gene encoding NEDD4L was downregulated and its promoter was hyper- methylated (Table II). Other E3 ubiquitin protein ligase genes, including Smurf2 (not listed, 4.2-fold decrease), WWP2 (not listed, 2.3-fold decrease), and NEDD4 (not listed, 6.4-fold de- crease), were also downregulated when assessed by micro-
array analysis. Notably, these genes belong to the NEDD4 family of HECT-type E3 ligases (37). Ubiquitination of Rap1B by Smurf2 is required for neuronal polarity (38). Downregula- tion of Smurf2 expression was confirmed by RT-PCR analysis (Fig. 2). Smurf1 regulates neurite extension through Rho GTPase (39). On the other hand, the expression of other E3 ligase genes increased, including TRIM50 and RNF25 (data not shown). Interestingly, TRIM50 and RNF25 are members of the RING-type E3 ligase family. Future studies will de- termine whether downregulation of specific HECT-type E3 ubiquitin ligases, such as NEDD4L and Smurf2, is functionally correlated with the acquired neuronal phenotype of MSCs.
Smurf2 might be a good candidate for future study because its downregulated expression was verified by RT-PCR (Fig.
2).
Finally, it is notable that TNFAIP6 (16.8-fold increase) and IL1RN (16.5-fold increase) were highly upregulated in neu- rally differentiated hcMSCs (Table I). TNFAIP6, also called TSG-6, plays a critical role in MSC-mediated immunosup- pression (40). TNFAIP6 reduces various inflammatory con- ditions, including myocardial infarction, zymosan-induced peritonitis, and corneal injury (41-43). IL1RN encodes inter- leukin-1 receptor antagonist (IL-1Ra), which can modulate various IL-1-related inflammatory responses by inhibiting IL-1 α and IL-1β (44). Anakinra, an approved IL-1Ra drug used to treat rheumatoid arthritis, has therapeutic effects on a varie- ty of local, systemic, hereditary autoimmune inflammatory diseases (45).
We evaluated the gene expression profile of neurally differ- entiated MSCs using homogeneous clonal cells. To verify the gene expression profile, we confirmed the results from the microarray analysis with RT-PCR and analyzed data obtained from CpG methylation microarray analysis. Our results pro- vide evidence for the neuronal and glial potency of MSCs.
Thus, MSCs can be used for the development of cell therapies that target neuroimmune disorders such as stroke, multiple sclerosis, and Parkinson’s disease. The upregulation of some anti-inflammatory genes, such as TNFAIP6 and IL1RN, during neural differentiation improves the outlook on the therapeutic utility of MSCs. Furthermore, neurogenically induced or neu- rogenically primed hcMSCs retained their immunosuppressive activity against activated T cells in vitro (unpublished data).
Thus, an optimized balance between the immunomodulatory activity and neurogenic potency of MSCs may provide a new therapeutic solution for incurable neuroimmune diseases.
Although our study is only one small step toward under-
standing the biological and molecular properties of MSCs, fur- ther investigation should contribute to the development of stem cell therapy.
ACKNOWLEDGEMENTS
This study was supported by the Bio & Medical Technology Development Program (NRF-2011-0019634 and NRF-2011- 0019637) of the National Research Foundation of the Korean government (MEST), and by a grant from Inha University (44773-01).
CONFLICTS OF INTEREST
The authors have no financial conflict of interest.
REFERENCES
1. Friedenstein, A. J., K. V. Petrakova, A. I. Kurolesova, and G. P. Frolova. 1968. Heterotopic of bone marrow; Analysis of precursor cells for osteogenic and hematopoietic tissues.
Transplantation 6: 230-247.
2. Bernardo, M. E., F. Locatelli, and W. E. Fibbe. 2009.
Mesenchymal stromal cells. Ann. N. Y. Acad. Sci. 1176: 101- 117.
3. Yi, T. and S. U. Song. 2012. Immunomodulatory properties of mesenchymal stem cells and their therapeutic applications.
Arch. Pharm. Res. 35: 213-221.
4. Yoo, H. S., T. Yi, Y. K. Cho, W. C. Kim, S. U. Song, and M. S. Jeon. 2013. Mesenchymal stem cell lines isolated by different isolation methods show variations in the regulation of graft-versus-host disease. Immune Netw. 13: 133-140.
5. Anderson, P., L. Souza-Moreira, M. Morell, M. Caro, F.
O'Valle, E. Gonzalez-Rey, and M. Delgado. 2013. Adipose- derived mesenchymal stromal cells induce immunomo- dulatory macrophages which protect from experimental col- itis and sepsis. Gut 62: 1131-1141.
6. Jung, K. H., S. U. Song, T. Yi, M. S. Jeon, S. W. Hong, H. M. Zheng, H. S. Lee, M. J. Choi, D. H. Lee, and S. S.
Hong. 2011. Human bone marrow-derived clonal mesen- chymal stem cells inhibit inflammation and reduce acute pan- creatitis in rats. Gastroenterology 140: 998-1008.
7. Pittenger, M. F., A. M. Mackay, S. C. Beck, R. K. Jaiswal, R. Douglas, J. D. Mosca, M. A. Moorman, D. W. Simonetti, S. Craig, and D. R. Marshak. 1999. Multilineage potential of adult human mesenchymal stem cells. Science 284: 143-147.
8. Wang, G., B. A. Bunnell, R. G. Painter, B. C. Quiniones, S. Tom, N. A. Lanson, Jr., J. L. Spees, D. Bertucci, A. Peister, D. J. Weiss, V. G. Valentine, D. J. Prockop, and J. K. Kolls.
2005. Adult stem cells from bone marrow stroma differentiate into airway epithelial cells: potential therapy for cystic fibrosis. Proc. Natl. Acad. Sci. USA 102: 186-191.
9. Tao, X. R., W. L. Li, J. Su, C. X. Jin, X. M. Wang, J. X.
Li, J. K. Hu, Z. H. Xiang, J. T. Lau, and Y. P. Hu. 2009.
Clonal mesenchymal stem cells derived from human bone marrow can differentiate into hepatocyte-like cells in injured livers of SCID mice. J. Cell. Biochem. 108: 693-704.
10. Hofstetter, C. P., E. J. Schwarz, D. Hess, J. Widenfalk, A.
El Manira, D. J. Prockop, and L. Olson. 2002. Marrow stromal cells form guiding strands in the injured spinal cord and pro- mote recovery. Proc. Natl. Acad. Sci. USA 99: 2199-2204.
11. Woodbury, D., E. J. Schwarz, D. J. Prockop, and I. B. Black.
2000. Adult rat and human bone marrow stromal cells differ- entiate into neurons. J. Neurosci. Res. 61: 364-370.
12. Deng, W., M. Obrocka, I. Fischer, and D. J. Prockop. 2001.
In vitro differentiation of human marrow stromal cells into early progenitors of neural cells by conditions that increase intracellular cyclic AMP. Biochem. Biophys. Res. Commun.
282: 148-152.
13. Neuhuber, B., G. Gallo, L. Howard, L. Kostura, A. Mackay, and I. Fischer. 2004. Reevaluation of in vitro differentiation protocols for bone marrow stromal cells: disruption of actin cytoskeleton induces rapid morphological changes and mim- ics neuronal phenotype. J. Neurosci. Res. 77: 192-204.
14. Lu, P., A. Blesch, and M. H. Tuszynski. 2004. Induction of bone marrow stromal cells to neurons: differentiation, trans- differentiation, or artifact? J. Neurosci. Res. 77: 174-191.
15. Mareschi, K., M. Novara, D. Rustichelli, I. Ferrero, D. Guido, E. Carbone, E. Medico, E. Madon, A. Vercelli, and F. Fagioli.
2006. Neural differentiation of human mesenchymal stem cells: Evidence for expression of neural markers and eag K+
channel types. Exp. Hematol. 34: 1563-1572.
16. Kim, S., O. Honmou, K. Kato, T. Nonaka, K. Houkin, H.
Hamada, and J. D. Kocsis. 2006. Neural differentiation poten- tial of peripheral blood- and bone-marrow-derived precursor cells. Brain Res. 1123: 27-33.
17. Ankrum, J. and J. M. Karp. 2010. Mesenchymal stem cell therapy: two steps forward, one step back. Trends Mol. Med.
16: 203-209.
18. Einstein, O., N. Fainstein, I. Vaknin, R. Mizrachi-Kol, E.
Reihartz, N. Grigoriadis, I. Lavon, M. Baniyash, H. Lassmann, and T. Ben-Hur. 2007. Neural precursors attenuate auto- immune encephalomyelitis by peripheral immunosuppres- sion. Ann. Neurol. 61: 209-218.
19. Ben-Hur, T. 2008. Immunomodulation by neural stem cells.
J. Neurol. Sci. 265: 102-104.
20. Rickard, D. J., M. Kassem, T. E. Hefferan, G. Sarkar, T. C.
Spelsberg, and B. L. Riggs. 1996. Isolation and character- ization of osteoblast precursor cells from human bone marrow. J. Bone Miner. Res. 11: 312-324.
21. Song, S. U., C. S. Kim, S. P. Yoon, S. K. Kim, M. H. Lee, J. S. Kang, G. S. Choi, S. H. Moon, M. S. Choi, Y. K. Cho, and B. K. Son. 2008. Variations of clonal marrow stem cell lines established from human bone marrow in surface epito- pes, differentiation potential, gene expression, and cytokine secretion. Stem Cells Dev. 17: 451-461.
22. Tondreau, T., M. Dejeneffe, N. Meuleman, B. Stamatopoulos, A. Delforge, P. Martiat, D. Bron, and L. Lagneaux. 2008.
Gene expression pattern of functional neuronal cells derived from human bone marrow mesenchymal stromal cells. BMC Genomics 9: 166-176.
23. Shakhbazov, A. V., N. V. Goncharova, S. M. Kosmacheva, N. A. Kartel, and M. P. Potanev. 2009. Plasticity of human msesnchymal stem cell phenotype and expression profile un- der neurogenic conditions. Cell Technol. Biol. Med. 2: 513- 516.
24. Yamaguchi, S., S. Kuroda, H. Kobayashi, H. Shichinohe, S.
Yano, K. Hida, K. Shinpo, S. Kikuchi, and Y. Iwasaki. 2006.
The effects of neuronal induction on gene expression profile in bone marrow stromal cells (BMSC)-a preliminary study us- ing microarray analysis. Brain Res. 1087: 15-27.
25. Reik, W., W. Dean, and J. Walter. 2001. Epigenetic repro- gramming in mammalian development. Science 293: 1089- 1093.
26. Jaenisch, R. and A. Bird. 2003. Epigenetic regulation of gene expression: how the genome integrates intrinsic and environ- mental signals. Nat. Genet. 33 Suppl: 245-254.
27. Larsen, F., G. Gundersen, R. Lopez, and H. Prydz. 1992.
CpG islands as gene markers in the human genome.
Genomics 13: 1095-1107.
28. Bird, A. P. and A. P. Wolffe. 1999. Methylation-induced re- pression--belts, braces, and chromatin. Cell 99: 451-454.
29. Lee, J. E., S. F. Wu, L. M. Goering, and R. I. Dorsky. 2006.
Canonical Wnt signaling through Lef1 is required for hypo- thalamic neurogenesis. Development 133: 4451-4461.
30. Gulacsi, A. A. and S. A. Anderson. 2008. Beta-catenin-medi- ated Wnt signaling regulates neurogenesis in the ventral telencephalon. Nat. Neurosci. 11: 1383-1391.
31. Toledo, E. M., M. Colombres, and N. C. Inestrosa. 2008. Wnt signaling in neuroprotection and stem cell differentiation.
Prog. Neurobiol. 86: 281-296.
32. Kuwabara, T., J. Hsieh, A. Muotri, G. Yeo, M. Warashina, D. C. Lie, L. Moore, K. Nakashima, M. Asashima, and F. H.
Gage. 2009. Wnt-mediated activation of NeuroD1 and retro- elements during adult neurogenesis. Nat. Neurosci. 12: 1097- 1105.
33. Garcia-Morales, C., C. H. Liu, M. Abu-Elmagd, M. K.
Hajihosseini, and G. N. Wheeler. 2009. Frizzled-10 promotes sensory neuron development in Xenopus embryos. Dev.
Biol. 335: 143-155.
34. Ardley, H. C. and P. A. Robinson. 2005. E3 ubiquitin ligases, Essays Biochem. 41: 15-30.
35. Deshaies, R. J. and C. A. Joazeiro. 2009. RING domain E3 ubiquitin ligases. Annu. Rev. Biochem. 78: 399-434.
36. Li, W., M. H. Bengtson, A. Ulbrich, A. Matsuda, V. A. Reddy, A. Orth, S. K. Chanda, S. Batalov, and C. A. Joazeiro. 2008.
Genome-wide and functional annotation of human E3 ubiq- uitin ligases identifies MULAN, a mitochondrial E3 that regu- lates the organelle's dynamics and signaling. PLoS One 3:
e1487.
37. Rotin, D. and S. Kumar. 2009. Physiological functions of the HECT family of ubiquitin ligases. Nat. Rev. Mol. Cell Biol.
10: 398-409.
38. Schwamborn, J. C., M. Muller, A. H. Becker, and A. W.
Puschel. 2007. Ubiquitination of the GTPase Rap1B by the ubiquitin ligase Smurf2 is required for the establishment of neuronal polarity. EMBO J. 26: 1410-1422.
39. Bryan, B., Y. Cai, K. Wrighton, G. Wu, X. H. Feng, and M.
Liu. 2005. Ubiquitination of RhoA by Smurf1 promotes neu-
rite outgrowth. FEBS Lett. 579: 1015-1019.
40. Prockop, D. J. and J. Y. Oh. 2012. Mesenchymal stem/stro- mal cells (MSCs): role as guardians of inflammation. Mol.
Ther. 20: 14-20.
41. Lee, R. H., A. A. Pulin, M. J. Seo, D. J. Kota, J. Ylostalo, B. L. Larson, L. Semprun-Prieto, P. Delafontaine, and D. J.
Prockop. 2009. Intravenous hMSCs improve myocardial in- farction in mice because cells embolized in lung are activated to secrete the anti-inflammatory protein TSG-6. Cell Stem Cell 5: 54-63.
42. Oh, J. Y., G. W. Roddy, H. Choi, R. H. Lee, J. H. Ylostalo, R. H. Rosa, Jr., and D. J. Prockop. 2010. Antiinflammatory protein TSG-6 reduces inflammatory damage to the cornea following chemical and mechanical injury. Proc. Natl. Acad.
Sci. USA 107: 16875-16880.
43. Choi, H., R. H. Lee, N. Bazhanov, J. Y. Oh, and D. J.
Prockop. 2011. Anti-inflammatory protein TSG-6 secreted by activated MSCs attenuates zymosan-induced mouse peritonitis by decreasing TLR2/NF-κB signaling in resident macro- phages. Blood 118: 330-338.
44. Dripps, D. J., B. J. Brandhuber, R. C. Thompson, and S. P.
Eisenberg. 1991. Interleukin-1 (IL-1) receptor antagonist binds to the 80-kDa IL-1 receptor but does not initiate IL-1 signal transduction. J. Biol. Chem. 266: 10331-10336.
45. Dinarello, C. A., A. Simon, and J. W. van der Meer. 2012.
Treating inflammation by blocking interleukin-1 in a broad spectrum of diseases. Nat. Rev. Drug Discov. 11: 633-652.