Survival prognoses of Heng intermediate-risk patients with metastatic renal cell carcinoma
treated with immunotherapy or targeted therapy:
A real-world, single-center retrospective study
Sung Han Kim1 , Dong-Eun Lee2 , Jae Young Joung1 , Ho Kyung Seo1 , Kang Hyun Lee1 , Jinsoo Chung1
1Department of Urology, Center for Prostate Cancer, Research Institute and Hospital of National Cancer Center, Goyang, 2Biostatistics Collaboration Team, Research Core Center, Research Institute and Hospital of National Cancer Center, Goyang, Korea
Purpose: This study aimed to compare progression-free survival (PFS), overall survival (OS), and cancer-specific survival (CSS) in Heng intermediate-risk patients with metastatic renal cell carcinoma (mRCC) treated with first-line immunotherapy (IT) or targeted therapy (TT).
Materials and Methods: From 2000 to 2017, a total of 186 intermediate-risk mRCC patients treated with first-line IT (n=64, 34.4%) or TT (n=122, 65.6%) were retrospectively evaluated for PFS, OS, and CSS using the Kaplan–Meier method with log-rank test and Cox proportional hazards models for their risk factors with a p-value for significance of <0.05.
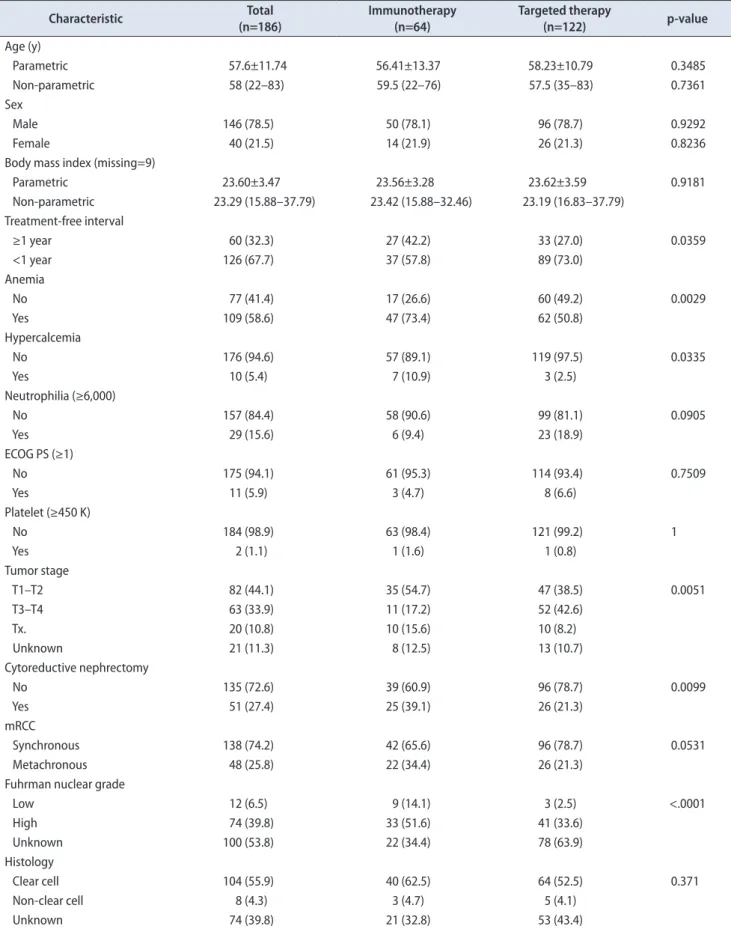
Results: During a median 5.08-month of systemic treatment and 92.22 months of follow-up, the median PFS, OS, and CSS were 5.16, 18.44, and 19.04 months, respectively. The comparison of baseline characteristics between the two groups showed a significantly higher rate of T3–4 stages, a lower rate of high nuclear grades, shorter follow-up, longer treatment durations, lesser rates of cyto- reductive nephrectomy, a lower objective response rate, and no cases of complete response in the TT group compared with the IT group (p<0.05). The survival comparisons between the two groups showed that PFS was significantly different, whereas OS and CSS were not significantly different. The multivariate analyses showed that synchronous metastatic type(hazard ratio [HR], 2.285), IT (HR, 1.746), and treatment-free interval <1 year (HR, 1.926) were significant factors for PFS, whereas none of the risk factors were significant for OS or CSS.
Conclusions: TT significantly prolonged PFS compared with IT, whereas long-term survival was not significantly different in inter- mediate-risk mRCC patients.
Keywords: Carcinoma, renal cell; Immunotherapy; Molecular targeted therapy; Neoplasm metastasis; Prognosis
This is an Open Access article distributed under the terms of the Creative Commons Attribution Non-Commercial License (http://creativecommons.org/licenses/by-nc/4.0) which permits unrestricted non-commercial use, distribution, and reproduction in any medium, provided the original work is properly cited.
Received: 22 August, 2019 • Accepted: 11 November, 2019
Corresponding Author: Jinsoo Chung https://orcid.org/0000-0003-2251-5331
Department of Urology, Center for Prostate Cancer, National Cancer Center, 323 Ilsan-ro, Ilsandong-gu, Goyang 10408, Korea TEL: +82-31-920-2456, FAX: +82-31-920-2474, E-mail: [email protected]
ⓒ The Korean Urological Association
www.icurology.org
Investig Clin Urol 2020;61:146-157.
https://doi.org/10.4111/icu.2020.61.2.146 pISSN 2466-0493 • eISSN 2466-054X
INTRODUCTION
Since the introduction of targeted therapy (TT), immu- notherapy (IT) with multiple cytokine therapies has been substituted for diverse targeted agents, which were the standard systemic therapy for metastatic renal cell carci- noma (mRCC) [1]. The advantage of TT is that it is relatively well tolerated and targets specific angiogenetic receptors with less severe adverse effects than IT and with improved survival prognoses, with markedly extended progression-free survival (PFS) intervals and observed CSS rates of 16 to 26 months [2]. However, the weakness of TT is the insignificant difference in long-term survival, including very few cases of complete remission, and dismal 5-year survival rates of ap- proximately 10%.
Estimating prognosis is important for planning a thera- peutic strategy in patients with mRCC; however, diverse and unexpected prognostic outcomes are frequently encountered in clinical practice. Thus, many researchers have developed prognostic risk assessment to classify patients into favor- able-, intermediate-, and poor-risk groups according to their survival prognoses to better predict therapeutic outcomes [3,4].
One of the most commonly used risk stratification systems is the International Metastatic Renal Cell Carcinoma Da- tabase Consortium (IMDC) model, also known as the Heng prognostic criteria [3]. The Heng criteria were established in the TT era and were validated with mRCC patients who were administered TT [5]; however, these criteria also have good predictability for mRCC patients treated with IT [6].
The criteria comprise six readily assessable parameters:
time from diagnosis to treatment (treatment-free interval, TFI), Karnofsky performance status, hemoglobin, neutrophil count, platelet count, and serum calcium concentration.
Among the three Heng risk groups, the favorable- and poor-risk groups have uniform survival outcomes, whereas the intermediate-risk group, which has one or two risk pa- rameters, is composed of a wide range of diverse patients with variable disease burdens and clinicopathologic charac- teristics, resulting in unpredictable and diverse responses to systemic therapy compared with the favorable- and poor-risk groups [7-9]. This was because patients were grouped with various heterogeneous people with heterotrophic and pleo- morphic tumor burdens and with different clinicopathologic characteristics, including different pathophysiology and met- abolic activity [10,11]. Several previous studies have addressed the necessity of understanding survival outcomes according to more specific stratification of intermediate-risk patients to increase the predictability of survival outcomes. There- fore, this retrospective study analyzed PFS, caner-specific
survival (CSS), and overall survival (OS) in intermediate- Heng-risk mRCC patients treated with TT compared with IT in the first-line setting and evaluated the significant risk factors for the three survival outcomes.
MATERIALS AND METHODS
1. Ethics statement
Following approval of this retrospective study by the Institutional Review Board (IRB) of the National Cancer Center (approval number: NCC2016-0263), the IRB waived the requirement for written informed consent. All patient data were anonymized and deidentified before our analysis.
All study protocols were performed in accordance with the ethical tenets of the Declaration of Helsinki.
2. Patient criteria and evaluation tools
The medical records of 186 mRCC patients with interme- diate Heng risk and treated with IT or TT between January 2000 and December 2017 were retrospectively reviewed after the exclusion of those with incomplete medical records, aged
<20 years, or unavailable for follow-up. All the included mRCC patients were of intermediate Heng risk [12] and had undergone a complete evaluation after every 1 to 4 cycles (6–12 weeks) of IT and every 2 cycles of TT (12 weeks). The follow-up protocol, which included laboratory and imaging evaluations, was described in detail previously [6].
Treatment continued until disease progression was de- tected. Patients were further stratified into groups with a TFI <1 year or ≥1 year and into metastatic types of either synchronous or metachronous. Other ages, gender, Eastern Cooperative Oncology Group Performance Status (ECOG PS), anemia, hypercalcemia, neutrophilia, thrombocytosis, histology, clinical TN stage [13], Fuhrman nuclear grade [14], treatment duration, and survival outcomes including PFS, CSS, and OS were evaluated as baseline characteristics of each IT and TT group to analyze the predictive risk factors of survival outcomes. The Response Evaluation Criteria in Solid Tumors v1.1 (RECISTv1.1) was used to determine the therapeutic response to systemic therapy [15].
3. Treatment regimens
The choice of first-line systemic agent (IT or TT) was at the discretion of the treating urologist (J.C.) according to each patient’s pathology and coverage by the National Health Insurance System, as described previously [6]. Com- bination IT comprised subcutaneous recombinant human interleukin (IL)-2 (Proleukin; Chiron Italia s.r.l., Milan, Italy) and recombinant human interferon (IFN)-α (IFN-alpha-2a,
Table 1. Comparison of baseline characteristics between the immunotherapy and targeted therapy mRCC groups
Characteristic Total
(n=186)
Immunotherapy (n=64)
Targeted therapy
(n=122) p-value
Age (y)
Parametric 57.6±11.74 56.41±13.37 58.23±10.79 0.3485
Non-parametric 58 (22–83) 59.5 (22–76) 57.5 (35–83) 0.7361
Sex
Male 146 (78.5) 50 (78.1) 96 (78.7) 0.9292
Female 40 (21.5) 14 (21.9) 26 (21.3) 0.8236
Body mass index (missing=9)
Parametric 23.60±3.47 23.56±3.28 23.62±3.59 0.9181
Non-parametric 23.29 (15.88–37.79) 23.42 (15.88–32.46) 23.19 (16.83–37.79) Treatment-free interval
≥1 year 60 (32.3) 27 (42.2) 33 (27.0) 0.0359
<1 year 126 (67.7) 37 (57.8) 89 (73.0)
Anemia
No 77 (41.4) 17 (26.6) 60 (49.2) 0.0029
Yes 109 (58.6) 47 (73.4) 62 (50.8)
Hypercalcemia
No 176 (94.6) 57 (89.1) 119 (97.5) 0.0335
Yes 10 (5.4) 7 (10.9) 3 (2.5)
Neutrophilia (≥6,000)
No 157 (84.4) 58 (90.6) 99 (81.1) 0.0905
Yes 29 (15.6) 6 (9.4) 23 (18.9)
ECOG PS (≥1)
No 175 (94.1) 61 (95.3) 114 (93.4) 0.7509
Yes 11 (5.9) 3 (4.7) 8 (6.6)
Platelet (≥450 K)
No 184 (98.9) 63 (98.4) 121 (99.2) 1
Yes 2 (1.1) 1 (1.6) 1 (0.8)
Tumor stage
T1–T2 82 (44.1) 35 (54.7) 47 (38.5) 0.0051
T3–T4 63 (33.9) 11 (17.2) 52 (42.6)
Tx. 20 (10.8) 10 (15.6) 10 (8.2)
Unknown 21 (11.3) 8 (12.5) 13 (10.7)
Cytoreductive nephrectomy
No 135 (72.6) 39 (60.9) 96 (78.7) 0.0099
Yes 51 (27.4) 25 (39.1) 26 (21.3)
mRCC
Synchronous 138 (74.2) 42 (65.6) 96 (78.7) 0.0531
Metachronous 48 (25.8) 22 (34.4) 26 (21.3)
Fuhrman nuclear grade
Low 12 (6.5) 9 (14.1) 3 (2.5) <.0001
High 74 (39.8) 33 (51.6) 41 (33.6)
Unknown 100 (53.8) 22 (34.4) 78 (63.9)
Histology
Clear cell 104 (55.9) 40 (62.5) 64 (52.5) 0.371
Non-clear cell 8 (4.3) 3 (4.7) 5 (4.1)
Unknown 74 (39.8) 21 (32.8) 53 (43.4)
Roferon-A; Hoffmann-La Roche Inc., Nutley, NJ, USA).
All TTs were administered either orally or intravenously with the recommended regimen of the National Compre- hensive Cancer Network (NCCN) guidelines, from 2005 until 2017 (available at https://www.nccn.org/professionals/physi- cian_gls/pdf/kidney.pdf). First-line TT comprised sunitinib, sorafenib, pazopanib, or temsirolimus. Of the 122 patients who received TT, 73 patients (61.9%) received sunitinib, 15 patients (12.7%) received sorafenib, and 30 patients (25.4%) received pazopanib. The target agent regimens were de- scribed previously [6,11].
An overlapping period of 10 years between 2007 and 2017 existed. During the overlapping period, the National Health Insurance System in Korea changed; IT was considered the first-line therapy for mRCC before 2007, and then subse- quently, TT became the first-line therapy since 2007 while IT became the second-line therapy. However, a small portion of patients still received an interleukin therapy as the first- line therapy until 2010. In addition, interferon therapy was at times also given as a second-line and third-line therapy after TT.
4. Statistical analysis
Baseline characteristics of Heng intermediate-risk pa- tients were expressed as frequency with percentage for categorical variables and median with range or mean with standard deviation for continuous variables. Differences be-
tween the IT and TT groups were compared by using t-test, Wilcoxon rank sum test, chi-square test, and Fisher`s exact test as appropriate. The Kaplan–Meier method was used to compute the probabilities of survival, and comparison of survival curves was performed by use of log-rank tests. Cox proportional hazard models were used to identify the prog- nostic factors. The multivariable model was performed with the backward variable selection method with an elimination criterion of 0.1. All statistical analyses were considered sta- tistically significant at a p-value <0.05 and were performed by using SAS (version 9.4, SAS Institute Inc., Cary, NC, USA) and R Foundation for Statistical Computing (version 3.5.2).
RESULTS
The median age of the 186 patients was 58 years (range, 22–83 years) and the ratios of histology, clinical T stages, and Fuhrman nuclear grades were 55.9%/4.3% for clear cell/
non-clear-cell, 44.1%/33.9%/10.8% for T1–2/T3–4/Tx. stages, and 6.5%/39.8%/53.8% for low/high/unknown grades. Dur- ing a median of 5.1 months of systemic treatment and 92.22 months of follow-up, the median PFS, OS, and CSS were 5.16, 18.44, and 19.04 months, respectively, and the RECISTv1.1 responses were 1.6%, 18.8%, 42.5%, 19.9%, and 17.2% for com- plete response, partial response, stable disease, progressive disease, and unknown, respectively (Table 1). The comparison of baseline characteristics between the two groups showed a Table 1. Continued
Characteristic Total
(n=186)
Immunotherapy (n=64)
Targeted therapy
(n=122) p-value
RECIST criteria v1.1
CR 3 (1.6) 3 (4.7) 0 (0.0) 0.0033
PR 35 (18.8) 4 (6.3) 31 (25.4)
SD 79 (42.5) 28 (43.8) 51 (41.8)
PD 37 (19.9) 16 (25.0) 21 (17.2)
Unknown 32 (17.2) 13 (20.3) 19 (15.6)
Treatment duration (mo)
Median (min-max) 5.08 (0.53–122.66) 4.04 (0.53–122.66) 5.84 (0.53–74.56) 0.0021
Follow-up duration (mo)
Median (95% CI) 92.22 (78.21–174.48) 174.48 (88.87–184.11) 78.21 (38.93–92.22) 0.0003 Overall survival (mo)
Median (95% CI) 18.44 (13.58–20.52) 18.66 (9.57–23.80) 18.44 (13.32–21.01) 0.3409 Progression-free survival (mo)
Median (95% CI) 5.16 (4.83–6.54) 4.08 (2.37–5.06) 7.00 (5.16–9.27) 0.0006
Cancer-specific survival (mo)
Median (95% CI) 19.04 (14.89–21.34) 19.04 (9.83–26.83) 18.97 (13.58–21.90) 0.4674 Values are presented as mean±standard deviation, median (range), or number (%) unless otherwise indicated.
ECOG PS, Eastern Cooperative Oncology Group Performance Status; mRCC, metastatic renal cell carcinoma; CR, complete response; PR, partial response; SD, stable disease; PD, progressive disease; CI, confidence interval.
significantly higher rate of T3–4 stages, a lower rate of high nuclear grades, a shorter duration of follow-up, longer treat- ment durations, lesser rates of cytoreductive nephrectomy, a lower objective response rate, and no cases of complete re- sponse in the TT group compared with the IT group (p<0.05, Table 1).
Of the 186 patients included in the analysis, 88 (47.3%) underwent secondary treatment and 73 patients (83.0%) had progression since the start of the second treatment. In addi- tion, 72 patients (81.8%) received TT as a second treatment and 16 patients (18.2%) received IT. The median PFS, OS, and CSS were 4.50, 10.65, and 12.0 months, respectively, for the second-line therapy (Table 2).
The multivariable analyses using metastatic types of either synchronous or metachronous mRCC, systemic thera- peutic agents of either IT or TT, TFI of less than or greater than 1 year, cytoreductive nephrectomy, clinical T stages, ECOG PS, and presence of anemia, thrombocytosis, hypercal- cemia, and neutrophilia showed that synchronous metastatic type (hazard ratio [HR], 2.285; 95% confidence interval [CI], 1.154–4.523), IT (HR, 1.746; 95% CI, 1.257–2.426), and TFI of less than 1 year (HR, 1.926; 95% CI, 0.997–3.720) were signifi- cant factors for PFS (p<0.05, Table 3), whereas none of risk factors were significantly left in the model for OS and CSS (p>0.05, Table 4).
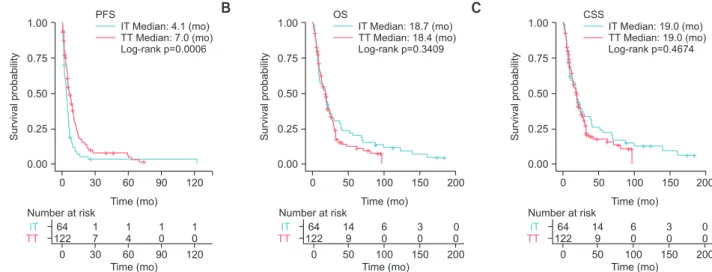
The Kaplan–Meier curve of each survival shown for a comparison between IT and TT in Fig. 1A that only PFS was significantly different (IT, 4.1 months vs. TT, 7.0 months;
p<0.05). The comparison of OS and CSS showed that IT (18.7/19.0 months) and TT (18.4/19.0 months) had approxi- mately similar survival results (p>0.05; Fig. 1B, C).
The Kaplan–Meier survival analysis according to the predictive risk factors including TFI of 1 year, systemic agents, and metastatic types for PFS showed that TT (7.0/5.5/8.0/4.8 months) had significantly longer PFS than IT Table 2. Baseline characteristic of patients undergoing second-line
treatment
Characteristic Total (n=88)
Age (y)
Mean±SD 56.19±10.09
Median(min-max) 55.0 (36.0-83.0)
Sex
Male 66 (75.0)
Female 22 (25.0)
Body mass index (missing=5)
Mean±SD 23.65±3.60
Median (min–max) 23.41 (16.83–37.79) IT and TT
IT 16 (18.2)
TT 72 (81.8)
Treatment-free interval
≥1 year 20 (22.7)
<1 year 68 (77.3)
Anemia
No 39 (44.3)
Yes 49 (55.7)
Hypercalcemia
No 87 (98.9)
Yes 1 (1.1)
Neutrophilia (≥6,000)
No 76 (86.4)
Yes 12 (13.6)
ECOG PS (≥1)
No 84 (95.5)
Yes 4 (4.5)
Platelet (≥450 K)
No 87 (98.9)
Yes 1 (1.1)
Tumor stage
T1–T2 33 (37.5)
T3–T4 39 (44.3)
Tx. 7 (8.0)
Unknown 9 (10.2)
Cytoreductive nephrectomy
No 61 (69.3)
Yes 27 (30.7)
mRCC
Synchronous 70 (79.5)
Metachronous 18 (20.5)
Fuhrman nuclear grade
Low 3 (3.4)
High 39 (44.3)
Unknown 46 (52.3)
Histology
Clear cell 54 (61.4)
Non-clear cell 3 (3.4)
Unknown 31 (35.2)
Table 2. Continued
Characteristic Total (n=88)
2nd Treatment duration (mo)
Median (min–max) 3.68 (0.23–84.03)
Overall survival (mo)
Median (95% CI) 10.65 (8.52–14.33)
Progression-free survival (mo)
Median (95% CI) 4.50 (2.99–5.22)
Cancer-specific survival (mo)
Median (95% CI) 12.0 (9.63–18.97)
Values are presented as number (%) unless otherwise indicated.
SD, standard deviation; IT, immunotherapy; TT, targeted therapy; ECOG PS, Eastern Cooperative Oncology Group Performance Status; mRCC, metastatic renal cell carcinoma; CI, confidence interval.
(4.6/4.0/4.5/3.8 months), respectively (p<0.05) (Fig. 2).
DISCUSSION
Since the introduction of TT, improvement in prognostic survival of mRCC has been demonstrated, especially in PFS, whereas long-term gains in OS or CSS were not reached un- til the recent introduction of immune checkpoint inhibitors (nivolumab, ipilimumab) and the newly introduced targeted agents (axitinib, cabozantinib) [16,17]. The results of the pres- ent study also support the prognostic outcomes of TT com- pared with IT similar to previous studies in that significant
differences were not shown in OS or CSS, but only in first- line PFS in intermediate-risk mRCC (Table 1, Fig. 1). This advantage of prolonged PFS in TT was expected because TT is commonly known to have less severe adverse effects and higher tolerability of therapy than IT. The insignificant differences in OS and CSS between the two groups can be explained by various reasons.
First, because PFS is a short-term terminology of survival and OS and CSS are long-term survival terminology, OS and CSS might be affected by various lines of sequential appli- cations of multiple targeted agents after the failure of first-, second-, and third-line TT. Second, heterotrophically and Table 3. The Cox proportional hazards model of predictive factors of progression-free survival
Characteristic n (event) Univariable Multivariable (p<0.1)
(n=186/event=166) p-value (n=186/event=166) p-value mRCC group
MM 138 (121) 1 1
SM 48 (45) 1.405 (0.996–1.981) 0.0526 2.285 (1.154–4.523) 0.0177
Body mass index 177 (158) 0.997 (0.952–1.045) 0.9017
Therapy
Targeted therapy 64 (61) 1 1
Immunotherapy 122 (105) 1.742 (1.263–2.404) 0.0007 1.746 (1.257–2.426) 0.0009
Cytoreductive nephrectomy
No 135 (117) 1
Yes 51 (49) 1.115 (0.793–1.567) 0.5319
Tumor stage
T1–T2 82 (74) 1 0.3903
T3–T4 63 (55) 0.848 (0.506–1.422) 0.5329
Tx. 20 (18) 0.710 (0.415–1.213) 0.2098
Treatment–free interval
≥1 year 60 (52) 1 1
<1 year 126 (114) 0.925 (0.665–1.285) 0.6412 1.926 (0.997–3.720) 0.051
Anemia
No 77 (65) 1
Yes 109 (101) 1.318 (0.964–1.803) 0.0835
Hypercalcemia
No 176 (157) 1
Yes 10 (9) 1.253 (0.636–2.469) 0.5151
Neutrophilia (≥6,000)
No 157 (145) 1
Yes 29 (21) 0.872 (0.551–1.382) 0.5601
ECOG PS (≥1)
No 175 (159) 1
Yes 11 (7) 0.495 (0.231–1.058) 0.0697
Platelet (≥450 K)
No 184 (164) 1
Yes 2 (2) 0.685 (0.170–2.764) 0.5947
Values are presented as hazard ratio (95% confidence interval) unless otherwise indicated.
mRCC, metastatic renal cell carcinoma; MM, metachronous metastasis; SM, synchronous metastasis; ECOG PS, Eastern Cooperative Oncology Group Performance Status.
pleomorphically diverse tumor cell types are encountered in mRCC, leading to different metabolic and pathophysiologic activities within the tumor microenvironment. Thus, differ- ent metastatic tumors are influenced by different therapies in different organs, resulting in newly acquired therapeutic resistance and decreased therapeutic resistance [18]. Last, the different mechanism of action needed for therapeutic action between IT and TT might be another influencing factor, as discussed later in this discussion section.
The diverse heterogeneity of the intermediate-risk mRCC group has been an important issue of debate since this group of patients led to unpredictable clinical outcomes
after systemic treatment compared with other favorable and poor-risk mRCC groups [4-10]. Many researchers have tried to find factors to classify the intermediate-risk group into more thoroughly divided prognostic risk subgroups [7-9].
This study proved two significant risk factors, TFI <1 year (HR, 0.894) and metastatic type (synchronous vs. metachro- nous; HR, 1.444) in the multivariate analysis and Kaplan–
Meir curve with log-rank comparison (p<0.05; Table 2, Fig. 1).
In a study by Tanaka et al. [8] of 245 patients with mRCC, approximately one-quarter of the patients were reclassi- fied into different risk groups of the IMDC model after TT administration in the first-line and second-line settings; the Table 4. The Cox proportional hazards model of predictive factors of overall survival
Characteristic Overall survival (univariable) Cancer-specific survival (univariable) n (event) (n=186/event=157) p-value n (event) (n=186/event=145) p-value mRCC group
MM 138 (114) 1 138 (103) 1
SM 48 (43) 0.864 (0.605-1.236) 0.4239 48 (42) 0.952 (0.661-1.37) 0.7897
Body mass index 177 (150) 0.970 (0.925-1.018) 0.2231 177 (138) 0.961 (0.913-1.011) 0.1212 Therapy
Targeted therapy 64 (58) 1 64 (54) 1
Immunotherapy 122 (99) 0.849 (0.606-1.19) 0.3416 122 (91) 0.879 (0.62-1.246) 0.4678 Cytoreductive nephrectomy
No 135 (111) 1 135 (102) 1
Yes 51 (46) 0.818 (0.579-1.155) 0.2534 52 (43) 0.834 (0.583-1.193) 0.3207
Tumor stage
T1–T2 82 (73) 1 0.6288 82 (67) 1 0.5818
T3–T4 63 (52) 1.164 (0.812-1.669) 0.4077 63 (49) 1.178 (0.811-1.711) 0.3892
Tx. 20 (18) 1.206 (0.717-2.031) 0.4802 20 (17) 1.248 (0.729-2.137) 0.4192
Treatment-free interval
≥1 year 60 (50) 1 60 (48) 1
<1 year 126 (107) 1.222 (0.87-1.717) 0.2481 126 (97) 1.139 (0.803-1.615) 0.4657
Anemia
No 77 (56) 1 77 (48) 1
Yes 109 (101) 1.158 (0.834-1.608) 0.3795 109 (97) 1.31 (0.926-1.854) 0.1274
Hypercalcemia
No 176 (148) 1 176 (136) 1
Yes 10 (9) 0.89 (0.45-1.762) 0.7382 10 (9) 0.987 (0.497-1.958) 0.9693
Neutrophilia (≥6,000)
No 157 (138) 1 157 (128) 1
Yes 29 (19) 1.145 (0.706-1.859) 0.5831 29 (17) 1.076 (0.646-1.792) 0.7785
ECOG PS (≥1)
No 175 (153) 1 175 (141) 1
Yes 11 (4) 0.526 (0.194-1.427) 0.2072 11 (4) 0.554 (0.204-1.504) 0.2467
Platelet (≥450 K)
No 184 (156) 1 184 (144) 1
Yes 2 (1) 1.009 (0.14-7.241) 0.9932 2 (1) 1.051 (0.147-7.543) 0.9603
Values are presented as hazard ratio (95% confidence interval) unless otherwise indicated.
mRCC, metastatic renal cell carcinoma; MM, metachronous metastasis; SM, synchronous metastasis; ECOG PS, Eastern Cooperative Oncology Group Performance Status.
reclassification included 15.7% of favorable-risk patients reclassified as intermediate risk, 21.6% of intermediate-risk patients reclassified as poor risk, and 65.5% of poor-risk pa- tients reclassified as intermediate risk. Our research team also previously suggested that the neutrophil-to-lymphocyte ratio and other risk factors significantly potentiated the subgroup classifications of the current intermediate-risk group with better predictors of prognosis than the Heng risk criteria [19].
TFI with a 1-year cut-off came from the time from diag- nosis to treatment from the Heng risk criteria [5], which is a well-known prognostic risk factor for mRCC [20-23]. It indi- rectly depicted the growth rate and aggressiveness of the tu- mor. A tumor with a TFI of <1 year might suggest a rapidly growing, aggressively invading, or metastasizing tumor with hypermetabolic states. In contrast, a TFI ≥1 year might indi- cate a slowly progressing tumor with low metabolic activity and less aggressiveness [22]. This study also supported the statements that IT might be more suitable for patients with slow-growing mRCC with a TFI ≥1 year and that TT might be adequate for fast-growing mRCC because an interesting finding was observed when intermediate-risk patients were stratified by TFI. In terms of PFS, the TT group was associ- ated with superior PFS (7.0/5.5 months) regardless of TFI compared with the IT group (4.6/4.0 months, p<0.05). Howev- er, the IT group had insignificantly better OS/CSS than the TT group (25.2 vs. 20.1 months) among patients with a TFI
≥1 year (p>0.05, Fig. 2D–F), whereas the TT group had insig- nificantly better OS/CSS (TT, 18.3/18.9 vs. IT, 14.9/19.0 months, p>0.05; Fig. 2G–L).
These results might be explained by the mechanism of action of each systemic therapy in the tumor environment
and corporal immune system. IT is suitable for slow-glowing tumors with low metabolic activity because it needs time for antigen presentation and boosting of the cellular and ac- quired immune system with delayed sequential therapeutic responses to attack the tumor and prevent tumor growth, resulting in long-term, durable responses in mRCC patients [24,25]. On the contrary, TT directly attacks multiple specific vascular-related target receptors of tumor cells and peri-tu- moral vessels for antiangiogenesis in the tumor microenvi- ronment quickly enough to induce rapid tumor necrosis and inhibition without neovascularization [17,26-28]. Accordingly, these therapeutic mechanisms might induce the combination of TT with IT to improve prognostic survival and to increase the long-term curable state in mRCC. Recent immune check- point inhibitors and other immune therapies have shown an increased rate of long-term durable states in recent clinical trials [24,26-28], changing first-line therapeutic settings in the international European Association of Urology (EAU) [16]
and NCCN guidelines v2019 [17].
Another significant prognostic factor found for PFS in this study was the metastatic type of either metachronous or synchronous mRCC. The metastatic type also implied other significant prognostic factors, such as nephrectomy and the aforementioned time from diagnosis to treatment [29,30]. Metachronous mRCC treated by nephrectomy to re- move the primary kidney tumor had better prognostic HRs than synchronous mRCC. Bozkurt et al. [31] demonstrated a potential prognostic value of late recurrence in terms of PFS, OS, and objective response rate: among 86 patients with mRCC who received TT, those 56 metachronous mRCC pa- tients had recurrence within 5 postoperative years and had significantly worse survival. Kroeger et al. [21] investigated
0 30 60 90 120
1.00
0.75
0.50
probabilitySurvival 0.25
Time (mo) 0.00
IT TT
Number at risk 64 122
0 1 7 30
1 4 60
1 0 90
1 0 120 Time (mo)
IT TT
Median: 4.1 (mo) Median: 7.0 (mo) Log-rank p=0.0006 PFS
0 50 100 150 200
1.00
0.75
0.50
probabilitySurvival 0.25
Time (mo) 0.00
IT TT
Median: 18.7 (mo) Median: 18.4 (mo) Log-rank p=0.3409 OS
0 50 100 150 200
1.00
0.75
0.50
probabilitySurvival 0.25
Time (mo) 0.00
IT TT
Median: 19.0 (mo) Median: 19.0 (mo) Log-rank p=0.4674
A B C CSS
IT TT
Number at risk 64 122
0 14
9 50
6 0 100
3 0 150
0 0 200 Time (mo)
IT TT
Number at risk 64 122
0 14
9 50
6 0 100
3 0 150
0 0 200 Time (mo)
Fig. 1. Comparison of (A) overall progression-free survival (PFS), (B) overall survival (OS), and (C) cancer-specific survival (CSS) between immunotherapy (IT) and targeted therapy (TT) in intermediate-Heng-risk patients with metastatic renal cell carcinoma.
10 mRCC patients treated with TT after surgery, and the 26% of patients who relapsed after 5 postoperative years had a more favorable prognosis.
This study had some inherent limitations related to
its retrospective design, small number of intermediate-risk patients, and treatment with different therapeutic modali- ties that have different mechanisms of action. The effect of second-line agents was somewhat limited owing to the Fig. 2. Comparison of (A–F) treatment-free interval <1 year and ≥1 year and (G–L) either synchronous or metachronous metastatic type of progression- free survival between immunotherapy (IT) and targeted therapy (TT) in intermediate-Heng-risk patients with metastatic renal cell carcinoma. PFS, overall progression-free survival; OS, overall survival; CSS, cancer-specific survival.
0 30 60 90 120
1.00
0.75
0.50
probabilitySurvival 0.25
Time (mo) 0.00
IT TT
Median: 4.6 (mo) Median: 7.0 (mo) Log-rank p=0.0009 PFS
(treatment free interval <1 year)
0 40 80 120 160
1.00
0.75
0.50
probabilitySurvival 0.25
Time (mo) 0.00
IT TT
Median: 14.9 (mo) Median: 18.3 (mo) Log-rank p=0.9230 OS
(treatment free interval <1 year)
0 40 80 120 160
1.00
0.75
0.50
probabilitySurvival 0.25
Time (mo) 0.00
IT TT
Median: 19.0 (mo) Median: 18.9 (mo) Log-rank p=0.9019 CSS
(treatment free interval <1 year)
A B C
0 20 40 60
1.00
0.75
0.50
probabilitySurvival 0.25
Time (mo) 0.00
Time (mo)
0 50 100 150 200
1.00
0.75
0.50
probabilitySurvival 0.25
Time (mo) 0.00
Time (mo)
0 50 100 150 200
1.00
0.75
0.50
probabilitySurvival 0.25
Time (mo) 0.00
Time (mo)
D E F
IT TT
Median: 4.0 (mo) Median: 5.5 (mo) Log-rank p=0.1592 PFS
(treatment free interval >1 year)
IT TT
Median: 25.2 (mo) Median: 20.1 (mo) Log-rank p=0.2125 OS
(treatment free interval >1 year)
IT TT
Median: 25.2 (mo) Median: 20.1 (mo) Log-rank p=0.2929 CSS
(treatment free interval >1 year)
0 30 90 120
1.00
0.75
0.50
probabilitySurvival 0.25
Time (mo) 0.00
Time (mo) IT TT
Median: 4.5 (mo) Median: 8.0 (mo) Log-rank p=0.0022 PFS(synchronous)
0 40 80 120 160
1.00
0.75
0.50
probabilitySurvival 0.25
Time (mo) 0.00
Time (mo) IT TT
Median: 19.0 (mo) Median: 18.4 (mo) Log-rank p=0.6426 OS(synchronous)
0 40 80 120 160
1.00
0.75
0.50
probabilitySurvival 0.25
Time (mo) 0.00
Time (mo) IT TT
Median: 19.3 (mo) Median: 19.0 (mo) Log-rank p=0.7722 CSS(synchronous)
G H I
60
Time (mo) Time (mo)
IT TT
Number at risk 37 89 0
1 5 30
1 3 60
1 0 90
1 0 120 Time (mo)
IT TT
37 89 0
8 9 40
4 3 80
1 0 120
1 0 160
IT TT
37 89 0
8 9 40
4 3 80
1 0 120
1 0 160
Number at risk Number at risk
IT TT
Number at risk 27 33 0
2 4 20
0 2 40
0 1 60
IT TT
27 33 0
8 3 50
4 0 100
2 0 150
0 0 200
IT TT
27 33 0
8 3 50
4 0 100
2 0 150
0 0 200
Number at risk Number at risk
IT TT
Number at risk 42 96 0
1 5 30
1 3 60
1 0 90
1 0 120
IT TT
42 96 0
9 9 40
4 3 80
1 0 120
1 0 160
IT TT
42 96 0
9 9 40
4 3 80
1 0 120
1 0 160
Number at risk Number at risk
small number included in our study. We were therefore un- able to evaluate the efficacy of IT and TT on PFS, OS, and CSS individually. The short follow-up period was another limitation. The 16 patients who received IT and 72 patients who received TT as second-line therapy were compared in terms of survival. Overall, an insignificant difference was found for OS and CSS (p>0.05); however, there was a signifi- cant difference observed in PFS (IT, 2.8 months vs. TT, 4.8 months; p=0.0469) (Supplementary Fig. 1). In addition, meta- static lesions diagnosed pathologically might not represent the entire disease burden of mRCC, especially for metachro- nous mRCC because of differences between primary and metastatic lesions. However, the results of this study suggest the necessity of future studies to investigate multiple ad- ditional genetic, imaging, and inflammatory markers; incor- porated together, these markers could improve prognostic models for intermediate-risk patients with mRCC based on different therapeutic modalities.
CONCLUSIONS
This study reported prognostic results of IT and TT in intermediate-Heng-risk mRCC and suggested TFI and metastatic type as significant risk factors for PFS as well as potential factors for categorizing intermediate-risk patients into subgroup classifications. Additional large studies are warranted to investigate the influence of these prognostic parameters on survival.
CONFLICTS OF INTEREST
The authors have nothing to disclose.
AUTHORS’ CONTRIBUTIONS
Research conception and design: Sung Han Kim and Jin- soo Chung. Data acquisition: Sung Han Kim, Ho Kyung Seo, Kang Hyun Lee, Jae Young Joung, and Jinsoo Chung. Sta- tistical analysis: Dong-Eun Lee. Data analysis and interpre- tation: Sung Han Kim and Dong-Eun Lee. Drafting of the manuscript: Sung Han Kim and Dong-Eun Lee. Critical revi- sion of the manuscript: Jinsoo Chung and Sung Han Kim.
Obtaining funding: Jinsoo Chung. Administrative, technical, or material support: Dong-Eun Lee. Supervision: Sung Han Kim, Ho Kyung Seo, Kang Hyun Lee, Jae Young Joung, and Jinsoo Chung. Approval of the final manuscript: Sung Han Kim, Ho Kyung Seo, Kang Hyun Lee, Jae Young Joung, and Jinsoo Chung.
SUPPLEMENTARY MATERIAL
Scan this QR code to see the supplementary material, or visit https://www.icurology.org/src/sm/icurology-61-146-s001.pdf.
REFERENCES
1. Bedke J, Gauler T, Grünwald V, Hegele A, Herrmann E, Hinz S, et al. Systemic therapy in metastatic renal cell carcinoma.
World J Urol 2017;35:179-88.
2. Pal SK, Nelson RA, Vogelzang N. Disease-specific survival in de novo metastatic renal cell carcinoma in the cytokine and Fig. 2. Continued.
0 20 40 60
1.00
0.75
0.50
probabilitySurvival 0.25
Time (mo) 0.00
IT TT
Median: 3.8 (mo) Median: 4.8 (mo) Log-rank p=0.2356 PFS(metachronous)
0 50 100 150 200
1.00
0.75
0.50
probabilitySurvival 0.25
Time (mo) 0.00
IT TT
Median: 18.3 (mo) Median: 17.8 (mo) Log-rank p=0.4460 OS(metachronous)
0 50 100 150 200
1.00
0.75
0.50
probabilitySurvival 0.25
Time (mo) 0.00
IT TT
Median: 18.3 (mo) Median: 17.8 (mo) Log-rank p=0.4460 CSS(metachronous)
J K L
Time (mo) Time (mo)
IT TT
Number at risk 22 26 0
1 2 20
0 2 40
0 1 60 Time (mo)
IT TT
22 26 0
7 3 50
4 0 100
2 0 150
0 0 200
IT TT
22 26 0
7 3 50
4 0 100
2 0 150
0 0 200
Number at risk Number at risk
targeted therapy era. PLoS One 2013;8:e63341.
3. Heng DY, Xie W, Regan MM, Harshman LC, Bjarnason GA, Vaishampayan UN, et al. External validation and comparison with other models of the International Metastatic Renal-Cell Carcinoma Database Consortium prognostic model: a popula- tion-based study. Lancet Oncol 2013;14:141-8.
4. Motzer RJ, Mazumdar M, Bacik J, Berg W, Amsterdam A, Ferr- ara J. Survival and prognostic stratification of 670 patients with advanced renal cell carcinoma. J Clin Oncol 1999;17:2530-40.
5. Ko JJ, Xie W, Kroeger N, Lee JL, Rini BI, Knox JJ, et al. The International Metastatic Renal Cell Carcinoma Database Con- sortium model as a prognostic tool in patients with metastatic renal cell carcinoma previously treated with first-line targeted therapy: a population-based study. Lancet Oncol 2015;16:293- 300.
6. Kim SH, Park WS, Kim SH, Joung JY, Seo HK, Lee KH, et al.
Systemic treatments for metastatic renal cell carcinoma: 10- year experience of immunotherapy and targeted therapy. Can- cer Res Treat 2016;48:1092-101.
7. Sella A, Michaelson MD, Matczak E, Simantov R, Lin X, Figlin RA. Heterogeneity of patients with intermediate-prognosis metastatic renal cell carcinoma treated with sunitinib. Clin Genitourin Cancer 2017;15:291-9.e1.
8. Tanaka N, Mizuno R, Shirotake S, Ito K, Yasumizu Y, Masu- naga A, et al. Effect of reclassification of the IMDC model in patients with metastatic renal cell carcinoma treated with targeted therapy in the first-line and second-line settings. Urol Oncol 2016;34:293.e17-25.
9. Kwon WA, Cho IC, Yu A, Nam BH, Joung JY, Seo HK, et al.
Validation of the MSKCC and Heng risk criteria models for predicting survival in patients with metastatic renal cell carci- noma treated with sunitinib. Ann Surg Oncol 2013;20:4397- 404.
10. Beksac AT, Paulucci DJ, Blum KA, Yadav SS, Sfakianos JP, Badani KK. Heterogeneity in renal cell carcinoma. Urol Oncol 2017;35:507-15.
11. Kim SH, Park WS, Park EY, Park B, Joo J, Joung JY, et al. The correlation of tissue-based biomarkers in primary and meta- static renal cell carcinoma lesions: a tissue microarray study.
Korean J Urol Oncol 2016;14:152-8.
12. Heng DY, Xie W, Regan MM, Warren MA, Golshayan AR, Sahi C, et al. Prognostic factors for overall survival in patients with metastatic renal cell carcinoma treated with vascular endothe- lial growth factor-targeted agents: results from a large, multi- center study. J Clin Oncol 2009;27:5794-9.
13. Moch H, Artibani W, Delahunt B, Ficarra V, Knuechel R, Mon- torsi F, et al. Reassessing the current UICC/AJCC TNM staging for renal cell carcinoma. Eur Urol 2009;56:636-43.
14. Moch H. [The WHO/ISUP grading system for renal carci-
noma]. Pathologe 2016;37:355-60. German.
15. Eisenhauer EA, Therasse P, Bogaerts J, Schwartz LH, Sargent D, Ford R, et al. New response evaluation criteria in solid tu- mours: revised RECIST guideline (version 1.1). Eur J Cancer 2009;45:228-47.
16. National Comprehensive Cancer Network. NCCN clinical practice guidelines in oncology (NCCN guidelines). Kidney cancer. Version 1. 2020. Rockledge: National Comprehensive Cancer Network; 2019 Jun 7 [cited 2019 Aug 5]. Available from: https://www.nccn.org/professionals/physician_gls/PDF/
kidney.pdf.
17. Ljungberg B, Albiges L, Bensalah K, Bex A, Giles RH, Hora M, et al. EAU guideline. Oncology guideline. Renal cell carcino- ma: 7. disease management, 7.4 systemic therapy for advanced/
metastatic renal cell cancer. Arnhem: European Association of Urology; 2019 [cited 2019 Sep 4]. Available from: https://
uroweb.org/guideline/renal-cell-carcinoma.
18. Oosting SF, Brouwers AH, van Es SC, Nagengast WB, Oude Munnink TH, Lub-de Hooge MN, et al. 89Zr-bevacizumab PET visualizes heterogeneous tracer accumulation in tumor le- sions of renal cell carcinoma patients and differential effects of antiangiogenic treatment. J Nucl Med 2015;56:63-9.
19. Kim SH, Kwon WA, Kim S, Joung JY, Seo HK, Lee KH, et al. The neutrophil-to-lymphocyte ratio makes the Heng risk model improve better the prediction of overall survival in met- astatic renal cell cancer patients. Jpn J Clin Oncol 2018;48:835- 40.
20. Ferté C, Koscielny S, Albiges L, Rocher L, Soria JC, Iacovelli R, et al. Tumor growth rate provides useful information to evalu- ate sorafenib and everolimus treatment in metastatic renal cell carcinoma patients: an integrated analysis of the TARGET and RECORD phase 3 trial data. Eur Urol 2014;65:713-20.
21. Kroeger N, Choueiri TK, Lee JL, Bjarnason GA, Knox JJ, MacKenzie MJ, et al. Survival outcome and treatment response of patients with late relapse from renal cell carcinoma in the era of targeted therapy. Eur Urol 2014;65:1086-92.
22. González Del Alba A, Arranz JÁ, Puente J, Méndez-Vidal MJ, Gallardo E, Grande E, et al. Recent advances in genitourinary tumors: a review focused on biology and systemic treatment.
Crit Rev Oncol Hematol 2017;113:171-90.
23. Kim SH, Suh YS, Lee DE, Park B, Joo J, Joung JY, et al. A retrospective comparative study of progression-free survival and overall survival between metachronous and synchronous metastatic renal cell carcinoma in intermediate- or poor- risk patients treated with VEGF-targeted therapy. Oncotarget 2017;8:93633-43.
24. Gill DM, Agarwal N, Vaishampayan U. Evolving treatment paradigm in metastatic renal cell carcinoma. Am Soc Clin On- col Educ Book 2017;37:319-29.
25. Begley J, Ribas A. Targeted therapies to improve tumor immu- notherapy. Clin Cancer Res 2008;14:4385-91.
26. McDermott DF, Atkins MB. Immune therapy for kidney can- cer: a second dawn? Semin Oncol 2013;40:492-8.
27. Raman R, Vaena D. Immunotherapy in metastatic renal cell carcinoma: a comprehensive review. Biomed Res Int 2015;2015:367354.
28. Kuusk T, Albiges L, Escudier B, Grivas N, Haanen J, Powles T, et al. Antiangiogenic therapy combined with immune check- point blockade in renal cancer. Angiogenesis 2017;20:205-15.
29. Noe A, de Bruijn RE, Blank C, Horenblas S, Haanen J, Bex A.
Comparison of pre-treatment MSKCC and IMDC prognostic
risk models in patients with synchronous metastatic renal cell carcinoma treated in the era of targeted therapy. World J Urol 2016;34:1067-72.
30. Kim SH, Jeong KC, Joung JY, Seo HK, Lee KH, Chung J. Prog- nostic significance of nephrectomy in metastatic renal cell carcinoma treated with systemic cytokine or targeted therapy:
a 16-year retrospective analysis. Sci Rep 2018;8:2974.
31. Bozkurt O, Hacibekiroglu I, Kaplan MA, Duzkopru Y, Uysal M, Karaca H, et al. Is late recurrence a predictive clinical marker for better sunitinib response in metastatic renal cell carcinoma patients? Clin Genitourin Cancer 2015;13:548-54.