INTRODUCTION
Epithelial ovarian cancer (EOC) is the second most common gy- necologic malignancy in developed countries, and accounts for more deaths than the remaining gynecologic cancers added
together [1]. EOC can spread by intraperitoneal seeding, direct invasion, or through lymphatic or vascular circulation, and the peritoneal seeding is the most common route of dissemination [2].
In most women with EOC, the disease is not diagnosed until it is at an advanced stage. Primary cytoreductive surgery fol- lowed by taxane/platinum-based adjuvant chemotherapy is considered the standard approach to these patients [3]. Some observers have noted that the maximal cytoreduction, corre- lated to the minimal residual tumor mass after surgery, is one of the most powerful prognostic factors [4-6].
Imaging of the peritoneum has been routinely performed
Preoperative [ 18 F]FDG PET/CT predicts recurrence in patients with epithelial ovarian cancer
Hyun Hoon Chung1,2, Hyun Woo Kwon2,3, Keon Wook Kang2,3, Jae Weon Kim1,2, Noh-Hyun Park1, Yong-Sang
Song1,2,4, Soon-Beom Kang1
1Department of Obstetrics and Gynecology, 2Cancer Research Institute, and 3Department of Nuclear Medicine, Seoul National University College of Medicine, Seoul; 4Major in Biomodulation, WCU and Department of Agricultural Biotechnology, Seoul National University, Seoul, Korea
Received Aug 11, 2011, Revised Oct 11, 2011, Accepted Oct 16, 2011 Correspondence to Soon-Beom Kang
Department of Obstetrics and Gynecology, Seoul National University College of Medicine, 101 Daehak-ro, Jongno-gu, Seoul 110-744, Korea. Tel:
82-2-2072-3384, Fax: 82-2-762-3599, E-mail: [email protected]
Objective: To determine whether [18F]FDG uptake on PET/CT imaging before surgical staging has prognostic significance in patients with epithelial ovarian cancer (EOC).
Methods: Patients with EOC were imaged with integrated PET/CT before surgical staging. Hypermetabolic lesions were measured as the standardized uptake value (SUV) in primary and metastatic tumors. SUV distribution was divided into two regions at the level of umbilicus, and the impact of the ratio between above and below umbilicus (SUVlocation ratio) on progression-free survival (PFS) was examined using Cox proportional hazards regression.
Results: Between January 2004 and December 2009, 55 patients with EOC underwent preoperative PET/CT. The median duration of PFS was 11 months (range, 3 to 43 months), and twenty (36.4%) patients experienced recurrence. In univariate analysis, high SUVlocation ratio (p=0.002; hazard ratio [HR], 1.974; 95% confidence interval [CI], 1.286 to 3.031) was significantly associated with recurrence. Malignant mixed mullerian tumor compared with endometrioid histology was also shown to have significance. In multivariate analysis, high SUVlocation ratio (p=0.005; HR, 2.418; 95% CI, 1.1315 to 4.447) and histology (serous, mucinous, and malignant mixed mullerian tumor compared with endometrioid type) were significantly associated with recurrence. Patients were categorized into two groups according to SUVlocation ratio (<0.3934 vs. ≥0.3934), and the Kaplan-Meier survival graph showed a significant difference in PFS between the groups (p=0.0021; HR, 9.47, log-rank test).
Conclusion: SUV distribution showed a significant association with recurrence in patients with EOC, and may be a useful predictor of recurrence.
Keywords: Distribution, Epithelial ovarian cancer, Recurrence, Standardized uptake value
by means of contrast-enhanced CT, however, the sensitivity of this technique depends on the size and location of peritoneal implants. Moreover, anatomical imaging uses only size criteria and does not recognize the functional alterations that occur within tumor tissue. PET/CT using [18F]FDG has been success- fully employed to visualize enhanced glucose utilization in tumor tissues. PET/CT has been shown to identify primary tumors, regional lymph nodes, and distant metastases with high diagnostic accuracy for primary and recurrent EOC [7- 10]. These hybrid systems perform both PET and CT and co- register images with an improvement of anatomic localization of intra- and extra-pelvic structures [11], as well as allowing the detection of distant supra-diaphragmatic metastases [12].
Several studies have shown that PET or PET/CT were useful for monitoring treatment response [13,14], detecting residual dis- ease after completion of therapy [15,16], and detecting recur- rent or metastatic lesions in EOC [8,17].
However, only limited information is currently available des- cri bing the role of PET/CT for the prediction of recurrence in EOC. This study evaluated the hypothesis that the pretreat- ment metabolic activities measured by FDG uptake and its distribution will allow prediction of prognosis. The aim of this study was to evaluate the prognostic value of the distribution of FDG up take on preoperative PET/CT scans in patients with EOC.
MATERIALS AND METHODS 1. Patient population
This study was approved by our institutional review board.
We retrospectively reviewed the tumor registry at our institu- tion and identified all patients diagnosed with EOC between January 2004 and December 2009. All clinical, histological and imaging data of patients at our institution were collected and stored in a computerized database. Patients were required to have undergone an PET/CT study just before establishing a pathologic diagnosis, to have received no treatment before the study, and to have had at least 3 months of follow-up.
Patients were excluded in the analysis if any of the following criteria were present: 1) a previous diagnosis of another malig- nant disease or borderline tumor, 2) short follow-up duration less than 3 months, 3) primary treatment other than surgery such as neoadjuvant chemotherapy, 4) known allergy to con- trast media, diabetes or other severe medical conditions. Tu- mor histologic cell type, grade, stage at surgical staging, site of metastasis, and treatment were recorded from the patient’
s medical record. A stage after surgical staging was assigned according to the International Federation of Gynecology and
Obstetrics (FIGO).
2. PET/CT imaging
The patients were imaged using a dedicated PET/CT sys- tem (Gemini, Philips Medical Systems, Andover, MA, USA). All patients were instructed to fast at least 4 hours prior to un- dergoing PET/CT; 125 mL of a barium sulfate solution (Readi- cat [1.3% weight-volume barium sulfate suspension]; E-Z- EM, Westbury, NY, USA or EZCT [1.5% weight-volume barium sulfate suspension], Taejoon Pharm, Seoul, Korea) was admin- istered orally 1 hour prior to imaging to opacify the bowel for the CT portion of the study, following methods described in our previous study [18]. PET/CT scans were obtained between 1 day and 23 days (median, 5 days) before surgery.
3. Image analysis
All images were interpreted and analyzed by two experien- ced nuclear medicine physicians (HWK, KWK) with all available clinical information. The images were reviewed on an inter ac- ti ve video display provided by the equipment manufacturer standardized uptake value (SUV)max was quantitatively used to determine FDG activity. Calculation of SUVmax was as follows:
SUVmax=Cmax×TBW/IA (Cmax, activity concentration in the voxel of highest metabolic activity [Bq/mL]; TBW, total body weight (kg); IA, injected activity [kBq]).
SUV distribution was divided into two regions at the level of the umbilicus, and the impact of the ratio between above and below the umbilicus (SUVlocation ratio=sum of SUV above umbilicus/sum of SUV below umbilicus) on recurrence was examined.
4. Treatment and follow-up
After the PET/CT scan and a definitive surgical staging, 50 patients were treated with chemotherapy. Survival data were obtained from the tumor registry and verified on review of the medical records.
5. Histological and clinical evaluation
Recurrent disease was confirmed in all cases by either tissue biopsy or the demonstration of progressive disease by serial imaging studies such as CT, MRI, or PET/CT. Clinical proof of no recurrent disease consisted of a negative tissue biopsy and negative finings on serial follow-up imaging studies.
To confirm lesions detected on PET/CT imaging, CT- or ultra- sound-guided biopsy was performed to obtain tissues for his- tological evaluation in cases where it was considered neces- sary for patient management. Progressive elevation of serum tumor marker (CA-125) accompanied by an increase in lesion size or the appearance of new lesions was considered disease recurrence.
6. Data analysis
With respect to SUVlocation ratio, receiver operating character- istic (ROC) curve analysis was performed in order to determine the cutoff values for predicting recurrence. Progression-free survival (PFS) was calculated as the interval from the date of treatment completion to the first documented date of pro- gression, or death whichever occurred first. Survival curves were constructed using the method of Kaplan and Meier. The Cox proportional hazards modeling used to identify indepen- dent variables associated with recurrence. Results from the Cox models are expressed as hazard ratios (HRs) with 95%
confidence intervals (CIs), and p<0.05 was considered the level of significance. The SPSS ver. 11.0 (SPSS Inc., Chicago, IL, USA) was used for the statistical analysis.
RESULTS
1. Characteristics of the patients
Of the 337 patients diagnosed as EOC, 299 patients under- went primary debulking surgery during the study period.
There were 76 patients with a median age of 54 years (range, 35 to 80 years) who met the inclusion criteria. A total of 55 pa- tients underwent preoperative PET/CT scanning.
2. PET/CT and survival
Median follow-up time was 16 months (range, 3 to 50 months), and the median PFS duration was 11 months (range, 3 to 43 months). Twenty (36.4%) patients experienced recurrence, and one patient died of disease. The 3-year PFS rate was 50.8%.
3. Cutoff value of SUVlocation ratio
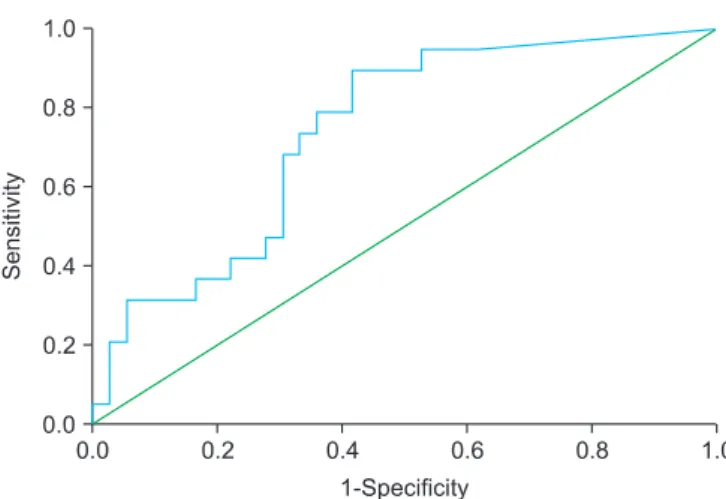
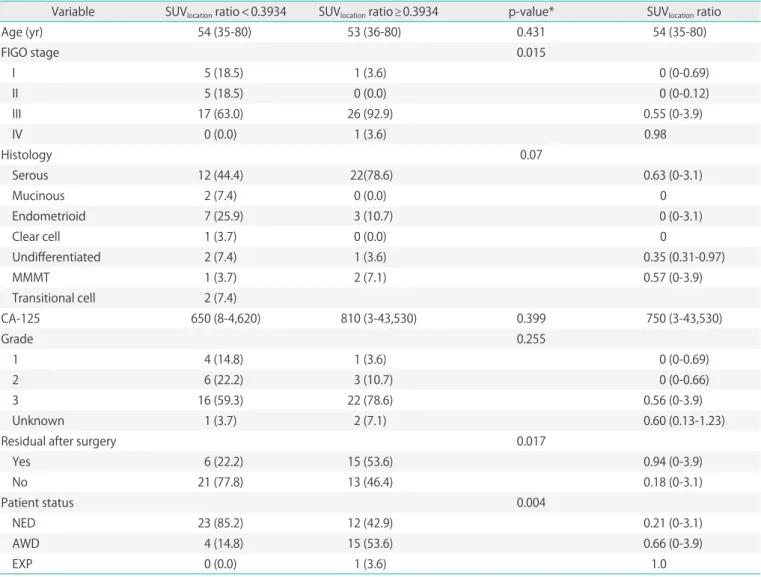
Fig. 1 shows the ROC curve analyzing the SUVlocation ratio in PFS. Area under the curve (AUC) was 0.740 (p=0.004; 95% CI, 0.607 to 0.873), and the value of 0.3934 was determined as the cutoff of SUVlocation ratio in this study, and patients were categorized into two groups according to the SUVlocation ratio (<0.3934 vs. ≥0.3934). Table 1 lists the descriptive statistics among demographic subgroups categorized by the cutoff SUVlocation ratio. Patient distribution was significantly differ- ent according to FIGO stage (p=0.015), residual disease after surgery (p=0.017), and patients status (p=0.004) between the two groups categorized by the SUVlocation ratio. Table 2 lists the median PFS among groups categorized by the cutoff SUVlocation
ratio.
4. SUVlocation ratio and recurrence
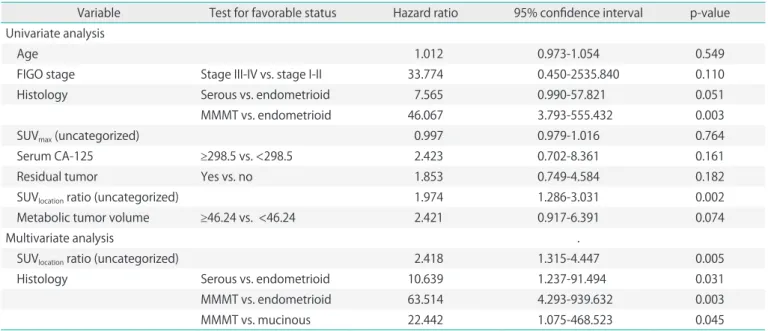
Table 3 shows the results of the Cox proportional hazard analyses. In univariate analysis, high SUVlocation ratio (p=0.002;
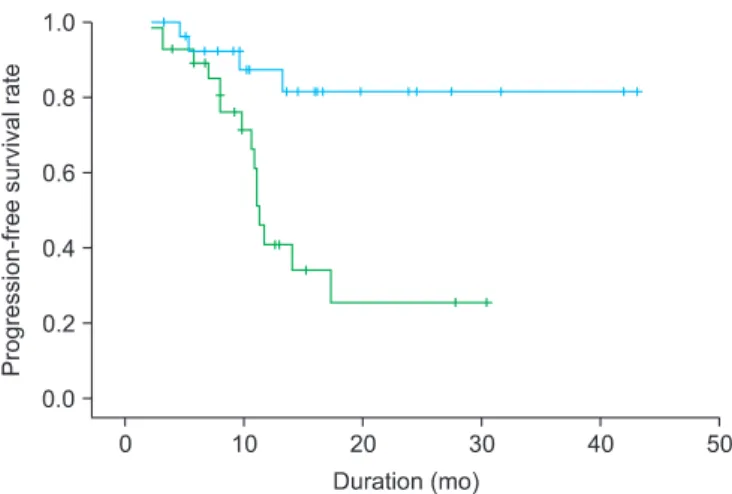
HR, 1.974; 95% CI, 1.286 to 3.031) was significantly associated with recurrence. Malignant mixed mullerian tumors (MMMT) compared with endometrioid histology was also shown to have significance. In multivariate analysis, high SUVdistribution ra- tio (p=0.005; HR, 2.418; 95% CI, 1.1315 to 4.447), and histology (serous, p=0.031; mucinous, p=0.045; MMMT, p=0.003; com- pared with endometrioid type) were significantly associated with recurrence. The Kaplan-Meier survival graph showed a significant difference in PFS between the groups categorized by SUVlocation ratio (Fig. 2). Survival difference between the two groups was statistically significant (p=0.0021, log-rank test).
DISCUSSION
The purpose of the current study was to determine whether the preoperative metabolic tumor burden and its distribution as measured by the SUV have prognostic significance in pa- tients with EOC. To the best of our knowledge, this is the first study reporting the prognostic value of preoperative PET/CT on predicting the risk of recurrence in patients with EOC.
The principle finding was that the metabolic tumor burden in the upper abdomen measured as SUVlocation ratio on preop- erative PET/CT was the most powerful significant prognostic factor for predicting recurrence in EOC. It is noteworthy that FIGO stage was not a significant prognostic factor for recur- rence in this study. This may be due to the small number of patients enrolled, and the distribution of stage (most patients were stage III). We found that another tumor-related factor such as tumor histology was also a predictor of recurrence.
Fig. 1. ROC curve analysis for de ter mi na tion of the cutoff value of the ratio of metabolic standardized uptake value (SUV) location (SUVlocation) ratio according to anatomic location for pre dic ting recurrence. The area under the ROC curve for discrimi na ting re cu rrence of [18F]FDG PET/CT using the cutoff value of 0.3934 was 0.74 (p=0.004; 95%
confidence interval, 0.607 to 0.873).
The results of the current study demonstrate the potential value of preoperative PET/CT in patients with preoperative
SUVlocation ratio. We aim to perform more frequent and inten-
sive follow-up or prophylactic administration of consolidation treatment in these patients, and may individualize patient care according to the preoperative SUVlocation ratio.
In previous studies, the presence of residual tumor after pri- mary surgery has been shown to be an independent prognos- tic factor [19-23]. A Gynecologic Oncology Group (GOG) study demonstrated that patients with stage III disease presenting with large-volume ovarian cancer before undergoing optimal cytoreduction had a worse prognosis than patients found to have small-volume disease at the time of exploration [24].
The Scottish Randomized Trial in Ovarian Cancer (SCOTROC) showed that a clinically significant PFS benefit with optimal surgery among patients with stage IC to IV disease was limited to patients with less advanced disease [25].
Adding values of lesional SUVs may imply the importance of tumor burden, and it may depend on the number of meta- static lesions without information of tumor volume. In this respect, we calculated the metabolic tumor volume (MTV) and performed analysis using the sum of MTVs. However, preoperative MTV was not an independent prognostic factor of recurrence in the current study (data not shown). Here, we hypothesized that the locus of the metastatic tumor burden would have prognostic importance.
Table 1. Patient characteristics for epithelial ovarian cancer: comparison of groups categorized by the ratio of the location of hypermetabolism Variable SUVlocation ratio<0.3934 SUVlocation ratio≥0.3934 p-value* SUVlocation ratio
Age (yr) 54 (35-80) 53 (36-80) 0.431 54 (35-80)
FIGO stage 0.015
I 5 (18.5) 1 (3.6) 0 (0-0.69)
II 5 (18.5) 0 (0.0) 0 (0-0.12)
III 17 (63.0) 26 (92.9) 0.55 (0-3.9)
IV 0 (0.0) 1 (3.6) 0.98
Histology 0.07
Serous 12 (44.4) 22(78.6) 0.63 (0-3.1)
Mucinous 2 (7.4) 0 (0.0) 0
Endometrioid 7 (25.9) 3 (10.7) 0 (0-3.1)
Clear cell 1 (3.7) 0 (0.0) 0
Undifferentiated 2 (7.4) 1 (3.6) 0.35 (0.31-0.97)
MMMT 1 (3.7) 2 (7.1) 0.57 (0-3.9)
Transitional cell 2 (7.4)
CA-125 650 (8-4,620) 810 (3-43,530) 0.399 750 (3-43,530)
Grade 0.255
1 4 (14.8) 1 (3.6) 0 (0-0.69)
2 6 (22.2) 3 (10.7) 0 (0-0.66)
3 16 (59.3) 22 (78.6) 0.56 (0-3.9)
Unknown 1 (3.7) 2 (7.1) 0.60 (0.13-1.23)
Residual after surgery 0.017
Yes 6 (22.2) 15 (53.6) 0.94 (0-3.9)
No 21 (77.8) 13 (46.4) 0.18 (0-3.1)
Patient status 0.004
NED 23 (85.2) 12 (42.9) 0.21 (0-3.1)
AWD 4 (14.8) 15 (53.6) 0.66 (0-3.9)
EXP 0 (0.0) 1 (3.6) 1.0
Values are presented as mean (range) or number (%). All p-values result from a χ2 test except for the variable of age and CA-125, in which a t-test was performed.
SUVmax, maximum standardized uptake value; FIGO, International Federation of Obstetrics and Gynecology; MMMT, malignant mixed müllerian tumor; NED, no evidence of disease; AWD, alive with disease; EXP, expired.
Table 2. Median progression-free survival among groups categorized by the ratio of the location of hypermetabolism Variable
SUVlocation ratio<0.3934 SUVlocation ratio≥0.3934 Overall
No. No. recur Median PFS
(mo) No. No. recur Median PFS
(mo) No. No. recur Median PFS
(mo) FIGO stage
I 5 0 16.2 1 0 30.4 6 0 18.0
II 5 0 10.4 0 0 5 0 10.4
III 17 4 10.5 26 15 9.8 43 19 10.2
IV 0 0 1 1 11.1 1 1 11.1
Histology
Serous 12 3 10.3 22 13 10.7 34 16 10.5
Mucinous 2 1 9.9 0 0 2 1 9.9
Endometrioid 7 0 16.2 3 1 15.2 10 1 10.5
Clear cell 1 0 19.8 0 0 1 0 19.8
Undifferentiated 2 0 22.6 1 0 4.0 3 0 9.5
MMMT 1 0 3.3 2 2 6.0 3 2 3.3
Transitional cell 2 0 29.0 0 0 2 0 29.0
Grade
1 4 1 15.4 1 0 30.4 5 1 16.2
2 6 0 14.8 3 2 11.1 9 2 13.6
3 16 3 11.8 22 13 9.8 38 16 10.3
Unknown 1 0 10.5 2 1 17.4 3 1 10.5
Residual after surgery
Yes 6 2 8.7 15 8 10.8 21 10 9.8
No 21 2 14.5 13 8 9.8 34 10 12.4
SUVmax, maximum standardized uptake value; PFS, progression-free survival; FIGO, International Federation of Obstetrics and Gynecology; MMMT, malignant mixed müllerian tumor.
Table 3. Results of analyses of prognostic factors for progression-free survival
Variable Test for favorable status Hazard ratio 95% confidence interval p-value
Univariate analysis
Age 1.012 0.973-1.054 0.549
FIGO stage Stage III-IV vs. stage I-II 33.774 0.450-2535.840 0.110
Histology Serous vs. endometrioid 7.565 0.990-57.821 0.051
MMMT vs. endometrioid 46.067 3.793-555.432 0.003
SUVmax (uncategorized) 0.997 0.979-1.016 0.764
Serum CA-125 ≥298.5 vs. <298.5 2.423 0.702-8.361 0.161
Residual tumor Yes vs. no 1.853 0.749-4.584 0.182
SUVlocation ratio (uncategorized) 1.974 1.286-3.031 0.002
Metabolic tumor volume ≥46.24 vs. <46.24 2.421 0.917-6.391 0.074
Multivariate analysis .
SUVlocation ratio (uncategorized) 2.418 1.315-4.447 0.005
Histology Serous vs. endometrioid 10.639 1.237-91.494 0.031
MMMT vs. endometrioid 63.514 4.293-939.632 0.003
MMMT vs. mucinous 22.442 1.075-468.523 0.045
FIGO, International Federation of Obstetrics and Gynecology; SUVmax, maximum standardized uptake value; MMMT, malignant mixed müllerian tumor.
One of the main pitfalls of PET imaging is the non-invasive visualization of diffuse peritoneal carcinomatosis, with the tu- mor spread through small implants on the peritoneal surface:
the problem emanates from the reduced spatial resolution of PET imaging (5-6 mm) that makes it unable to visualize min- ute tumor implants, as in miliary carcinomatosis.
We recognize several limitations of this study. Most nota- bly is that it was a retrospective study performed at a single institution with a relatively small number of patients (n=55).
There may have been selection bias. Not all patients with EOC underwent preoperative PET/CT during the study period. The physician’s attitude to PET/CT may have influenced the refer- ral of patients in the retrospective study design. Hence, our findings may not be generalizable to all EOC patients, as only selected patients may have been referred to PET/CT scanning, and image acquisition and interpretation procedures will be different according to institutions. Additional standardized large prospective studies may be necessary to confirm the prognostic value of preoperative PET/CT in clinical practice.
Secondly, we could not analyze the overall survival because there was only one case of disease-related death among the study population, and the study period was relatively short since PET/CT has only recently been introduced at our insti- tution. We are preparing a prospective study to confirm the currently reported results, and eventually to determine if pre- treatment PET/CT has predictive prognosis value.
Although this study has some limitations, it also demon- strates unique and significant findings, because to the best of our knowledge no study published to date has demonstrated the prognostic significance of metabolic burden in patients
with EOC. The findings of the current study have important implications for the management of patients with EOC; pa- tients with high SUVlocation ratio in preoperative PET/CT scan should be closely monitored after treatment, or consolidation treatment after previously-planned therapy may be seriously considered. In addition, targeting molecular therapeutics us- ing tumor metabolism might be proposed and be a candidate theme of future research in the treatment of EOC.
In conclusion, preoperative SUVlocation ratio was a significant prognostic indicator for recurrence in patients with EOC, and may allow individualization of patient care. Further analysis with a larger patient population and longer follow-up is war- ranted for confirmation of the findings of this study.
CONFLICT OF INTEREST
No potential conflict of interest relevant to this article was reported.
REFERENCES
1. Jemal A, Siegel R, Ward E, Hao Y, Xu J, Thun MJ. Cancer sta- tistics, 2009. CA Cancer J Clin 2009;59:225-49.
2. Heintz AP, Odicino F, Maisonneuve P, Quinn MA, Benedet JL, Creasman WT, et al. Carcinoma of the ovary: FIGO 26th Annual Report on the Results of Treatment in Gyne colo gi- cal Cancer. Int J Gynaecol Obstet 2006;95(Suppl 1):S161-92.
3. Park TW, Kuhn WC. Neoadjuvant chemotherapy in ovarian cancer. Expert Rev Anticancer Ther 2004;4:639-47.
4. Bristow RE, Tomacruz RS, Armstrong DK, Trimble EL, Montz FJ. Survival effect of maximal cytoreductive surgery for ad vanced ovarian carcinoma during the platinum era: a meta-analysis. J Clin Oncol 2002;20:1248-59.
5. Naik R, Nordin A, Cross PA, Hemming D, de Barros Lopes A, Monaghan JM. Optimal cytoreductive surgery is an independent prognostic indicator in stage IV epithelial ovarian cancer with hepatic metastases. Gynecol Oncol 2000;78:171-5.
6. Heintz AP, Hacker NF, Berek JS, Rose TP, Munoz AK, Lagasse LD. Cytoreductive surgery in ovarian carcinoma: feasibility and morbidity. Obstet Gynecol 1986;67:783-8.
7. Prakash P, Cronin CG, Blake MA. Role of PET/CT in ovarian cancer. AJR Am J Roentgenol 2010;194:W464-70.
8. Chung HH, Kang WJ, Kim JW, Park NH, Song YS, Chung JK, et al. Role of [18F]FDG PET/CT in the assessment of sus- pec ted recurrent ovarian cancer: correlation with clinical or histological findings. Eur J Nucl Med Mol Imaging 2007;
Fig. 2. Progression-free survival (PFS) among patients with epithelial ovarian cancer stratified by the ratio of metabolic standardized uptake value (SUV) location (SUVlocation) ratio. Blue line SUVlocation<0.3934, green line SUVlocation≥0.3934. There was statistically significant difference in PFS for patients with SUVlocation less than 0.3934 and SUVlocation≥0.3934 (p=0.0021, log-rank test).
34:480-6.
9. Kitajima K, Murakami K, Yamasaki E, Kaji Y, Fukasawa I, Inaba N, et al. Diagnostic accuracy of integrated FDG-PET/con- trast-enhanced CT in staging ovarian cancer: com pa ri son with enhanced CT. Eur J Nucl Med Mol Imaging 2008;35:
1912-20.
10. Dirisamer A, Schima W, Heinisch M, Weber M, Lehner HP, Haller J, et al. Detection of histologically proven peritoneal carcinomatosis with fused 18F-FDG-PET/MDCT. Eur J Radiol 2009;69:536-41.
11. Townsend DW, Beyer T. A combined PET/CT scanner: the path to true image fusion. Br J Radiol 2002;75(Spec No):
S24-30.
12. Cormio G, Rossi C, Cazzolla A, Resta L, Loverro G, Greco P, et al. Distant metastases in ovarian carcinoma. Int J Gynecol Cancer 2003;13:125-9.
13. Avril N, Sassen S, Schmalfeldt B, Naehrig J, Rutke S, Weber WA, et al. Prediction of response to neoadjuvant chemo- therapy by sequential F-18-fluorodeoxyglucose positron emission tomography in patients with advanced-stage ovarian cancer. J Clin Oncol 2005;23:7445-53.
14. Nishiyama Y, Yamamoto Y, Kanenishi K, Ohno M, Hata T, Kushida Y, et al. Monitoring the neoadjuvant therapy res- ponse in gynecological cancer patients using FDG PET. Eur J Nucl Med Mol Imaging 2008;35:287-95.
15. Sironi S, Messa C, Mangili G, Zangheri B, Aletti G, Garavaglia E, et al. Integrated FDG PET/CT in patients with persistent ovarian cancer: correlation with histologic findings. Radi- ology 2004;233:433-40.
16. Kim S, Chung JK, Kang SB, Kim MH, Jeong JM, Lee DS, et al. [18F]FDG PET as a substitute for second-look laparotomy in patients with advanced ovarian carcinoma. Eur J Nucl Med Mol Imaging 2004;31:196-201.
17. Soussan M, Wartski M, Cherel P, Fourme E, Goupil A, Le Stanc E, et al. Impact of FDG PET-CT imaging on the decision making in the biologic suspicion of ovarian carcinoma
recurrence. Gynecol Oncol 2008;108:160-5.
18. Chung HH, Kang WJ, Kim JW, Park NH, Song YS, Chung JK, et al. The clinical impact of [(18)F]FDG PET/CT for the management of recurrent endometrial cancer: correlation with clinical and histological findings. Eur J Nucl Med Mol Imaging 2008;35:1081-8.
19. Griffiths CT. Surgical resection of tumor bulk in the primary treatment of ovarian carcinoma. Natl Cancer Inst Monogr 1975;42:101-4.
20. Eisenkop SM, Spirtos NM, Lin WC. “Optimal” cytoreduction for advanced epithelial ovarian cancer: a commentary.
Gynecol Oncol 2006;103:329-35.
21. Chi DS, Eisenhauer EL, Lang J, Huh J, Haddad L, Abu-Rustum NR, et al. What is the optimal goal of primary cytoreduc ti ve surgery for bulky stage IIIC epithelial ovarian carcinoma (EOC)? Gynecol Oncol 2006;103:559-64.
22. Wimberger P, Lehmann N, Kimmig R, Burges A, Meier W, Du Bois A, et al. Prognostic factors for complete debulking in advanced ovarian cancer and its impact on survival: an exploratory analysis of a prospectively randomized phase III study of the Arbeitsgemeinschaft Gynaekologische On kologie Ovarian Cancer Study Group (AGO-OVAR).
Gynecol Oncol 2007;106:69-74.
23. Aletti GD, Dowdy SC, Podratz KC, Cliby WA. Analysis of fac tors impacting operability in stage IV ovarian can cer:
ra tionale use of a triage system. Gynecol Oncol 2007;105:
84-9.
24. Hoskins WJ, Bundy BN, Thigpen JT, Omura GA. The influ ence of cytoreductive surgery on recurrence-free interval and survival in small-volume stage III epithelial ovarian cancer:
a Gynecologic Oncology Group study. Gynecol Oncol 1992;
47:159-66.
25. Crawford SC, Vasey PA, Paul J, Hay A, Davis JA, Kaye SB. Does aggressive surgery only benefit patients with less ad vanced ovarian cancer? Results from an international comparison within the SCOTROC-1 Trial. J Clin Oncol 2005;23:8802-11.