Background and Purpose The purpose of this study was to characterize abnormal cortical activity during sleep in restless legs syndrome (RLS) patients and to determine the effects of treatment with a dopamine agonist. Based on whole-brain electroencephalograms, we attempt- ed to verify alterations in the functional network as well as the spectral power of neural activi- ties during sleep in RLS patients and to determine whether the changes are reversed by treat- ment with pramipexole.
Methods Twelve drug-naïve RLS patients participated in the study. Overnight polysomnogra- phy was performed before and after treatment: the first recording was made immediately prior to administering the first dose of pramipexole, and the second recording was made 12–16 weeks after commencing pramipexole administration. Sixteen age-matched healthy participants served as a control group. The spectral power and interregional phase synchrony were analyzed in 30-s epochs. The functional characteristics of the cortical network were quantified using graph-theory measures.
Results The delta-band power was significantly increased and the small-world network char- acteristics in the delta band were disrupted in RLS patients compared to the healthy controls.
These abnormalities were successfully treated by dopaminergic medication. The delta-band power was significantly correlated with the RLS severity score in the RLS patients prior to treatment.
Conclusions Our findings suggest that the spectral and functional network characteristics of neural activities during sleep become abnormal in RLS patients, and these abnormalities can be successfully treated by a dopamine agonist.
Key Words restless legs syndrome, polysomnography, delta rhythm, spectral power, functional network, dopamine agonist treatment.
Abnormal Sleep Delta Rhythm and Interregional Phase Synchrony in Patients with Restless Legs Syndrome and Their Reversal by Dopamine Agonist Treatment
INTRODUCTION
Restless legs syndrome (RLS) is a neurological disorder characterized by an urge to move the legs, and is typically accompanied by unpleasant sensations in the legs.1 Its symptoms are worse in the evening or at night, which leads to sleep disturbances such as sleep depri- vation, insomnia, and sleep fragmentation.2
Neuroimaging and neurophysiological studies have demonstrated that extensive anatom- ical and functional abnormalities of the central nervous system are associated with RLS; for example, the gray-matter volume is increased in the thalamus3 while it is decreased in the motor and somatosensory pathways.4 Several neurophysiological studies have consistently demonstrated impairments of the central inhibition pathways in RLS patients.5,6 Beta-band event-related synchronization is increased in the electroencephalograms (EEGs) of RLS pa- Jeong Woo Choia*
Min Hee Jeonga* Seong Jin Hera Byeong Uk Leeb Kwang Su Chaa Ki-Young Jungb Kyung Hwan Kima
a Department of Biomedical Engineering, College of Health Science,
Yonsei University, Wonju, Korea
b Department of Neurology, Seoul National University College of Medicine, Seoul, Korea
pISSN 1738-6586 / eISSN 2005-5013 / J Clin Neurol 2017;13(4):340-350 / https://doi.org/10.3988/jcn.2017.13.4.340
Received March 20, 2017 Revised May 13, 2017 Accepted May 15, 2017 Correspondence Kyung Hwan Kim, PhD
Department of Biomedical Engineering, College of Health Science,
Yonsei University, 1 Yeonsedae-gil, Heungeop-myeon, Wonju 26493, Korea Tel +82-33-760-2364
Fax +82-33-760-2197
E-mail [email protected] Ki-Young Jung, MD
Department of Neurology, Seoul National University
College of Medicine, 101 Daehak-ro, Jongno-gu, Seoul 03080, Korea Tel +82-2-920-6649 Fax +82-2-2072-2474 E-mail [email protected]
*These authors contributed equally to this work.
cc This is an Open Access article distributed under the terms of the Creative Commons Attribution Non-Com- mercial License (http://creativecommons.org/licenses/by-nc/4.0) which permits unrestricted non-commercial use, distribution, and reproduction in any medium, provided the original work is properly cited.
JCN
Open Access ORIGINAL ARTICLEChoi JW et al.
JCN
tients, which indicates a substantial enhancement of motor cortical excitation.7
The pathophysiology of RLS has not been completely iden- tified. However, dysfunction of the dopamine system is re- garded as an important underlying cause because dopamine agonists can successfully improve various symptoms in RLS patients.8 Transcranial magnetic stimulation (TMS) studies have demonstrated the reversal of impaired cortical inhibi- tion following treatment with various dopamine agonists.9,10
RLS is a sleep disorder, and many RLS symptoms appear during sleep. Thus, to identify the mechanisms underlying the abnormalities during sleep and to estimate how these abnor- malities may lead to cognitive and/or behavioral dysfunction, it is crucial to investigate the cortical activity of RLS patients during sleep. We are aware of only one previous electrophysi- ological study of RLS patients during sleep.11 The EEG spectra during stage 2 sleep and rapid eye movement (REM) sleep did not differ significantly between RLS patients and healthy con- trols. High-frequency activities were increased temporally dur- ing arousals and periodic limb movements in both the patients and the controls. However, the increase in high-frequency ac- tivities was significantly dampened in the RLS patients.
Spectral analysis provides information regarding the synchro- nization of local neuronal populations. A functional connectivi- ty analysis provides valuable additional insights regarding co- operation among distant neuronal populations. Interregional phase synchrony maps and graph-theory analyses have dem- onstrated that the human brain network has the properties of a so-called small-world network, whose structure is optimal for interregional information transfer.12 The functional network during sleep also exhibits these characteristics, with local con- nectedness increasing from when awake to deep sleep stages.13,14 This approach has been extended to clinical studies in order to identify functional abnormalities in patients. Several neuro- logical and psychiatric diseases have been associated with the loss of small-world network characteristics.15-17
Based on whole-brain EEG recordings of drug-naïve RLS pa- tients and healthy controls, we attempted to determine whether the functional network as well as the spectral power of neural activities during sleep differ significantly between RLS patients and healthy controls. We also investigated whether the func- tional abnormalities in RLS patients reversed following the ad- ministration of a dopamine agonist by analyzing EEGs from the same patients recorded 12 weeks after initiating dopaminergic treatment with pramipexole.
METhODS
Subjects
RLS was diagnosed by a neurologist (K.-Y.J.) based on the In-
ternational Restless Legs Syndrome Study Group (IRLSSG) diagnostic criteria utilizing the validated Korean version of the John Hopkins telephone diagnostic questionnaire in face- to-face interviews.18 This questionnaire includes questions that help to exclude conditions that may mimic RLS.
A patient was included in the present study if he/she met the following criteria: 1) aged 18–70 years, 2) RLS symptom duration of longer than 1 year, 3) score on the International Restless Legs Syndrome Severity Scale (IRLS) of >19, and 4) no prior treatment for RLS. The exclusion criteria were as follows:
1) presence of significant comorbidities likely to be associat- ed with secondary RLS (e.g., pregnancy, chronic kidney dis- ease, or peripheral neuropathy), 2) presence of RLS-mimick- ing disorders, 3) presence of sleep disorders other than RLS (e.g., sleep apnea, REM sleep behavior disorder, and parasom- nia), as identified by polysomnography (PSG), and 4) pres- ence of cognitive disorders that prevented the subject describ- ing his/her symptoms.
Twelve drug-naïve RLS patients were enrolled in this study (11 females and 1 male), all of whom completed sleep-related questionnaires, which included the Epworth Sleepiness Scale,19 the Insomnia Severity Index (ISI),20 the Beck Depression In- ventory-II (BDI-II),21 and the Pittsburg Sleep Quality Index (PSQI).22 The severity of RLS was assessed using the IRLS.23
A dopamine agonist, pramipexole, was administered to the patients every night at 1 hour prior to bedtime for a period of 12 weeks. The dosage of pramipexole at 1–2 weeks was 0.125 mg/day, and it was subsequently doubled at 2–4 weeks to 0.25 mg/day. At 5–12 weeks the dosage was increased based on the symptoms of the patient, with a maximum of 1 mg/day, and then maintained at that level. After the treatment, the same sleep- related questionnaires and the IRLS were reassessed.
Age- and sex-matched volunteers served as a healthy con- trol group (15 females and 1 male). All of the subjects in the control group completed the same sleep-related questionnaires.
Subjects in the control group were excluded if they had a histo- ry of a sleep disorder (including RLS) and the long-term use of medications to treat a neurological disorder, a psychiatric disorder, or a chronic disease.
Written informed consent was obtained from each subject, and the experimental protocol was approved by the Local Eth- ics Committee (IRB number: ED11228).
Polysomnography
A single overnight PSG recording session was applied to all RLS patients before and after treatment; the first recording was made immediately prior to the administration of the first dose of pramipexole (i.e., the RLS baseline condition), and the second recording was made 12–16 weeks after commencing pramipexole administration (i.e., RLS follow-up condition).
Abnormal Delta-Band Sleep Network in RLS
JCN
Only one overnight PSG recording session was applied to the subjects in the healthy control group. The recordings includ- ed a 19-channel EEG according to the international 10–20 sys- tem, a two-channel electrooculogram, submental and anterior tibialis electromyograms, and a surface electrocardiogram. A cannula was used to measure nasal air pressure, a thermistor was used to monitor the nasal and mouth airflow, piezoelec- tric bands were used to monitor thoracic and abdominal wall movements, and an oximeter was used to measure oxygen sat- uration; a snore sensor and body position sensors were also utilized. All signals were recorded at 200 samples/s.
The sleep stages were scored in 30-s epochs according to the scoring manual of the American Academy of Sleep Medicine.24 Periodic leg movements during sleep (PLMS) were defined as a series of four consecutive leg movements that lasted 0.5–5 s separated by intervals of 5–90 s, in accordance with the cri- teria of the World Association of Sleep Medicine/IRLSSG.25 The reference electrode for the EEG recording was formed using linked ear electrodes, and the ground electrode was placed on the forehead. The impedances of all electrodes were lower than 5 kΩ. A bandpass filter (0.1–70 Hz) and a notch filter (60 Hz) were applied to reduce the background noise.
EEG preprocessing and spectral analysis
EEGs were re-referenced to the average reference. Consider- ing the sleep stages, EEG analyses were performed in 30-s ep- ochs segmented for sleep-stage scoring. A two-step procedure was applied to the raw EEG waveforms for artifact rejection.
First, a high-pass filter with a cutoff frequency of 0.5 Hz was applied to reduce low-frequency artifacts, such as due to sweat- ing and instrumentation drift. Epochs were excluded when the absolute amplitude exceeded 150 μV. The percentages of the remaining epochs after artifact rejection were 71.04±15.85%
(mean±standard deviation) in the control group, 56.69±
15.80% at the RLS baseline, and 69.58±12.97% in the RLS fol- low-up. The deterministic trends and direct current (DC) fluc- tuation were eliminated by removing the DC offset and de- trending.11 Furthermore, all waveforms were transformed into the current source density to mitigate the volume conduction problem.26
The power spectra of the 30-s epochs were estimated using Welch’s method with the following parameters: 4-s windows, 800 samples, and Hamming window with a 50% overlap.27 The resolution in the frequency domain was 0.25 Hz. The power spectra during each sleep stage were subsequently calculated by averaging the power spectra of all epochs associated with a specific stage. The spectral bands were defined as follows: delta (0.5–4 Hz), theta (4–8 Hz), alpha (8–12 Hz), and sigma (12–
16 Hz).
Interregional phase synchrony and graph-theory analyses
The interregional phase synchrony was quantified by calcu- lating the phase coherence (PC).28 Each 30-s epoch was initial- ly transformed into narrowband signals covering the various frequency bands by bandpass filtering using a third-order ze- ro-phase Butterworth filter. The instantaneous phase, ‘θ(t)’, was calculated from the narrowband signal and its Hilbert transform. The PC between two electrodes, ‘i’ and ‘j’, for the ‘nth’ epoch was calculated by averaging the phase difference over time points, ‘T’, as follows:
PCi,j,n=1 T
∑
t=1T exp{
j[θi(t,n)-θj(t,n)]}
(1)The interregional phase synchrony for each sleep stage was obtained by averaging the PC values over all epochs within the stage.
The spatial pattern of the interregional phase synchrony may be treated as a graph that consists of nodes and edges, which allows the spatial pattern to be analyzed quantitatively using graph-theory measures.29 The nodes of the graph corre- spond to the electrodes included in the phase synchrony analy- sis, and the edges correspond to the electrode pairs that exhib- it significant phase synchrony. The graph can be represented by an adjacency matrix. Undirected binary element ‘aij’ of the adjacency matrix represents a connection between nodes ‘i’
and ‘j’, and it is designated as 1 or 0 depending on the presence or absence of a significant connection between these nodes.
A set of numerical measures that describe the properties of the graph is calculated from the adjacency matrix. The clus- tering coefficient, ‘C,’ represents an index of local connectivity and is defined as follows:29
C=1
N
∑
i∈Nci=1N
∑
i∈N∑
j,h∈N aijaihajhki(ki-1) (2)
where ‘i’, ‘j’, and h are the nodes of the graph. ‘j’ and ‘h’ are the nodes connected to node ‘i’ and are referred to as the neigh- boring nodes of node ‘i’. ‘ki’ is called the degree of node ‘i’, which denotes the number of edges connected to that node.
The value of ‘C’ varies from 0 to 1, and it is close to 1 when the neighboring nodes are highly interconnected. In the case of a high ‘C’ the network remains interconnected by neighboring nodes when a node is lost, and so ‘C’ represents a measure of the resilience of the network to errors.12
The characteristic path length, ‘L’, is defined as follows:29
L= 1
N(N-1)i,j
∑
∈N,i≠jdi,j (3)where ‘di,j’ is the minimum number of edges that must be tra- versed to go from node ‘i’ to node ‘j’. ‘L’ corresponds to the av-
Choi JW et al.
JCN
erage path length between all possible pairs of ‘N’ nodes, and so it provides a measure of the global connectedness, which quantifies the extent of graph integration and describes how easily and rapidly information can be transported in the net- work.
Brain functional and anatomical connectivity networks are empirical networks that have the characteristics of a small- world network and so are appropriate for interregional infor- mation transfer.30 The small-worldness index (SWI) is defined as the ratio between the normalized clustering coefficient and the characteristic path length, as follows:31
SWI = Cnorm
Lnorm = C/Crand
L/Lrand (4)
where ‘Cnorm’ and ‘Lnorm’ comprise the normalized clustering coefficient and the characteristic path length, respectively, which are normalized by the values of a random network. The graph-theory indices of a random network can be obtained by creating, say, 50 random networks with the same degree ‘K’ of the network being assessed. The mean values of the clustering coefficients and characteristic path lengths of these 50 random networks would then subsequently be used: ‘Crand’ and ‘Lrand’, respectively. For a typical small-world network, ‘Cnorm’ is greater than 1 while ‘Lnorm’ is close to 1. The topological properties of two dissimilar networks can be compared by adjusting the de- grees of their two graphs to be identical in order to eliminate the effect of the number of connections.17,32
Statistical comparison
The sample was small in this study, and so we applied Kol-
mogorov-Smirnov tests to check that the variables conformed to a normal distribution. Some of them did not pass these tests, and so we used nonparametric tests for further statistical analy- ses. The RLS patients before receiving dopamine agonist treat- ment (i.e., the RLS baseline) and the healthy controls were compared using Mann-Whitney U-tests. Wilcoxon signed-rank tests were used to compare patients between before and after treatment; that is, between the RLS baseline and the RLS fol- low-up. The Kruskal-Wallis test was used to compare the SWI among the sleep stages in each group. Post-hoc tests were per- formed using the Wilcoxon signed-rank test, and multiple com- parisons were corrected using the Bonferroni method.
RESULTS
Clinical and sleep-related variables
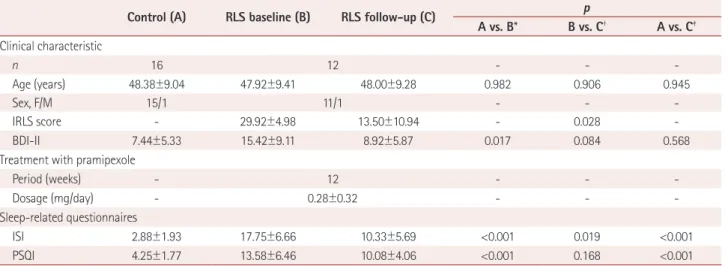
The demographic data and clinical characteristics of the par- ticipants are presented in Table 1. The BDI-II scores for the RLS patients prior to dopaminergic treatment (RLS baseline) were within the range corresponding to mild depression and were also significantly elevated compared to those of the healthy controls (p=0.017 by Mann-Whitney U-test). The sleep quality was worse for the RLS baseline than for the healthy controls, as indicated by the ISI and PSQI score being significantly high- er for the RLS baseline (both p<0.001 in Mann-Whitney U- tests).
The IRLS score for the RLS baseline was within the range corresponding to severe RLS, and it decreased significantly af- ter pramipexole treatment (the RLS follow-up) to a moderate level (p=0.028 in a Wilcoxon signed-ranked test). The sleep
Table 1. Clinical characteristics and scores on the sleep-related questionnaires
Control (A) RLS baseline (B) RLS follow-up (C) p
A vs. B* B vs. C† A vs. C‡ Clinical characteristic
n 16 12 - - -
Age (years) 48.38±9.04 47.92±9.41 48.00±9.28 0.982 0.906 0.945
Sex, F/M 15/1 11/1 - - -
IRLS score - 29.92±4.98 13.50±10.94 - 0.028 -
BDI-II 7.44±5.33 15.42±9.11 8.92±5.87 0.017 0.084 0.568
Treatment with pramipexole
Period (weeks) - 12 - - -
Dosage (mg/day) - 0.28±0.32 - - -
Sleep-related questionnaires
ISI 2.88±1.93 17.75±6.66 10.33±5.69 <0.001 0.019 <0.001
PSQI 4.25±1.77 13.58±6.46 10.08±4.06 <0.001 0.168 <0.001
Data are mean±standard deviation values.
*Control vs. RLS baseline in Mann-Whitney U-tests, †RLS baseline vs. RLS follow-up in Wilcoxon signed-rank tests, ‡Control vs. RLS follow-up in Mann-Whitney U-tests.
BDI-II: Beck Depression Inventory-II, F: female, IRLS: International Restless Legs Syndrome Severity Scale, ISI: Insomnia Severity Index, M: male, PSQI:
Pittsburgh Sleep Quality Index, RLS: restless legs syndrome.
Abnormal Delta-Band Sleep Network in RLS
JCN
quality was also slightly improved following treatment. A sig- nificant difference between before and after the treatment was found only for the ISI (p=0.019 in a Wilcoxon signed-rank test). The scores on the sleep-related questionnaires remained worse than those for the healthy controls even after the RLS patients had received treatment (p<0.001 for both the ISI and PSQI in Mann-Whitney U-tests).
PSG findings
Table 2 summarizes the PSG findings. In general, compared to healthy controls, the RLS patients exhibited abnormally poor sleep-related variables. For example, the REM latency and the
sleep efficiency tended to be increased and decreased, respec- tively, at the RLS baseline, although the differences were not significant. The PLMS index was significantly higher for the RLS baseline than the healthy controls (p=0.004 in a Mann- Whitney U-test).
After administering dopaminergic treatment to the RLS pa- tients, the REM latency and the PLMS index were significantly reduced and the sleep efficiency was significantly increased (p=0.015, 0.006, and 0.019 in Wilcoxon signed-rank tests).
Spectral characteristics of EEGs
Fig. 1A shows the spectral powers of the EEG averaged over
Table 2. Polysomnography findings Parameter Control (A)
(n=16)
RLS baseline (B) (n=12)
RLS follow-up (C) (n=12)
p
A vs. B* B vs. C† A vs. C‡
Total sleep time (min) 394.94±51.65 334.88±91.03 396.16±42.05 0.100 0.099 0.909
Sleep latency (min) 7.41±4.86 20.29±30.95 7.38±5.00 0.371 0.091 0.945
REM latency (min) 96.97±40.08 117.25±42.95 79.00±32.94 0.090 0.015 0.241
WASO (min) 45.84±31.56 70.10±49.45 47.80±29.42 0.110 0.117 0.802
Sleep efficiency (%) 87.98±7.28 77.78±17.97 87.76±7.73 0.082 0.019 0.837
Stage N1 (%) 18.03±9.54 20.57±9.59 16.82±6.78 0.324 0.182 0.945
Stage N2 (%) 43.89±7.48 39.30±12.25 37.93±12.77 0.347 0.556 0.302
Stage N3 (%) 15.39±7.54 17.99±15.07 21.30±13.41 0.945 0.480 0.280
Stage REM (%) 22.70±4.90 22.14±6.54 23.95±7.35 0.599 0.530 0.537
Apnea/hypopnea index 2.21±3.45 3.32±4.41 2.61±3.53 0.280 0.695 0.423
Arousal index 18.08±9.24 20.68±9.20 16.20±6.72 0.174 0.182 0.732
PLMS index 3.08±4.07 23.80±26.00 5.29±4.12 0.004 0.006 0.121
PLMS arousal index 1.77±2.37 6.53±9.24 2.34±2.50 0.133 0.169 0.478
Data are mean±standard deviation values.
*Control vs. RLS baseline in Mann-Whitney U-tests, †RLS baseline vs. RLS follow-up in Wilcoxon signed-rank tests, ‡Control vs. RLS follow-up in Mann-Whitney U-tests.
PLMS: periodic leg movements during sleep, REM: rapid eye movement, RLS: restless legs syndrome, WASO: wakefulness after sleep onset.
15 20 25 30 35 40 IRLS score
RLS baseline 55
50
45
40
35
Delta-band power (dB)
B
Delta Theta Alpha Sigma
*
†
†
†
‡
Control RLS baseline RLS follow-up 50
45
40
35
30
25
Spectral power (dB)
A
Fig. 1. Spectral powers in electroencephalograms (EEGs). A: Comparison of spectral powers in EEGs among groups. The spectral power was ob- tained by averaging the log-transformed power for every sleep stage (awake, N1, N2, N3, and REM) and nine electrodes (F3, Fz, F4, C3, Cz, C4, P3, Pz, and P4). The error bars indicate standard errors (*p<0.05, †p<0.01, and ‡p<0.001, respectively, in Mann-Whitney U-tests and Wilcoxon signed- rank tests). B: Correlation between delta-band power and IRLS scores in RLS patients (baseline condition). Delta-band power was obtained by av- eraging the log-transformed power for the nine electrodes and all sleep stages. Spearman’s rank correlation coefficient (r) was 0.606 (p=0.037).
IRLS: International Restless Legs Syndrome Severity Scale, REM: rapid eye movement, RLS: restless legs syndrome.
Choi JW et al.
JCN
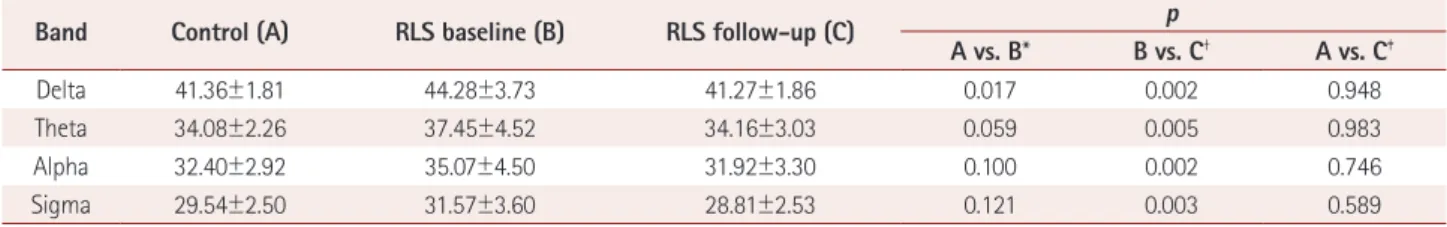
the F3, Fz, F4, C3, Cz, C4, P3, Pz, and P4 electrodes during all sleep stages. All values of the spectral power in each fre- quency band as well as the results of the statistical compari- sons are presented in Table 3. The spectral power was higher for the RLS patients in the baseline condition than for the healthy controls in all frequency bands, but the difference was significant only for the delta band (p=0.017). Dopaminergic treatment resulted in significant reductions in spectral power in all frequency bands, with the decrease being larger in the delta band than in the theta, alpha, and sigma bands (p=0.002, 0.005, 0.002, and 0.003, respectively). Remarkably, the spectral powers in all frequency bands no longer differed significantly between the RLS patients and the healthy controls following dopaminergic treatment.
The correlation between the delta-band power and the IRLS score was investigated for the RLS patients (Fig. 1B). The delta- band power was significantly correlated with the IRLS score in the RLS patients in the baseline condition (r=0.606 and p=
0.037 in Spearman’s rank correlation).
To summarize the EEG spectral characteristics, abnormal cortical activities associated with RLS were most apparent in the delta band. Thus, further analyses using functional con- nectivity and graph theory were applied to the delta-band ac- tivity.
Interregional phase synchrony and graph-theory analyses
Fig. 2 presents the SWI as a function of the degree of the net-
Table 3. Statistical comparison of spectral powers
Band Control (A) RLS baseline (B) RLS follow-up (C) p
A vs. B* B vs. C† A vs. C‡
Delta 41.36±1.81 44.28±3.73 41.27±1.86 0.017 0.002 0.948
Theta 34.08±2.26 37.45±4.52 34.16±3.03 0.059 0.005 0.983
Alpha 32.40±2.92 35.07±4.50 31.92±3.30 0.100 0.002 0.746
Sigma 29.54±2.50 31.57±3.60 28.81±2.53 0.121 0.003 0.589
Data are mean±standard deviation values in dB.
*Control vs. RLS baseline in Mann-Whitney U-tests, †RLS baseline vs. RLS follow-up in Wilcoxon signed-rank tests, ‡Control vs. RLS follow-up in Mann-Whitney U-tests.
RLS: restless legs syndrome.
4 5 6 7 8 4 5 6 7 8 4 5 6 7 8 4 5 6 7 8 4 5 6 7 8
K K K K K
Control vs. RLS baseline Control
RLS baseline
Awake N1 N2 N3 REM
1.8 1.6 1.4 1.2 1.0
1.8 1.6 1.4 1.2 1.0
1.8 1.6 1.4 1.2 1.0
1.8 1.6 1.4 1.2 1.0
1.8 1.6 1.4 1.2 1.0
A
4 5 6 7 8 4 5 6 7 8
4 5 6 7 8 4 5 6 7 8
4 5 6 7 8
K K
K K
K Awake
RLS baseline vs. RLS follow-up RLS baseline
RLS follow-up
N1 N2 N3 REM
2.2 2.0 1.8 1.4 1.6 1.2 1.0 2.2
2.0 1.8 1.4 1.6 1.2 1.0 2.2
2.0 1.8 1.4 1.6 1.2 1.0 2.2
2.0 1.8 1.4 1.6 1.2 1.0 2.2
2.0 1.8 1.4 1.6 1.2 1.0
B
Fig. 2. SWI as a function of degree K in each sleep stage. A: Comparison between the control (black dashed lines) and RLS baseline (denoted by red solid lines). B: Comparison between the RLS baseline (denoted by red lines) and RLS follow-up (denoted by blue lines). The SWI was plotted as the number of identical connections for the three groups. Shading indicates standard errors. Black downward triangles indicate p<0.05 in Mann- Whitney U-tests and Wilcoxon signed-rank tests for (A) and (B), respectively. REM: rapid eye movement, RLS: restless legs syndrome, SWI: small- worldness index.
Abnormal Delta-Band Sleep Network in RLS
JCN
work (i.e., ‘K’) in each sleep stage. The SWI differed signifi- cantly between the groups only for sleep stage N3 (Fig. 2A): it was significantly lower for the RLS baseline than for the healthy controls when ‘K’ was between 6.3 and 6.5 (p<0.047 in a Mann- Whitney U-test). The SWI increased significantly after dopa- minergic treatment in stage N3 for ‘K’ values between 3.5 and 5.8 (p<0.041 in a Wilcoxon signed-rank test) (Fig. 2B). The optimal values of ‘K’ were defined as 3.5–6.5 based on where there were significant differences in Fig. 2.
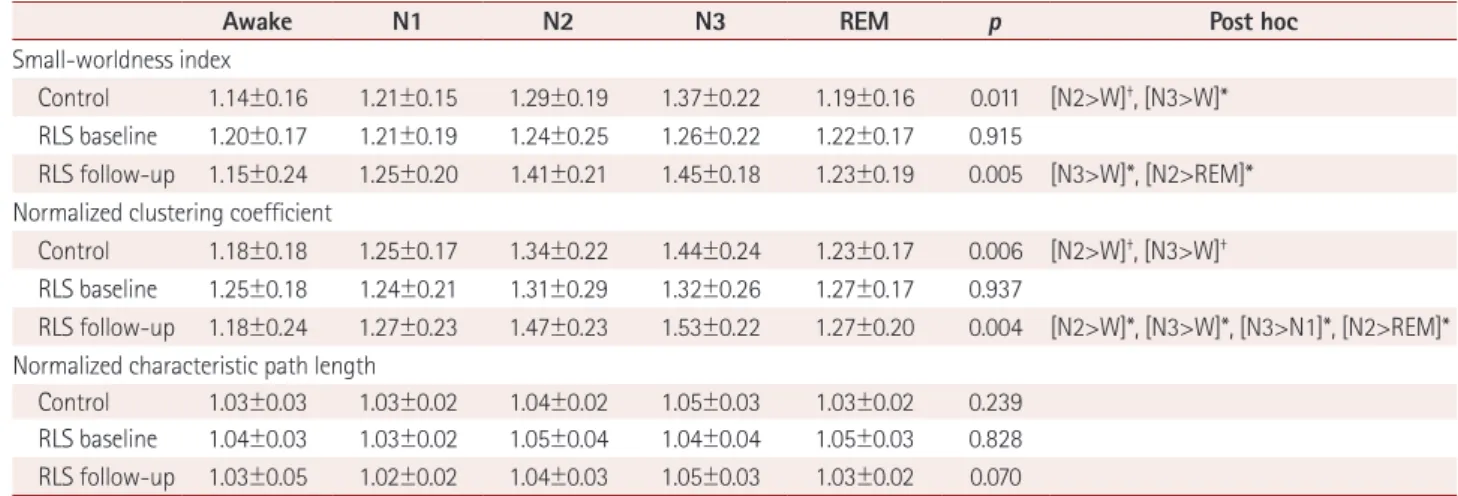
Fig. 3 presents the SWI, ‘Cnorm’, and ‘Lnorm’ averaged across the optimal values of K. The SWI differed significantly with sleep stage only in the healthy controls and at the RLS follow-up (p=0.011 and 0.005, respectively, in Kruskal-Wallis tests, and with p=0.915 for the RLS baseline) (Fig. 3A, Table 4). The SWI was higher during deeper sleep stages in both the healthy con- trols and at the RLS follow-up, and was highest in stage N3. In the healthy controls, the SWI was significantly higher in stag-
es N2 and N3 than when awake (p=0.009 and 0.011, respec- tively, in Wilcoxon signed-rank tests with Bonferroni correc- tion). In the RLS follow-up, the SWI was significantly higher in stage N3 than when awake (p=0.029 in a Wilcoxon signed- rank test with Bonferroni correction), and in stage N2 than during REM sleep (p=0.047 in a Wilcoxon signed-rank test with Bonferroni correction).
The characteristics of the changes in ‘Cnorm’ across sleep stages were largely identical to those in the SWI (Fig. 3B). ‘Cnorm’ dif- fered significantly with sleep stage only in the healthy controls and RLS follow-up (p=0.006 and 0.004, respectively, in Krus- kal-Wallis tests, and with p=0.937 for the RLS baseline) (Table 4). ‘Cnorm’ was higher in the deeper sleep stage in both the healthy controls and RLS follow-up, and peaked in stage N3.
‘Cnorm’ was higher in stages N2 and N3 than when awake in the healthy controls (p=0.006 and 0.004, respectively, in Wilcox- on signed-rank tests with Bonferroni correction). In the RLS
Table 4. Graph-theory measures and summary of statistical comparisons among sleep stages within each group
Awake N1 N2 N3 REM p Post hoc
Small-worldness index
Control 1.14±0.16 1.21±0.15 1.29±0.19 1.37±0.22 1.19±0.16 0.011 [N2>W]†, [N3>W]*
RLS baseline 1.20±0.17 1.21±0.19 1.24±0.25 1.26±0.22 1.22±0.17 0.915
RLS follow-up 1.15±0.24 1.25±0.20 1.41±0.21 1.45±0.18 1.23±0.19 0.005 [N3>W]*, [N2>REM]*
Normalized clustering coefficient
Control 1.18±0.18 1.25±0.17 1.34±0.22 1.44±0.24 1.23±0.17 0.006 [N2>W]†, [N3>W]† RLS baseline 1.25±0.18 1.24±0.21 1.31±0.29 1.32±0.26 1.27±0.17 0.937
RLS follow-up 1.18±0.24 1.27±0.23 1.47±0.23 1.53±0.22 1.27±0.20 0.004 [N2>W]*, [N3>W]*, [N3>N1]*, [N2>REM]*
Normalized characteristic path length
Control 1.03±0.03 1.03±0.02 1.04±0.02 1.05±0.03 1.03±0.02 0.239 RLS baseline 1.04±0.03 1.03±0.02 1.05±0.04 1.04±0.04 1.05±0.03 0.828 RLS follow-up 1.03±0.05 1.02±0.02 1.04±0.03 1.05±0.03 1.03±0.02 0.070 Data are mean±standard deviation values.
*p<0.05 and †p<0.01, respectively, in Wilcoxon signed-rank tests with Bonferroni correction.
REM: rapid eye movement, RLS: restless legs syndrome, W: awake.
Fig. 3. Graph-theory measures for each sleep stage in each group. Normalized clustering coefficient (A), normalized characteristic path length (B), and SWI (C). Each graph-theory measure was obtained by averaging the values from K=3.5 to K=6.5. Error bars indicate standard errors (*p<0.05 and †p<0.01, respectively, in Wilcoxon signed-rank tests with Bonferroni correction). REM: rapid eye movement, RLS: restless legs syndrome.
Control RLS
baseline
RLS follow-up Small-worldness index
1.6
1.4
1.2
1.0
* *
*
†
A
Control RLS
baseline
RLS follow-up Normalized clustering coefficient
1.6
1.4
1.2
1.0
* *
* *
†
†
B
Control RLS
baseline RLS
follow-up Normalized characteristic path length 1.10
1.05
1.00
0.95
C
Awake N1 N2 N3 REM Awake N1 N2 N3 REM Awake N1 N2 N3 REM
Choi JW et al.
JCN
follow-up, ‘Cnorm’ was significantly higher in stages N2 and N3 than when awake (p=0.047 and 0.022, respectively, in Wilcoxon signed-rank tests with Bonferroni correction) and than during REM sleep and stage N1 (both p=0.047 in Wilcoxon signed- rank tests with Bonferroni correction).
‘Lnorm’ did not differ significantly with sleep stage in any of the groups (p=0.239, 0.828, and 0.070 for the controls, RLS baseline, and RLS follow-up, respectively, in Kruskal-Wallis tests). The values of the graph-theory measures and the re- sults of the statistical comparisons are presented in Table 4.
DISCUSSION
The aims of this study were to characterize abnormal corti- cal activity during sleep in RLS patients and to identify the effects of treatment with a dopamine agonist. We found sig- nificant increases in the delta-band power and disruption of the small-world network in RLS patients compared to healthy con- trols. Moreover, these abnormalities were successfully treated with a dopamine agonist.
Increased delta-band power during sleep
Several electrophysiological studies have demonstrated cor- tical hyperexcitability associated with RLS when these patients are awake.7,33,34 Malfunction of the motor inhibition circuitry in RLS patients was revealed by paired-pulse TMS.33,34 Move- ment-related beta-band synchronization was found to be no- tably higher in RLS patients than in healthy controls.7
The delta rhythm in sleep EEG, especially during the deep non-REM sleep stage, has been regarded as an important in- dicator of the homeostatic down-regulation process and sleep deficiency.35 According to the synaptic homeostatic hypothe- sis,35 synaptic potentiation is strengthened during the day- time but reduced to baseline levels during sleep. Such synaptic downscaling has been demonstrated to induce the delta rhythm during sleep, and with the proportion of this rhythm being pro- portional to the degree of synaptic potentiation when awake.36 This finding is supported by several studies identifying an in- creased delta rhythm in response to enhanced synaptic poten- tiation when awake, which was found to be caused by learn- ing, TMS, or sleep deprivation.37-39 An abnormally high delta rhythm may therefore reflect an increased demand for ho- meostatic regulation due to cortical hyperexcitability during wakefulness associated with RLS. This phenomenon may also be supported by the strong and significant correlation between the delta-band power and the IRLS score, which was observed only for the RLS patients in the baseline condition.
Only one previous study reported in the literature has in- vestigated the sleep EEGs of RLS patients, and found that they were significantly altered only during arousal or PLMS-associ-
ated arousal, especially for high-frequency activity, with the findings not differing in healthy controls.11 Additional studies may be required to determine the reason for this discrepancy.
However, several methodological differences should be con- sidered; for example, Hornyak et al.11 investigated non-REM stage 2 sleep and REM sleep at two electrodes (C3-A1 and C4-A2), and defined the delta band as 0.1-3.5 Hz, while in the present study we investigated all sleep stages at broader scalp sites, and the delta band was defined as ranging from 0.5 to 4 Hz.
Loss of small-world network property during deep sleep
We observed disruption of the small-world network in RLS patients during deep sleep (stage N3). This disruption was due to reduced local clustering (i.e., lower clustering coeffi- cient), although the path length was not altered significantly.
Since the human brain exhibits the properties of a small-world network, which is characterized by a high local connectedness and an effective global connectedness, it can be considered an optimal structure for interregional information transfer.40 The functional brain network during sleep has also been charac- terized as a small-world network, with abundant local cluster- ing in the deep-sleep stages.13,14 The higher local connectedness during deep sleep may be related to the previously described enhanced homeostatic downscaling during deep sleep, con- sidering that the downscaling occurs locally.41 This perspective is supported by converging evidence that the sleep delta rhythm is locally modulated under enhanced synaptic poten- tiation.38,39,42 Homeostatic down-regulation in sleep has been considered to play a crucial role in learning and memory.35 In addition to abnormal hyperactivity in the delta band, the weak local clustering and the resulting homeostatic down-regulation may be related to disrupted cognitive functions–such as fron- tal executive function, attention, and working memory–that have been reported in RLS patients.43-46
In contrast to the situation in the healthy controls, the SWI of the RLS patients did not differ significantly with the sleep stage, and it was significantly lower than that in the healthy controls during deep sleep. All graph-theory measures in this study were normalized by random surrogate data, and so the decrease in the SWI close to 1 in RLS may indicate that the functional brain network becomes close to a random network.
We have previously demonstrated a disruption in the func- tional brain network in RLS when performing a cognitive task;47 the current study extends this by indicating that some of the deficits found when RLS patients are awake may also be observed during sleep.
A disrupted functional brain network has been demon- strated in other neurological/psychiatric diseases accompa-
Abnormal Delta-Band Sleep Network in RLS
JCN
nied by cognitive deficits.15-17 A ‘randomization process’ in the functional brain network has been reported in various func- tional states–such as when performing cognitive tasks, in the awake-but-resting state, and during sleep–in several diseases, including schizophrenia, Alzheimer’s disease, and depression.
This randomization process has been suggested as a general pattern of neuropsychiatric diseases.15
Dysfunction of the dopamine system and effects of dopaminergic medication
Previous studies have investigated the efficacy of dopamine agonists in improving the sensory and motor symptoms,48, 49 sleep disturbances,50 and mental illnesses51,52 associated with RLS. Dysregulation of the dopamine system has been con- sidered a crucial mechanism underlying RLS pathophysiolo- gy. The present study has demonstrated that treatment with a dopamine agonist is effective at improving the abnormal neu- ral activity and functional brain network in RLS, in addition to improving the IRLS score and the scores in several sleep- related questionnaires.
Previous studies have consistently demonstrated that cor- tical hyperexcitability in RLS responds well to dopaminergic treatments.9,10,53 Based on these findings, our results suggest that the reversal of cortical hyperexcitability in RLS leads to a reduced need for homeostatic down-regulation during sleep.
However, it remains to be clarified whether the altered cortical activity in RLS comprises an intrinsic characteristic of dopa- minergic dysfunction or a secondary symptom caused by sleep disturbances. Considering that the necessity for homeostatic down-regulation of cortical activity was reduced to a normal level during sleep deprivation,54 we believe that excessive del- ta rhythms that are characteristic of RLS patients do not re- sult from sleep disturbances.
Dopaminergic agonist treatment reversed the impaired small-worldness of the functional brain network during deep sleep in RLS patients. Previous studies have demonstrated al- terations in the brain network in other diseases caused by do- paminergic dysfunction, such as Parkinson’s disease.55-58 Our findings therefore suggest that the functional network charac- teristics identified in the RLS patients are associated with an impaired dopamine system and that they were reversed by pramipexole treatment. This result is also consistent with a previous finding that dopamine antagonist administration impairs both local and global connectedness of the brain net- work.59
Limitations of this study
This study was subject to several limitations. First, our results were obtained from a small number of patients, all of whom had severe RLS. Further studies that include more patients
with broader severity ranges would be helpful for generalizing the findings of this study. Second, the network analysis was based on scalp EEGs recorded using a small number of chan- nels. Further studies using larger numbers of EEG channels along with cortical source imaging would help to explain the cortical network characteristics of RLS patients in more detail.
Conclusion
Abnormal spectral and functional network characteristics of neural activities were observed in RLS patients during sleep, and these abnormalities were successfully reversed by dopa- mine agonist treatment. These findings suggest that an im- paired dopamine system is an important underlying cause of RLS. We consider that our findings represent valuable infor- mation for identifying the mechanisms underlying cortical dysfunction in RLS patients.
Conflicts of Interest
The authors have no financial conflicts of interest.
Acknowledgements
This research was supported by Basic Science Research Program through the National Research Foundation of Korea (NRF) funded by the Ministry of Science, ICT & Future Planning (No. 2014R1A2A2A04003858), and by the Basic Science Research Program through the National Research Foun- dation of Korea (NRF) funded by the Ministry of Education (No. 2015R1 D1A1A01056743).
REFERENCES
1. Allen RP, Picchietti D, Hening WA, Trenkwalder C, Walters AS, Mont- plaisi J, et al. Restless legs syndrome: diagnostic criteria, special consid- erations, and epidemiology. A report from the restless legs syndrome diagnosis and epidemiology workshop at the National Institutes of Health. Sleep Med 2003;4:101-119.
2. Earley CJ. Clinical practice. Restless legs syndrome. N Engl J Med 2003;
348:2103-2109.
3. Etgen T, Draganski B, Ilg C, Schröder M, Geisler P, Hajak G, et al. Bi- lateral thalamic gray matter changes in patients with restless legs syn- drome. Neuroimage 2005;24:1242-1247.
4. Unrath A, Juengling FD, Schork M, Kassubek J. Cortical grey matter alterations in idiopathic restless legs syndrome: an optimized voxel- based morphometry study. Mov Disord 2007;22:1751-1756.
5. Quatrale R, Manconi M, Gastaldo E, Eleopra R, Tugnoli V, Tola MR, et al. Neurophysiological study of corticomotor pathways in restless legs syndrome. Clin Neurophysiol 2003;114:1638-1645.
6. Scalise A, Cadore IP, Gigli GL. Motor cortex excitability in restless legs syndrome. Sleep Med 2004;5:393-396.
7. Schober T, Wenzel K, Feichtinger M, Schwingenschuh P, Strebel A, Krausz G, et al. Restless legs syndrome: changes of induced electroen- cephalographic beta oscillations-an ERD/ERS study. Sleep 2004;27:
147-150.
8. Allen R. Dopamine and iron in the pathophysiology of restless legs syndrome (RLS). Sleep Med 2004;5:385-391.
9. Nardone R, Ausserer H, Bratti A, Covi M, Lochner P, Marth R, et al.
Cabergoline reverses cortical hyperexcitability in patients with rest- less legs syndrome. Acta Neurol Scand 2006;114:244-249.
10. Scalise A, Pittaro-Cadore I, Janes F, Marinig R, Gigli GL. Changes of cortical excitability after dopaminergic treatment in restless legs syn- drome. Sleep Med 2010;11:75-81.
Choi JW et al.
JCN
11. Hornyak M, Feige B, Voderholzer U, Riemann D. Spectral analysis of sleep EEG in patients with restless legs syndrome. Clin Neurophysiol 2005;116:1265-1272.
12. Stam CJ, Reijneveld JC. Graph theoretical analysis of complex net- works in the brain. Nonlinear Biomed Phys 2007;1:3.
13. Ferri R, Rundo F, Bruni O, Terzano MG, Stam CJ. Small-world net- work organization of functional connectivity of EEG slow-wave activ- ity during sleep. Clin Neurophysiol 2007;118:449-456.
14. Spoormaker VI, Schröter MS, Gleiser PM, Andrade KC, Dresler M, Wehrle R, et al. Development of a large-scale functional brain network during human non-rapid eye movement sleep. J Neurosci 2010;30:
11379-11387.
15. Leistedt SJ, Coumans N, Dumont M, Lanquart JP, Stam CJ, Linkowski P. Altered sleep brain functional connectivity in acutely depressed pa- tients. Hum Brain Mapp 2009;30:2207-2219.
16. Micheloyannis S, Pachou E, Stam CJ, Breakspear M, Bitsios P, Vour- kas M, et al. Small-world networks and disturbed functional connec- tivity in schizophrenia. Schizophr Res 2006;87:60-66.
17. Stam CJ, Jones BF, Nolte G, Breakspear M, Scheltens P. Small-world networks and functional connectivity in Alzheimer’s disease. Cereb Cortex 2007;17:92-99.
18. Allen RP, Picchietti DL, Garcia-Borreguero D, Ondo WG, Walters AS, Winkelman JW, et al. Restless legs syndrome/Willis-Ekbom disease di- agnostic criteria: updated International Restless Legs Syndrome Study Group (IRLSSG) consensus criteria--history, rationale, description, and significance. Sleep Med 2014;15:860-873.
19. Johns MW. A new method for measuring daytime sleepiness: the Ep- worth Sleepiness Scale. Sleep 1991;14:540-545.
20. Bastien CH, Vallières A, Morin CM. Validation of the Insomnia Sever- ity Index as an outcome measure for insomnia research. Sleep Med 2001;2:297-307.
21. Sung HM, Kim JB, Ahn HN, Park YN, Bai DS, Lee SH. A study on the reliability and the validity of Korean version of the Beck Depres- sion Inventory-II (BDI-II). J Korean Soc Biol Ther Psychiatry 2008;14:
201-212.
22. Buysse DJ, Reynolds CF 3rd, Monk TH, Berman SR, Kupfer DJ. The Pittsburgh Sleep Quality Index: a new instrument for psychiatric prac- tice and research. Psychiatry Res 1989;28:193-213.
23. Walters AS, LeBrocq C, Dhar A, Hening W, Rosen R, Allen RP, et al.
Validation of the International Restless Legs Syndrome Study Group rating scale for restless legs syndrome. Sleep Med 2003;4:121-132.
24. Iber C, Ancoli-Israel S, Chesson A, Quan SF. The AASM manual for the scoring of sleep and associated events: rules, terminology and technical specifications. Westchester: American Academy of Sleep Medicine, 2007.
25. Zucconi M, Ferri R, Allen R, Baier PC, Bruni O, Chokroverty S, et al.
The official World Association of Sleep Medicine (WASM) standards for recording and scoring periodic leg movements in sleep (PLMS) and wakefulness (PLMW) developed in collaboration with a task force from the International Restless Legs Syndrome Study Group (IRLSSG).
Sleep Med 2006;7:175-183.
26. Kayser J, Tenke CE. Principal components analysis of Laplacian wave- forms as a generic method for identifying ERP generator patterns: I.
Evaluation with auditory oddball tasks. Clin Neurophysiol 2006;117:
348-368.
27. Welch PD. The use of fast Fourier transform for the estimation of power spectra: a method based on time averaging over short, modi- fied periodograms. IEEE Trans Audio Electroacoust 1967;15:70-73.
28. Mormann F, Lehnertz K, David P, Elger CE. Mean phase coherence as a measure for phase synchronization and its application to the EEG of epilepsy patients. Physica D: Nonlinear Phenomena 2000;144:358–369.
29. Sporns O. Graph theory methods for the analysis of neural connectivi- ty patterns. In: Kötter R, editor. Neuroscience Databases. Springer, 2003;
171-185.
30. Sporns O, Zwi JD. The small world of the cerebral cortex. Neuroin- formatics 2004;2:145-162.
31. Humphries MD, Gurney K. Network ‘small-world-ness’: a quantita- tive method for determining canonical network equivalence. PLoS One 2008;3:e0002051.
32. Choi JW, Jang KM, Jung KY, Kim MS, Kim KH. Reduced theta-band power and phase synchrony during explicit verbal memory tasks in fe- male, non-clinical individuals with schizotypal traits. PLoS One 2016;
11:e0148272.
33. Scalise A, Pittaro-Cadore I, Golob EJ, Gigli GL. Absence of postexer- cise and delayed facilitation of motor cortex excitability in restless legs syndrome: evidence of altered cortical plasticity? Sleep 2006;29:770- 34. Tergau F, Wischer S, Paulus W. Motor system excitability in patients 775.
with restless legs syndrome. Neurology 1999;52:1060-1063.
35. Tononi G, Cirelli C. Sleep and synaptic homeostasis: a hypothesis.
Brain Res Bull 2003;62:143-150.
36. Perrett SP, Dudek SM, Eagleman D, Montague PR, Friedlander MJ.
LTD induction in adult visual cortex: role of stimulus timing and in- hibition. J Neurosci 2001;21:2308-2319.
37. Borbély AA, Baumann F, Brandeis D, Strauch I, Lehmann D. Sleep de- privation: effect on sleep stages and EEG power density in man. Elec- troencephalogr Clin Neurophysiol 1981;51:483-495.
38. Huber R, Esser SK, Ferrarelli F, Massimini M, Peterson MJ, Tononi G.
TMS-induced cortical potentiation during wakefulness locally in- creases slow wave activity during sleep. PLoS One 2007;2:e276.
39. Huber R, Ghilardi MF, Massimini M, Tononi G. Local sleep and learn- ing. Nature 2004;430:78-81.
40. Watts DJ, Strogatz SH. Collective dynamics of ‘small-world’ networks.
Nature 1998;393:440-442.
41. Genzel L, Kroes MC, Dresler M, Battaglia FP. Light sleep versus slow wave sleep in memory consolidation: a question of global versus local processes? Trends Neurosci 2014;37:10-19.
42. Huber R, Ghilardi MF, Massimini M, Ferrarelli F, Riedner BA, Peter- son MJ, et al. Arm immobilization causes cortical plastic changes and locally decreases sleep slow wave activity. Nat Neurosci 2006;9:1169- 1176.
43. Jung KY. Cognition in restless legs syndrome. J Sleep Med 2015;12:1-6.
44. Jung KY, Koo YS, Kim BJ, Ko D, Lee GT, Kim KH, et al. Electrophysi- ologic disturbances during daytime in patients with restless legs syn- drome: further evidence of cognitive dysfunction? Sleep Med 2011;12:
416-421.
45. Kim SM, Choi JW, Lee C, Lee BU, Koo YS, Kim KH, et al. Working memory deficit in patients with restless legs syndrome: an event-relat- ed potential study. Sleep Med 2014;15:808-815.
46. Pearson VE, Allen RP, Dean T, Gamaldo CE, Lesage SR, Earley CJ.
Cognitive deficits associated with restless legs syndrome (RLS). Sleep Med 2006;7:25-30.
47. Choi JW, Ko D, Lee GT, Jung KY, Kim KH. Reduced neural synchrony in patients with restless legs syndrome during a visual oddball task.
PLoS One 2012;7:e42312.
48. Montplaisir J, Nicolas A, Denesle R, Gomez-Mancilla B. Restless legs syndrome improved by pramipexole: a double-blind randomized tri- al. Neurology 1999;52:938-943.
49. Silber MH, Girish M, Izurieta R. Pramipexole in the management of restless legs syndrome: an extended study. Sleep 2003;26:819-821.
50. Kallweit U, Khatami R, Pizza F, Mathis J, Bassetti CL. Dopaminergic treatment in idiopathic restless legs syndrome: effects on subjective sleepiness. Clin Neuropharmacol 2010;33:276-278.
51. Jung KY, Kim SM, Song JY, Lee BU, Lee C, Lee SK, et al. Sternberg working memory performance following treatment with pramipexole in patients with moderate-to-severe restless legs syndrome. Sleep Med 2015;16:703-708.
52. Saletu M, Anderer P, Saletu-Zyhlarz G, Hauer C, Saletu B. Acute place- bo-controlled sleep laboratory studies and clinical follow-up with pramipexole in restless legs syndrome. Eur Arch Psychiatry Clin Neu- rosci 2002;252:185-194.
Abnormal Delta-Band Sleep Network in RLS
JCN
53. Rizzo V, Aricò I, Mastroeni C, Morgante F, Liotta G, Girlanda P, et al.
Dopamine agonists restore cortical plasticity in patients with idiopath- ic restless legs syndrome. Mov Disord 2009;24:710-715.
54. Leemburg S, Vyazovskiy VV, Olcese U, Bassetti CL, Tononi G, Cirelli C. Sleep homeostasis in the rat is preserved during chronic sleep re- striction. Proc Natl Acad Sci U S A 2010;107:15939-15944.
55. Göttlich M, Münte TF, Heldmann M, Kasten M, Hagenah J, Krämer UM. Altered resting state brain networks in Parkinson’s disease. PLoS One 2013;8:e77336.
56. Luo CY, Guo XY, Song W, Chen Q, Cao B, Yang J, et al. Functional con- nectome assessed using graph theory in drug-naive Parkinson’s disease.
J Neurol 2015;262:1557-1567.
57. Olde Dubbelink KT, Hillebrand A, Stoffers D, Deijen JB, Twisk JW, Stam CJ, et al. Disrupted brain network topology in Parkinson’s dis- ease: a longitudinal magnetoencephalography study. Brain 2014;137:
197-207.
58. Skidmore F, Korenkevych D, Liu Y, He G, Bullmore E, Pardalos PM.
Connectivity brain networks based on wavelet correlation analysis in Parkinson fMRI data. Neurosci Lett 2011;499:47-51.
59. Achard S, Bullmore E. Efficiency and cost of economical brain func- tional networks. PLoS Comput Biol 2007;3:e17.