Copyright © 2017 The Korean Society for Bone and Mineral Research
This is an Open Access article distributed under the terms of the Creative Commons Attribution Non-Commercial Li- cense (http://creativecommons.org/licenses/by-nc/4.0/) which permits unrestricted non-commercial use, distribu- tion, and reproduction in any medium, provided the original work is properly cited.
Relationship between Serum 25-hydroxy-vitamin D Concentration and Risk of Metabolic Syndrome in Patients with Fatty Liver
Hee-Sook Lim1,2, Tae-Hee Kim3, Hae-Hyeog Lee3, Soon-Kyung Kim4, Bora Lee5, Yoon-Hyung Park2
1Department of Food and Nutrition, Yoensung University, Anyang;
2Department of Preventive Medicine, Soonchunhyang University College of Medicine, Asan;
3Department of Obstetrics and Gynecology, Soonchunhyang University College of Medicine, Bucheon;
4Department of Food Sciences & Nutrition, Soonchunhyang University College of Medicine, Asan;
5Department of Biostatistics, Graduate School of Chung-Ang University, Seoul, Korea
Background: The vitamin D deficiency rate in Koreans is still high and dietary intake is insufficient. The purpose of this study was to provide basic data for the management of metabolic syndrome (MetS) by analyzing the effect of vitamin D levels on the MetS in patients with fatty liver. Methods: We analyzed the MetS ratio and serum 25-hydroxy-vi- tamin D (25[OH]D) concentration in 151 adults diagnosed with fatty liver by using obe- sity index and blood profiles. We collected data on demographic factors, nutrient intake, and lifestyle habits. Results: The mean 25(OH)D concentration of all subjects was 14 ng/
mL and the insufficiency and deficiency rates were 40.4% and 29.8%. The proportion of MetS was 38.4% and the mean 25(OH)D level of MetS group was 12.1 ng/mL. Low-den- sity lipoprotein cholesterol, triglyceride, and blood glucose were higher in the MetS group than in the normal group, and the waist circumference of the male was signifi- cantly higher than that of the normal group. The results showed that the lower the vita- min D concentration, the higher the risk of MetS (odds ratio, 1.47, 95% confidence inter- val, 0.98-2.81; P=0.043). Conclusions: These results suggest that serum 25(OH)D levels may be a risk factor for MetS in patients with fatty liver.
Key Words: Fatty liver, Metabolic syndrome, Vitamin D deficiency
INTRODUCTION
Metabolic syndrome (MetS) is defined by increased blood pressure, high blood sugar, and abnormal levels of other metabolic markers that collectively increase the risk of chronic diseases such as cardiovascular disease and diabetes.[1-3] Di- etary factors, such as high cholesterol and fat content, induces MetS. Milk, fruits, and vegetables have been reported to prevent MetS.[4] In addition, vitamin D de- ficiency has been recently recognized as an important contributing factor and is emerging as a worldwide nutritional problem. The best biomarker of vitamin D status is serum 25-hydroxy-vitamin D (25[OH]D), which represents the metabolic state of calcium and the bone and is inversely correlated with body fat mass, blood glucose control, lipid metabolism, and blood pressure.[5,6] Previous studies have Corresponding author
Yoon-Hyung Park
Department of Preventive Medicine, Soonchunhyang University College of Medicine, 22 Soonchunhyang-ro, Sinchang- myeon, Asan 31538, Korea
Tel: +82-41-570-2483 Fax: +82-41-575-2406 E-mail: [email protected] Received: October 22, 2017 Revised: November 26, 2017 Accepted: November 27, 2017
No potential conflict of interest relevant to this article was reported.
shown that the higher the serum 25(OH)D level, the lower the risk of MetS.[7,8] In addition, serum 25(OH)D levels and insulin resistance were inversely correlated in overweight and obese adults.[9] However, a study of elderly people aged ≥65 years showed that serum 25(OH)D levels and MetS are not associated, and this relationship remains con- troversial.[10]
Among the metabolic-syndrome-related diseases, non- alcoholic fatty liver disease alone is known as a strong pre- dictor of MetS.[11] The amount of fat accumulated in the liver has been reportedly related to the factors associated with MetS and is more than four times higher in people with MetS.[12] Fat accumulation in the liver is primarily due to the inflow of fatty acids into the liver, which in turn increases the amount of fat mass from fat tissues due to insulin resistance. Liver fat accumulation and insulin resis- tance form a vicious cycle in which the causes and effects can be repeated. The expression of genes encoding enzy- mes that regulate vitamin D levels in adipocytes has been a focus to understand the association between obesity and vitamin D.[13] The increase in body fat is known to de- crease the vitamin D metabolism due to the increase of vi- tamin D decomposition effect and the decrease of the ac- tivating enzyme, and it has a negative effect on the vita- min D synthesis due to the lowered liver function such as non-alcoholic fatty liver.[14]
The relationship between vitamin D and MetS has been studied in various age groups and disease groups. Howev- er, there is a lack of vitamin D studies in patients with fatty liver in Korea, and studies on the relationship between vi- tamin D levels and MetS have been rarely conducted. Also, the proportion of insufficient vitamin D defined as a serum 25(OH)D level of <50 nmol/L, was 47.3% and 64.5% in Ko- rean males and females, respectively.[15] The aim of this retrospective study was to investigate the effect of vitamin D status on the risk of MetS in nonalcoholic fatty liver.
METHODS 1. Study subject
Patients diagnosed with simple fatty acid and nonalco- holic fatty liver by ultrasonography were selected. Patients who were positive for hepatitis antigens, consumed ≥40 g of alcohol per week, had a secondary infection, were un- dergoing osteoporosis treatment, and with a diagnosis of
chronic diseases, such as diabetes, hypertension, and hy- perlipidemia, were excluded. A total of 183 individuals were recruited; however, the final analysis was conducted with 151 patients, excluding those who rejected the survey and were not eligible. Participants were fully informed about the purpose, necessity, and method of this study. The sub- ject’s recruitment and data analysis of this survey was con- ducted from March 2013 to February 2014. We obtained the institutional review board approval from Soonchunhy- ang University on the design and progress of the overall research.
2. Variable measurements and definitions
The age and sex of the subjects were checked, and calci- um and vitamin D supplements were examined. Current smokers are participants who have been smoking for more than 6 months. Regular physical activity was defined as walking, cycling, swimming, and exercising for more than three times a week, 30 min/1 time. Anthropometric mea- surements accurately measure the height and weight, and body mass index (BMI) was also calculated. The waist cir- cumference was measured in the upright position using the tape measure between the lower part of the lowest rib and the middle part of the pelvic iliac crest. Systolic and di- astolic blood pressures were measured using a sphygmo- manometer. Blood tests confirmed the results in the medi- cal records. Blood samples collected after 12 hr fasting were measured using an automatic analyzer (Automatic Analyzer Hitachi 747; Hitachi Medical Corp., Hitachi, Japan), and the total cholesterol, low-density lipoprotein (LDL) cholesterol, high-density lipoprotein (HDL) cholesterol, tri- glyceride, and fasting blood glucose (FBG) levels were ob- tained. The MetS was diagnosed based on the criteria of the National Cholesterol Education Program (NCEP)-Adult Treatment Panel (ATP III) using abdominal obesity (males,≥90 cm; females, ≥80 cm).[16] To assess vitamin D status, serum 25(OH)D3 was measured using a chemiluminescent immunoassay (Liaison, DiaSorin, Italy), and blood was col- lected at the time of study consent for accurate analysis of vitamin D. We classified into three groups according to the results of vitamin D concentration.[17]
3. Statistical analysis
All statistical analyses were performed using SPSS (ver- sion 18.0; SPSS Inc., Chicago, IL, USA). Data were reported
as mean±standard deviation or as numbers and percent- ages. The χ2 and Kruskal-Wallis tests were used to deter- mine the significant differences among the three groups.
Independent t-test was used to determine various clinical characteristics. Odds ratios (ORs) were calculated using mul- tinomial logistic regression to estimate the association be- tween 25(OH)D and various factors. Adjusted ORs were de- rived after adjusting the covariates. The proportional chang- es and 95% confidence intervals (CIs) were calculated us- ing the exponentiation of the coefficients, which means that the proportional changes in the arithmetic mean were associated with each level of covariate relative to a refer- ence level. All results were considered statistically signifi- cant when P<0.05.
RESULTS
1. Demographic factors and serum 25(OH)D concentration of the participants
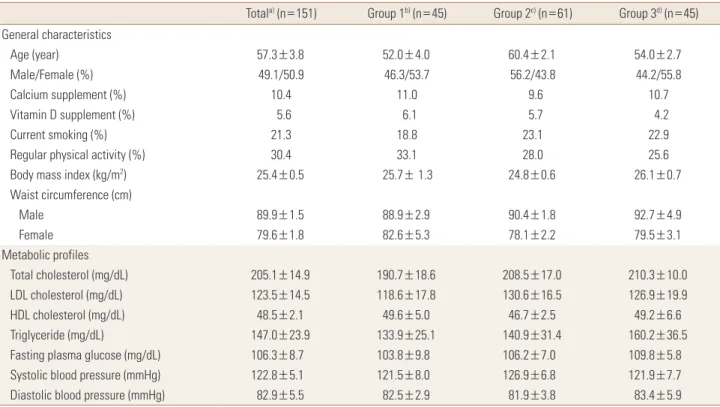
The mean serum 25(OH)D concentration of 151 subjects was 14 ng/mL: 45 in the Group 1 (≥20 ng/mL), 61 in the Group 2 (12-19 ng/mL), and 45 in the Group 3 (<12 ng/
mL) groups according to the criteria of previous study.[18]
The average age was 57.3 years, and male to female ratio was 49:51. The mean BMI was 25.4±0.5 kg/m2, and obesi- ty rates of all three groups were BMI of >25 kg/m2. The av- erage waist circumference was 89.9±1.5 cm in males and 79.6±1.8 cm in females. The waist circumference increased as the serum 25(OH)D concentration decreased in men.
When considering the blood lipid status, the mean total, LDL, and HDL cholesterol and triglyceride results are within the normal range. The mean FBG level was 106.3±8.7 mg/
dL, which was higher than the MetS standard (100 mg/dL).
The average current smoking and regular exercise rates were 21.3% and 30.4%, respectively, and the regular exer- cise rate was low in the low serum 25(OH)D concentration group. However, the baseline characteristic data showed no significant difference based on the serum 25(OH)D con- centration (Table 1).
2. Comparison of various characteristic factors according to MetS
When classifying all the subjects according to the MetS criteria, 38.4% (n=58) of the MetS group were included.
Table 1. Baseline characteristics according to serum 25(OH)D concentration in patients with fatty liver
Totala) (n=151) Group 1b) (n=45) Group 2c) (n=61) Group 3d) (n=45) General characteristics
Age (year) 57.3±3.8 52.0±4.0 60.4±2.1 54.0±2.7
Male/Female (%) 49.1/50.9 46.3/53.7 56.2/43.8 44.2/55.8
Calcium supplement (%) 10.4 11.0 9.6 10.7
Vitamin D supplement (%) 5.6 6.1 5.7 4.2
Current smoking (%) 21.3 18.8 23.1 22.9
Regular physical activity (%) 30.4 33.1 28.0 25.6
Body mass index (kg/m2) 25.4±0.5 25.7± 1.3 24.8±0.6 26.1±0.7
Waist circumference (cm)
Male 89.9±1.5 88.9±2.9 90.4±1.8 92.7±4.9
Female 79.6±1.8 82.6±5.3 78.1±2.2 79.5±3.1
Metabolic profiles
Total cholesterol (mg/dL) 205.1±14.9 190.7±18.6 208.5±17.0 210.3±10.0
LDL cholesterol (mg/dL) 123.5±14.5 118.6±17.8 130.6±16.5 126.9±19.9
HDL cholesterol (mg/dL) 48.5±2.1 49.6±5.0 46.7±2.5 49.2±6.6
Triglyceride (mg/dL) 147.0±23.9 133.9±25.1 140.9±31.4 160.2±36.5
Fasting plasma glucose (mg/dL) 106.3±8.7 103.8±9.8 106.2±7.0 109.8±5.8
Systolic blood pressure (mmHg) 122.8±5.1 121.5±8.0 126.9±6.8 121.9±7.7
Diastolic blood pressure (mmHg) 82.9±5.5 82.5±2.9 81.9±3.8 83.4±5.9
The data is presented as mean±standard deviation or %. There was no significant difference between the three groups.
a)Serum 25(OH)D median: 14 ng/mL. b)Serum 25(OH)D≥20 ng/mL. c)Serum 25(OH)D=12-19 ng/mL. d)Serum 25(OH)D<12 ng/mL.
25(OH)D, 25-hydroxy-vitamin D; LDL, low-density lipoprotein; HDL, high-density lipoprotein.
When comparing the 25(OH)D levels between the two groups, the MetS and normal groups had 12.1±4.9 ng/mL and 18.6±6.7 ng/mL, respectively. Among the general factors, the regular exercise rate between the two groups showed significant difference. The exercise rate was lower in the MetS group (20.3%) than in the normal group (30.4%).
Metabolic profiles showed that waist circumference and LDL cholesterol, triglyceride, and FBG levels in males were significantly higher in the MetS group than in the normal
group (Table 2).
3. Risk for MetS based on the serum level of 25(OH)D concentration
The prevalence of MetS was inversely associated with the serum level of 25(OH)D. Compared with the Group 1 group, the ORs of MetS in the Group 2 and 3 groups pro- gressively increased to 1.70 (95% CI, 1.16-3.86) and 2.59 (95% CI, 1.25-4.31), respectively. In model 2 after adjusting
Table 2. Baseline characteristics according to metabolic syndrome in patients with fatty liver Metabolic syndrome
P-value
Yes (n=58) No (n=93)
Serum 25-hydroxy-vitamin D (ng/mL) 12.1±4.9 18.6±6.7 <0.001
General characteristics
Age (year) 55.0±6.3 57.3±3.0 0.619
Male/Female (%) 62.3/37.7 59.0/41.0 0.362
Calcium supplement (%) 9.8 11.1 0.219
Vitamin D supplement (%) 5.7 6.0 0.605
Current smoking (%) 24.1 20.3 0.170
Regular physical activity (%) 20.3 30.4 0.041
Body mass index (kg/m2) 26.2±1.7 24.3±0.8 0.517
Waist circumference (cm)
Male 93.7±2.0 85.7±3.0 0.001
Female 82.6±4.3 80.1±2.6 0.206
Metabolic profiles
Total cholesterol (mg/dL) 209.3±22.0 204.7±17.2 0.114
LDL cholesterol (mg/dL) 130.8±11.5 112.3±5.1 <0.001
HDL cholesterol (mg/dL) 50.2±4.4 49.0±6.7 0.770
Triglyceride (mg/dL) 155.2±20.7 121.5±19.4 <0.001
Fasting plasma glucose (mg/dL) 109.2±10.6 98.8±8.8 0.023
Systolic blood pressure (mmHg) 123.5±4.0 121.4±2.5 0.416
Diastolic blood pressure (mmHg) 78.5±2.9 80.6±1.0 0.413
The data is presented as mean±standard deviation or %.
P-value by independent student t-test (continuous variables) or χ2 test (categorical variables).
LDL, low-density lipoprotein; HDL, high-density lipoprotein.
Table 3. Multivariate-regression analysis of metabolic syndrome according to 25(OH)D concentrations in patients with fatty liver
Group 1a) Group 2b) Group 3c) P-value for linear trend
Metabolic syndrome
Unadjusted prevalence (%) 29.5 38.8 46.9 0.002
Model 1, OR (95% CI)d) Ref (1.00) 1.70 (1.16-3.86) 2.59 (1.25-4.31) 0.002
Model 2, OR (95% CI)e) Ref (1.00) 1.45 (0.87-2.24) 2.08 (1.11-3.52) 0.010
Model 3, OR (95% CI)f) Ref (1.00) 1.06 (0.81-1.90) 1.47 (0.98-2.81) 0.043
The data is presented as OR (95% CI) or %.
a)Serum 25(OH)D≥20 ng/mL.b)Serum 25(OH)D=12-19 ng/mL. c)Serum 25(OH)D<12 ng/mL. d)Model 1: unadjusted. e)Model 2: adjusted for age, gender, current smoking, and regular physical activity. f)Model 3: further adjusted for metabolic profiles based on model 2.
25(OH)D, 25-hydroxy-vitamin D; OR, odds ratio; CI, confidence interval.
for age, gender, current smoking, and regular physical ac- tivity, the ORs of MetS in the Group 2 and 3 groups signifi- cantly increased to 1.45 (95% CI, 0.87-2.24) and 2.08 (95%
CI, 1.11-3.52), respectively. After adjusting for the metabol- ic profiles based on model 2, the ORs of MetS were 1.06 (95% CI, 0.81-1.90) and 1.47 (95% CI, 0.98-2.81) (Table 3).
DISCUSSION
This study aimed to investigate the incidence of MetS in patients with fatty liver and the difference in the risk of MetS based on vitamin D concentration. First, the average serum 25(OH)D concentration in patients with fatty liver was extremely low (14 ng/mL). Vitamin D is deficient when the blood 25(OH)D concentration is <12 ng/mL; insuffi- cient, 12 to 20 ng/mL; and sufficient, >20 ng/mL.[18] Con- sidering these standard values, 40.4% and 29.8% of the study subjects had insufficient and deficient blood 25(OH) D concentrations, which contributes to the vulnerability of vitamin D status. The proportion of MetS among the pa- tients with fatty liver was 38.4%. In Korea, the relationship between MetS and vitamin D status in fatty liver patients has not been studied. Therefore, comparing accurate re- sults is difficult. The nonalcoholic fatty liver disease was as- sociated with MetS. Risk factor were abdominal obesity, hyperglycemia, hypertension, and dyslipidemia as each component of MetS.[19] In addition, OR of MetS in the fat- ty liver disease significantly increased to 3.43 compared to normal group.[20] In this study, the MetS group had a low regular physical activity rate, high waist circumference in men, and high LDL cholesterol, triglyceride, and FBG levels, which is consistent with the previous studies in other coun- tries. Chitturi et al.[21] reported that 98% of nonalcoholic fatty liver patients had insulin resistance and 87% had MetS.
This difference may be because the actual rate of associa- tion is thought to be related to the higher prevalence of obesity in Western people than in Korea. Most importantly, majority of patients with fatty liver are high risk of MetS and have a higher degree of obesity. Therefore, intensive management is required.
Considering a number of factors, the risk of MetS signifi- cantly increased as the vitamin D concentration decreased.
Low vitamin D levels in Korean adult [22] or diabetic pati- ents [23] have been associated with increased risk of MetS, and vitamin D levels in obese individuals are highly corre-
lated with insulin resistance and MetS. Insulin resistance is the main mechanism of MetS. This is because vitamin D lowers insulin resistance by promoting the expression of insulin receptors or intracellular insulin response that be- gins with the influx of calcium.[24] However, a few studies are not directly relevant; therefore, further research is re- quired.
This study has several limitations. First, this study was based on the retrospective design with the small numbers of subjects. Since it could cause the selection bias, there was an inadequate part to generalize the results. Second, the results of the analysis of dietary intake were not con- sidered. We believe that a more comprehensive compari- son is necessary between the normal control group rather than the fatty liver patients. However, we could provide basic data by analyzing various metabolic indexes for pa- tients with fatty liver. Therefore, patients with fatty liver should be identified early to prevent chronic diseases and improve the bone-related vitamin D concentrations in pa- tients high risk of MetS.
ACKNOWLEDGMENTS
This research was supported by High Value-added Food Technology development program, Ministry of agriculture, Food and Rural Affairs, Republic of Korea (116029-03-2- HD040).
REFERENCES
1. Lorenzo C, Williams K, Hunt KJ, et al. The national choles- terol education program - adult treatment panel III, inter- national diabetes federation, and world health organiza- tion definitions of the metabolic syndrome as predictors of incident cardiovascular disease and diabetes. Diabetes Care 2007;30:8-13.
2. Dekker JM, Girman C, Rhodes T, et al. Metabolic syndrome and 10-year cardiovascular disease risk in the Hoorn Study.
Circulation 2005;112:666-73.
3. Laaksonen DE, Lakka HM, Niskanen LK, et al. Metabolic syndrome and development of diabetes mellitus: applica- tion and validation of recently suggested definitions of the metabolic syndrome in a prospective cohort study.
Am J Epidemiol 2002;156:1070-7.
4. Sabaté J, Wien M. A perspective on vegetarian dietary pat-
terns and risk of metabolic syndrome. Br J Nutr 2015;113 Suppl 2:S136-43.
5. Holick MF. Vitamin D deficiency. N Engl J Med 2007;357:
266-81.
6. Forouhi NG, Luan J, Cooper A, et al. Baseline serum 25-hy- droxy vitamin d is predictive of future glycemic status and insulin resistance: the Medical Research Council Ely Pro- spective Study 1990-2000. Diabetes 2008;57:2619-25.
7. Ford ES, Ajani UA, McGuire LC, et al. Concentrations of se- rum vitamin D and the metabolic syndrome among U.S.
adults. Diabetes Care 2005;28:1228-30.
8. Ford ES, Zhao G, Li C, et al. Serum concentrations of vita- min D and parathyroid hormone and prevalent metabolic syndrome among adults in the United States. J Diabetes 2009;1:296-303.
9. Choi HS, Kim KA, Lim CY, et al. Low serum vitamin D is as- sociated with high risk of diabetes in Korean adults. J Nutr 2011;141:1524-8.
10. Snijder MB, Lips P, Seidell JC, et al. Vitamin D status and parathyroid hormone levels in relation to blood pressure:
a population-based study in older men and women. J In- tern Med 2007;261:558-65.
11. Lee SW, Lee TY, Yang SS, et al. The association of non-alco- holic fatty liver disease and metabolic syndrome in a Chi- nese population. Hepatobiliary Pancreat Dis Int 2017;16:
176-80.
12. Kotronen A, Westerbacka J, Bergholm R, et al. Liver fat in the metabolic syndrome. J Clin Endocrinol Metab 2007;92:
3490-7.
13. Seldeen KL, Pang M, Rodríguez-Gonzalez M, et al. A mouse model of vitamin D insufficiency: is there a relationship between 25(OH) vitamin D levels and obesity? Nutr Metab (Lond) 2017;14:26.
14. Cimini FA, Barchetta I, Carotti S, et al. Relationship between adipose tissue dysfunction, vitamin D deficiency and the
pathogenesis of non-alcoholic fatty liver disease. World J Gastroenterol 2017;23:3407-17.
15. Choi HS. Vitamin d status in Korea. Endocrinol Metab (Seoul) 2013;28:12-6.
16. Lee S, Park HS, Kim SM, et al. Cut-off points of waist circum- ference for defining abdominal obesity in the Korean pop- ulation. Korean J Obes 2006;15:1-9.
17. National Institutes of Health. Vitamin D. Fact sheet for health professionals. Bethesda, MD: U.S. Department of Health and Human Services, National Institute of Health, Office of Dietary Supplements; 2014.
18. Hollis BW. Assessment of vitamin D status and definition of a normal circulating range of 25-hydroxyvitamin D. Curr Opin Endocrinol Diabetes Obes 2008;15:489-94.
19. Kim D, Touros A, Kim WR. Nonalcoholic fatty liver disease and metabolic syndrome. Clin Liver Dis 2018;22:133-40.
20. Dixon JB, Bhathal PS, O'Brien PE. Nonalcoholic fatty liver disease: predictors of nonalcoholic steatohepatitis and liver fibrosis in the severely obese. Gastroenterology 2001;
121:91-100.
21. Chitturi S, Abeygunasekera S, Farrell GC, et al. NASH and insulin resistance: insulin hypersecretion and specific as- sociation with the insulin resistance syndrome. Hepatolo- gy 2002;35:373-9.
22. Yoon H, Jeong DK, Park CE, et al. The association between gender difference with metabolic syndrome, metabolic syndrome score and serum vitamin D levels in Korean adults.
Int J Food Sci Nutr 2017;68:121-9.
23. Lim S, Kim MJ, Choi SH, et al. Association of vitamin D de- ficiency with incidence of type 2 diabetes in high-risk Asian subjects. Am J Clin Nutr 2013;97:524-30.
24. Eshraghian A. Bone metabolism in non-alcoholic fatty liv- er disease: vitamin D status and bone mineral density. Mi- nerva Endocrinol 2017;42:164-72.