Received: July 2, 2014 Revised: November 7, 2014 Accepted: November 25, 2014
Correspondence to: Tae Hyong Kim, Division of Infections Diseases, Soonchunhyang University Seoul Hospital, 59 Daesagwan-ro, Yongsan-gu, Seoul 140-743, Korea
Tel: 02-709-9194, Fax: 02-709-9083 E-mail: [email protected]
*This study was supported by a grant of year 2011-2012 from the Korea Centers for Disease Control and Prevention.
전국병원감염감시체계 중환자실 부문 결과 보고:
2011년 7월부터 2012년 6월
전민혁1ㆍ김태형2ㆍ김성란3ㆍ천희경4ㆍ한수하5ㆍ방지환6ㆍ박은숙7ㆍ정선영8 엄중식9ㆍ김영근10ㆍ이길연11ㆍ최희정12ㆍ김효열10ㆍ김경미13ㆍ성주헌14ㆍ어 영15
김홍빈16ㆍ정흥수17ㆍ권준욱17ㆍ우준희18ㆍ전국병원감염감시체계
순천향대학교 의과대학 천안병원 감염내과1, 순천향대학교 의과대학 서울병원 감염내과2, 고려대학교 구로병원 감염관리실3, 경희대학교병원 감염관리실4, 순천향대학교 부천병원 감염관리실5, 서울특별시 보라매병원 감염내과6,
세브란스병원 감염관리실7, 건양대학교 간호대학 간호학과8, 한림대학교 의과대학 강동성심병원 감염내과9, 연세대학교 원주의과대학 원주세브란스기독병원 감염내과10, 경희대학교 의학전문대학원 경희대학교병원 외과11, 이화여자대학교 의학전문대학원 내과12, 세명대학교 간호학과13, 서울대학교 보건대학원 역학교실, 보건환경 연구소14,
연세대학교 원주의과대학 원주세브란스기독병원 진단검사의학과15, 서울대학교 의과대학 분당서울대병원 감염내과16, 질병관리본부 감염병대응센터17, 울산대학교 의과대학 서울아산병원 감염내과18
Korean Nosocomial Infections Surveillance System, Intensive Care Unit Module Report: Summary of Data from July 2011 through June 2012
Min Hyok Jeon1, Tae Hyong Kim2, Sung Ran Kim3, Hee Kyung Chun4, Su Ha Han5, Ji Hwan Bang6, Eun Suk Park7, Sun Young Jeong8, Joong Sik Eom9, Young Keun Kim10, Kil Yeon Lee11, Hee Jung Choi12,
Hyo Youl Kim10, Kyung Mi Kim13, Joohon Sung14, Young Uh15, Hong Bin Kim16, Heoung-Soo Chung17, Jun-Wook Kwon17, Jun Hee Woo18, Korean Nosocomial Infection (KONIS)
Division of Infectious Diseases, Soonchunhyang University College of Medicine, Cheonan Hospital1, Cheonan, Division of Infectious Diseases, Soonchunhyang University College of Medicine, Seoul2, Infection Control Office, Korea University Guro Hospital3, Seoul, Infection Control Department, Kyung Hee University Medical Center4, Seoul, Infection Prevention and Control Team, Soonchunhyang University Bucheon Hospital5, Bucheon, Division of Infectious Diseases, Seoul Metropolitan Boramae Hospital6, Department of Infection Control, Severance Hospital7, Seoul, Department of Nursing, Konyang University College of Nursing, Daejeon8, Daejeon, Division of Infectious Diseases, Hallym University College of Medicine Kangdong Sacred Heart Hospital9, Seoul, Division of Infectious Diseases, Yonsei University Wonju College of Medicine, Wonju Sevrans Christian Hospital10, Wonju, Department of General Surgery, Kyung Hee University School of Medicine, Kyung Hee Hospital11, Department of Internal Medicine, Ewha Womans University School of Medicine12, Seoul, Department of Nursing, Semyung University13, Jecheon, Seoul National University School of Public Health and Institution of Health and Environment14, Seoul, Department of Laboratory Medicine, Yonsei University Wonju College of Medicine, Wonju Sevrans Christian Hospital15, Wonju, Division of Infectious
Diseases, Seoul National University College of Medicine, Bundang Hospital16, Seongnam, Korea Centers for Disease Control and Prevention17, Cheongju, Department of Infectious Diseases, Asan Medical Center,
University of Ulsan College of Medicine18, Seoul, Korea
Background: This article reports annual data of intensive care units (ICU) module of the Korean Nosocomial Infections Surveillance (KONIS) system from July 2011 through June 2012.
Methods: We performed a prospective surveillance of nosocomial urinary tract infections (UTI), bloodstream infections (BSI), and pneumonia (PNEU) at 143 ICUs in 81 hospitals using the KONIS system. Nosocomial infection (NI) rates were calculated as the number of infections per 1,000 patient days or device days. Asymptomatic bacteriuria was excluded on or after October 1, 2011.
Results: A total of 3,374 NIs were found during the study period: 1,356 UTIs (1,336 cases were urinary catheter- associated), 1,253 BSIs (1,091 were central line-associated), and 765 PNEUs (481 were ventilator-associated). The rate of urinary catheter-associated UTIs (CAUTIs) was 2.26 cases per 1,000 device-days (95% confidence interval, 2.14-2.39) and urinary catheter utilization ratio was 0.85 (0.849-0.851). The rate of central line-associated BSIs was 3.01 (2.84-3.19) and the utilization ratio was 0.52 (0.519-0.521). The rate of ventilator-associated PNEUs (VAPs) was 1.70 (1.56-1.86) and the utilization ratio was 0.40 (0.399-0.401). Ventilator and urinary catheter utilization ratios were lower in the ICUs of hospitals with 400-699 beds than those in hospitals with 700-899 beds or more than 900 beds.
Nevertheless, VAPs and CAUTIs were more common in hospitals with 400-699 beds.
Conclusion: Nosocomial infection rates were similar to the findings of those of the previous period, July 2010-July 2011.
Implementation of proven infection-control strategies are needed, especially in the hospitals having fewer than 700 beds.
Keywords: Intensive care unit, KONIS, Korean Nosocomial Infections Surveillance System, Nosocomial infection
Introduction
병원감염은 환자의 재원기간 증가, 이환, 사망 증가와 관련이 있고 막대한 의료비의 손실을 초 래한다. 환자의 안전과 의료재정의 절감을 위해 서는 병원감염을 줄이기 위한 감염관리 중재활 동과 협의진료, 교육 활성화 노력이 중요하다. 병 원감염의 감시는 그러한 감염관리 중재활동에 있어서 가장 초석이 되는 활동이다.
전국병원감염감시체계(Korean Nosocomial Infec- tions Surveillance System, KONIS)는 2006년 7월 발족한 이래 법적인 강제성 없이 순수하게 자발 적인 참여로 질병관리본부의 지원을 받아 전국 의 감염관리 전담가들에 의해서 운영되고 있다.
다양한 규모의 전국 종합병원 중환자실의 병원감 염 감시체계를 지속적으로 유지함으로 감염률을 산출하고 실무자들이 그 지표에 따라서 중재활동 을 할 수 있도록 하여 우리나라 중환자실의 병원 감염 예방활동의 수준과 저변을 넓히고, 궁극적 으로는 중환자실 진료환경에서 병원감염으로 인 한 사망과 비용증가를 줄이는 것이 목적이다.
이 보고서는 대한병원감염관리학회에서 질병 관리본부와 함께 운영하고 있는 KONIS의 중환 자실 부문 2011년 7월부터 2012년 6월까지의 연
간자료이다.
Materials and Methods
2011년 7월부터 2012년 6월까지 총 93개 병원 에서 각 참여병원의 성인중환자실 중 대표적인 내과계와 외과계 중환자실 또는 통합중환자실을 대상으로 하여 총 143개 중환자실이 참여하였다.
자료를 분석할 때 각 참여병원의 특성을 고려하 기 위해 ‘참여병원 특성 조사 설문지’를 배포하 여 병원의 형태적 특성, 인력 구성과 질적인 부 분 등의 기초정보를 조사하였다. 해당 중환자실 에서 요로감염(urinary tract infection), 혈류감염 (bloodstream infection)과 폐렴(pneumonia)에 대한 병원감염감시를 수행하였다. 중환자실 병원감염 과 요로감염, 혈류감염, 폐렴의 정의는 미국 질병 관리본부(Center for Disease Control and Preven- tion)의 정의에 근거하였다[1]. 2011년 9월까지 요 로감염으로 보고되었던 ‘무증상 세균뇨(asympto- matic bacteriuria)’는 2011년 10월 1일부터 제외되 었고, ‘증상 요로감염(symptomatic urinary tract in- fection)’만 요로감염에 포함하였다. 혈류감염은
‘원인균 확인 혈류감염(laboratory-confirmed blood- stream infection)’을 감시대상으로 하였다[2]. 폐렴
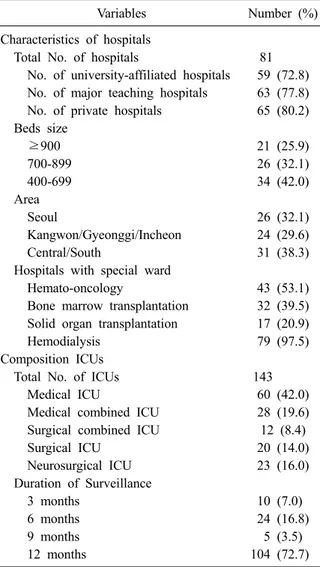
Table 1. Characteristics of hospitals and intensive care units participated in KONIS from July 2011 through June 2012
Variables Number (%)
Characteristics of hospitals
Total No. of hospitals 81
No. of university-affiliated hospitals 59 (72.8) No. of major teaching hospitals 63 (77.8) No. of private hospitals 65 (80.2) Beds size
≥900 21 (25.9)
700-899 26 (32.1)
400-699 34 (42.0)
Area
Seoul 26 (32.1)
Kangwon/Gyeonggi/Incheon 24 (29.6)
Central/South 31 (38.3)
Hospitals with special ward
Hemato-oncology 43 (53.1)
Bone marrow transplantation 32 (39.5) Solid organ transplantation 17 (20.9)
Hemodialysis 79 (97.5)
Composition ICUs
Total No. of ICUs 143
Medical ICU 60 (42.0)
Medical combined ICU 28 (19.6) Surgical combined ICU 12 (8.4)
Surgical ICU 20 (14.0)
Neurosurgical ICU 23 (16.0)
Duration of Surveillance
3 months 10 (7.0)
6 months 24 (16.8)
9 months 5 (3.5)
12 months 104 (72.7)
Abbreviations: No., number; ICU, intensive care unit.
은 ‘임상적 폐렴(clinically defined pneumonia)’,
‘원인균 확인 폐렴(pneumonia with specific labo- ratory findings)’과 ‘면역저하자 폐렴(pneumonia in immunocompromised patients)’으로 분류하였다. 요 로감염, 혈류감염과 폐렴에서 각각 요로카테터, 중심정맥관 또는 인공호흡기와의 관련 여부를 구분하였다. 항생제 감수성 결과가 있는 미생물의 항생제에 대한 내성률을 조사하였다. 이때 중등도 내성도 내성에 포함시켜 분석하였다. KONIS 병원 감염감시가 기구일수 감염률에 미친 영향을 분 석하기 위해 2011년 7월-2012년 6월 기구일수 감 염률 자료를 2007년 7월-2011년 6월의 최근 4년 간의 연간자료와 비교하였다[3-6]. 95% 신뢰구간
이 겹치지 않는 경우 유의한 차이가 있는 것으로 판단하였다.
Results
1. KONIS 참여병원과 참여중환자실의 특성 2010년 7월부터 2011년 6월까지 KONIS 중환 자실 부문에 참여한 병원과 중환자실의 특성은 Table 1과 같다. 총 81개의 참여병원 중 대학병원 은 59개(73%)이었고 주교육병원은 63개(78%)이 었다. 병상 규모별로는 400-699병상 사이가 34개 (42%), 700-899병상 사이가 26개(32%), 900병상 이상이 21개(26%)이었고, 평균 병상 수는 786개 이었다. 지역별로는 서울이 26개, 강원/경기/인천 지역 24개, 중남부권역 31개이었다. 한 병원 당 감염관리전담자가 1.9명이 근무하였고 이들은 1 인당 평균 416병상을 담당하고 있었다. 총 143개 의 참여중환자실은 종류별로 내과계 중환자실 60개(42%), 내과중심의 혼합중환자실 28개(20%), 외과중심의 혼합중환자실 12개(8%), 외과계 중환 자실 20개(14%), 신경외과계 중환자실이 23개 (16%)이었다. 감시 기간은 3개월이 10개(7%), 6개 월이 24개(17%)이었고, 12개월 동안 감시를 수행 한 중환자실은 104개(73%)이었다.
2. 병원감염 건수와 재원일수 감염률
연구 기간 동안 총 3,374건의 병원감염이 발생 하였다. 이 중 요로감염이 1,356건(53%), 혈류감 염이 1,253건(29.0%), 폐렴이 765건(18%)이었다.
참여중환자실의 총 재원일수는 698,595일이었다.
전체 병원감염(요로감염, 혈류감염과 폐렴)에 대 한 1,000 재원일수 당 병원감염 건수는 4.83 (95%
신뢰구간[CI], 4.67-5.00)이었다. 요로감염의 1,000 재원일수 당 병원감염 건수는 1.94 (95% CI, 1.84-2.05), 혈류감염은 1.79 (95% CI, 1.70-1.90), 폐렴은 1.10 (95% CI, 1.02-1.18)이었다(Table 2).
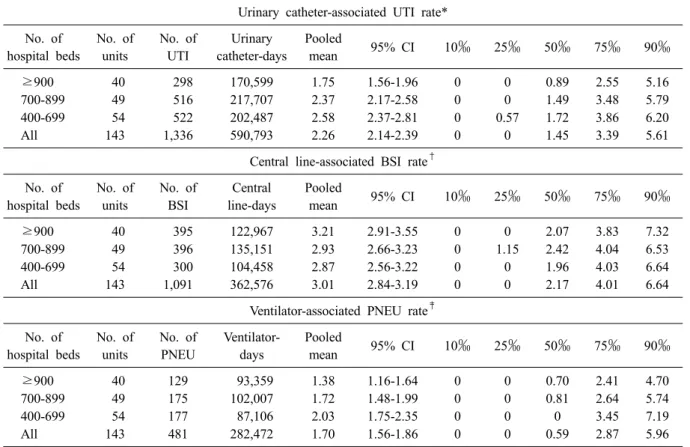
3. 기구일수 감염률과 기구사용률
요로감염 1,356건 중 1,336건(99%)이 요로카테 터와 관련이 있었다. 전체 요로카테터 기구일수 는 590,793일이었고, 요로카테터 관련 요로감염의 1,000 기구일수 당 병원감염 건수는 2.26 (95% CI,
Table 2. Pooled means of nosocomial infection rates, by number of hospital beds, July 2011 through June 2012
Nosocomial infection rate No. of hospital beds
≥900 700-899 400-699 All
No. of units 40 49 54 143
Patient-days 193,650 254,558 250,387 698,595
Infection rate*
No. of infections 926 1,279 1,169 3,374
Pooled mean 4.78 5.02 4.67 4.83
95% CI 4.48-5.10 4.76-5.31 4.41-4.94 4.67-5.00
UTI rate†
No. of UTI 301 520 535 1,356
Pooled mean 1.55 2.04 2.14 1.94
95% CI 1.39-1.74 1.87-2.23 1.96-2.33 1.84-2.05
BSI rate‡
No. of BSI 426 461 366 1,253
Pooled mean 2.20 1.81 1.46 1.79
95% CI 2.00-2.42 1.65-1.98 1.32-1.62 1.70-1.90
PNEU rate§
No. of PNEU 199 298 268 765
Pooled mean 1.03 1.17 1.07 1.10
95% CI 0.89-1.18 1.05-1.31 0.95-1.21 1.02-1.18
*(No. of UTIs, BSIs, or PNEUs/No. of patient-days)×1,000; †(No. of UTIs/No. of patient-days)×1,000; ‡(No. of BSIs/No. of patient-days)×1,000; §(No. of PNEUs/No. of patient-days)×1,000.
Abbreviations: UTI, urinary tract infection; BSI, bloodstream infection; PNEU, pneumonia; CI, confidence interval.
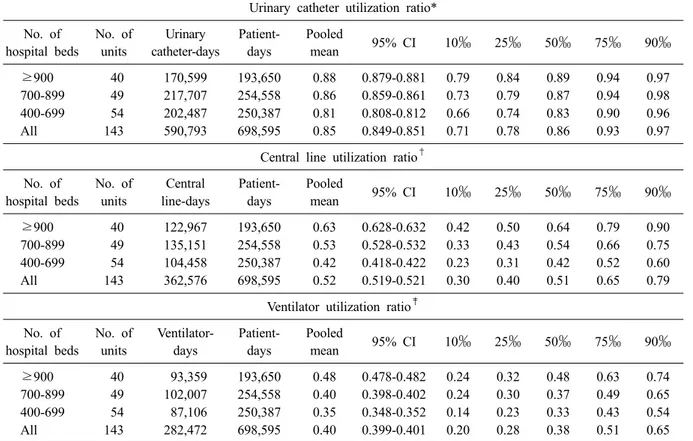
2.14-2.39)이었다(Table 3). 요로카테터의 기구사용 률은 0.85 (95% CI, 0.849-0.851)이었다(Table 4).
혈류감염 1,253건 중 1,091건(87%)이 중심정맥 관과 관련된 것이었다. 전체 중심정맥관 기구일 수는 362,576일이었고, 중심카테터 관련 혈류감 염의 1,000 기구일수 당 병원감염 건수는 3.01 (95% CI, 2.84-3.19)이었다. 중심정맥관의 기구사 용률은 0.52 (95% CI, 0.519-0.521)이었다.
폐렴 765건 중 481건(63%)이 인공호흡기와 관련 된 것이었다. 전체 인공호흡기 기구일수는 282,472 일이었고, 인공호흡기 관련 페렴의 1,000 기구일수 당 병원감염 건수는 1.70 (95% CI, 1.56-1.86)이었 다. 인공호흡기의 기구사용률은 0.40 (95% CI, 0.399-0.401)이었다.
4. 병상규모에 따른 기구일수 감염률과 기구 사용률의 비교
요로카테터의 기구사용률은 병상규모가 400-699 병상 사이, 700-899병상 사이, 900병상 이상인 병 원으로 갈수록 의미 있게 증가하였다(0.81 [95%
CI, 0.808-0.812], 0.86 [95% CI, 0.859-0.861], 0.88
[95% CI, 0.879-0.881]) (Table 4). 그러나, 요로카 테터 관련 요로감염의 기구일수 감염률은 400-699 병상 사이, 700-899병상 사이, 900병상 이상인 병 원의 중환자실 순으로 낮았다(2.58 [95% CI, 2.37-2.81], vs. 2.37 [95% CI, 2.17-2.58], 1.75 [95%
CI, 1.56-1.96]) (Table 3).
중심정맥관도 400-699병상, 700-899병상, 900병 상 이상인 병원으로 갈수록 의미 있게 기구사용 률이 높았다(0.42 [95% CI, 0.418-0.422], 0.53 [95% CI, 0.528-0.532], 0.63 [95% CI, 0.628-0.632]).
그러나, 중심카테터 관련 혈류감염의 기구일수 감염률은 병상 규모에 따른 유의한 차이가 없었 다(2.87 [95% CI, 2.56-3.22] vs. 2.93 [95% CI, 2.66-3.23], 3.21 [95% CI, 2.91-3.55]).
인공호흡기도 병상규모가 커질수록 의미 있게 기구사용률이 높았다[0.35 (95% CI, 0.348-0.352), 0.40 (95% CI, 0.398-0.402), 0.48 (95% CI, 0.478-0.482)]. 그러나 인공호흡기 관련 렴의 기구 일수 감염률은 인공호흡기 기구사용률이 낮았던 400-699 병상 사이의 병원이 900병상 이상 병원의 중환자실에 비해 높았다[2.24 (95% CI, 1.75-2.35)
Table 3. Pooled means and percentiles of the distribution of device- associated infection rates, by number of hospital beds, July 2011 through June 2012
Urinary catheter-associated UTI rate*
No. of hospital beds
No. of units
No. of UTI
Urinary catheter-days
Pooled
mean 95% CI 10‰ 25‰ 50‰ 75‰ 90‰
≥900 40 298 170,599 1.75 1.56-1.96 0 0 0.89 2.55 5.16
700-899 49 516 217,707 2.37 2.17-2.58 0 0 1.49 3.48 5.79
400-699 54 522 202,487 2.58 2.37-2.81 0 0.57 1.72 3.86 6.20
All 143 1,336 590,793 2.26 2.14-2.39 0 0 1.45 3.39 5.61
Central line-associated BSI rate† No. of
hospital beds
No. of units
No. of BSI
Central line-days
Pooled
mean 95% CI 10‰ 25‰ 50‰ 75‰ 90‰
≥900 40 395 122,967 3.21 2.91-3.55 0 0 2.07 3.83 7.32
700-899 49 396 135,151 2.93 2.66-3.23 0 1.15 2.42 4.04 6.53
400-699 54 300 104,458 2.87 2.56-3.22 0 0 1.96 4.03 6.64
All 143 1,091 362,576 3.01 2.84-3.19 0 0 2.17 4.01 6.64
Ventilator-associated PNEU rate‡ No. of
hospital beds
No. of units
No. of PNEU
Ventilator- days
Pooled
mean 95% CI 10‰ 25‰ 50‰ 75‰ 90‰
≥900 40 129 93,359 1.38 1.16-1.64 0 0 0.70 2.41 4.70
700-899 49 175 102,007 1.72 1.48-1.99 0 0 0.81 2.64 5.74
400-699 54 177 87,106 2.03 1.75-2.35 0 0 0 3.45 7.19
All 143 481 282,472 1.70 1.56-1.86 0 0 0.59 2.87 5.96
*(No. of urinary catheter-associated UTIs/No. of urinary catheter-days)×1,000; †(No. of central line-associated BSIs/No.
of central line-days)×1,000; ‡(No. of ventilator-associated PNEUs/No. of ventilator-days)×1,000.
Abbreviations: UTI, urinary tract infection; BSI, bloodstream infection; PNEU, pneumonia; CI, confidence interval.
vs. 1.38 (95% CI, 1.16-1.64)].
5. 중환자실 유형에 따른 기구일수 감염률과 기구사용률의 비교
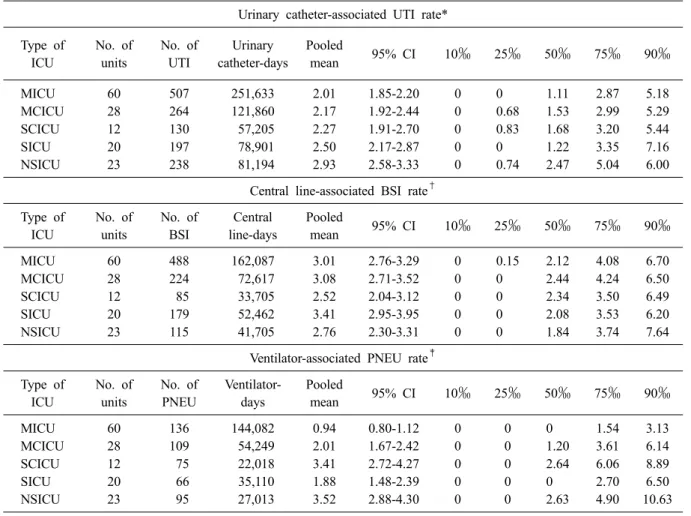
요로카테터 관련 요로감염은 신경외과계 중환자 실에서 다른 유형의 중환자실들에 비해 기구일수 감염률이 가장 높았고(2.93 [95% CI, 2.58-3.33]), 내과계 중환자실에서 가장 낮았다(2.01 [95% CI, 1.85-2.20]). 중심카테터 관련 혈류감염은 통계적 으로 유의한 차이는 없지만 외과계 중환자실에 서 가장 높은 경향을 보였으며(3.41 [95% CI, 2.95-3.95]), 외과계 혼합 중환자실에서 가장 낮은 경향을 보였다(2.52 [95% CI, 2.04-3.12]). 인공호 흡기 관련 폐렴은 신경외과계 중환자실에서 가 장 기구일수 감염률이 높았던 반면(3.52 [95% CI, 2.88-4.30]), 내과계 중환자실에서 가장 낮았다 (0.94 [95% CI, 0.80-1.12]) (Table 5).
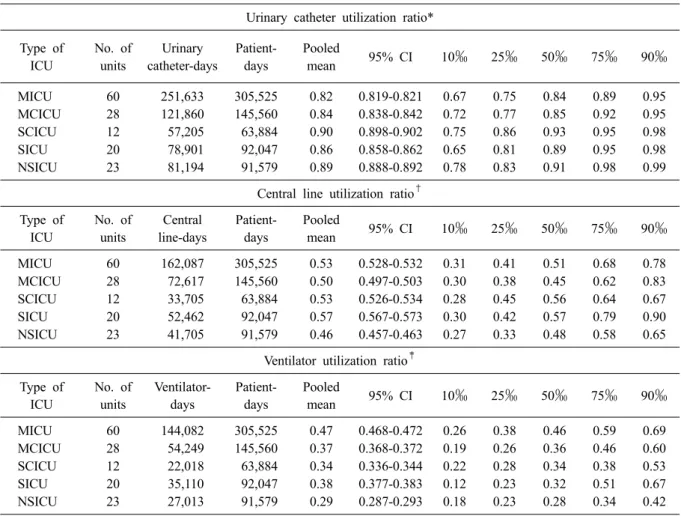
요로카테터 사용률은 내과계 중환자실에서 가
장 낮았으며(0.82 [95% CI, 0.819-0.821]), 외과계 혼합 중환자실에서 가장 높았다(0.90 [95% CI, 0.898-0.902]). 중심정맥관 사용률은 신외과계 중 환자실에서 가장 낮았으며(0.46 [95% CI, 0.457- 0.463]), 외과계 중환자실에서 가장 높았다(0.57 [95% CI, 0.567-0.573]). 인공호흡기 사용률은 신 경외과계 중환자실에서 가장 낮았으며(0.29 [95%
CI, 0.287-0.293]), 내과계 중환자실에서 가장 높 았다(0.47 [95% CI, 0.468-0.472]) (Table 6).
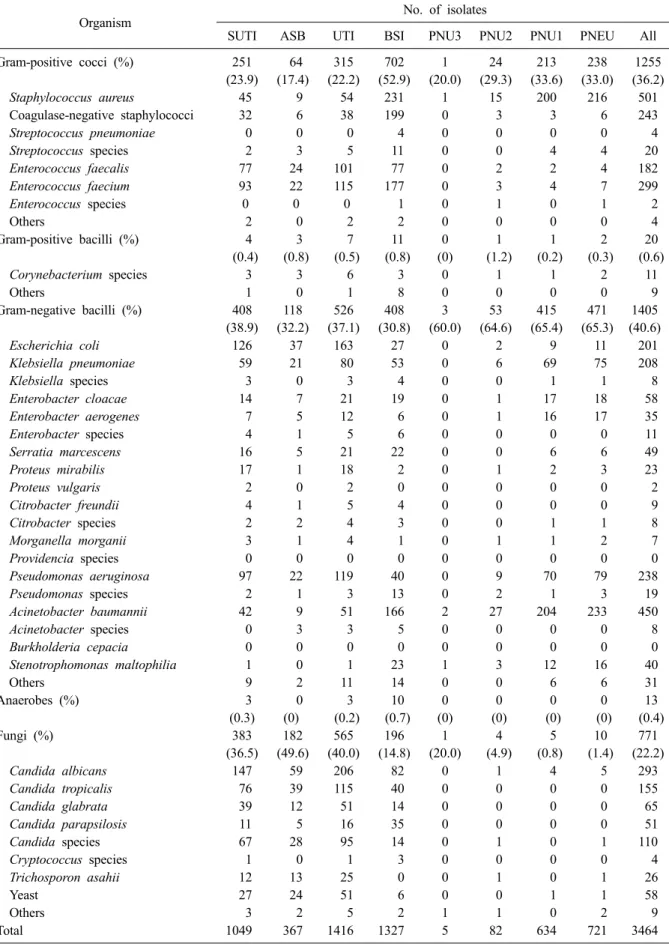
6. 원인미생물의 분포와 주요 미생물의 항생 제 내성률
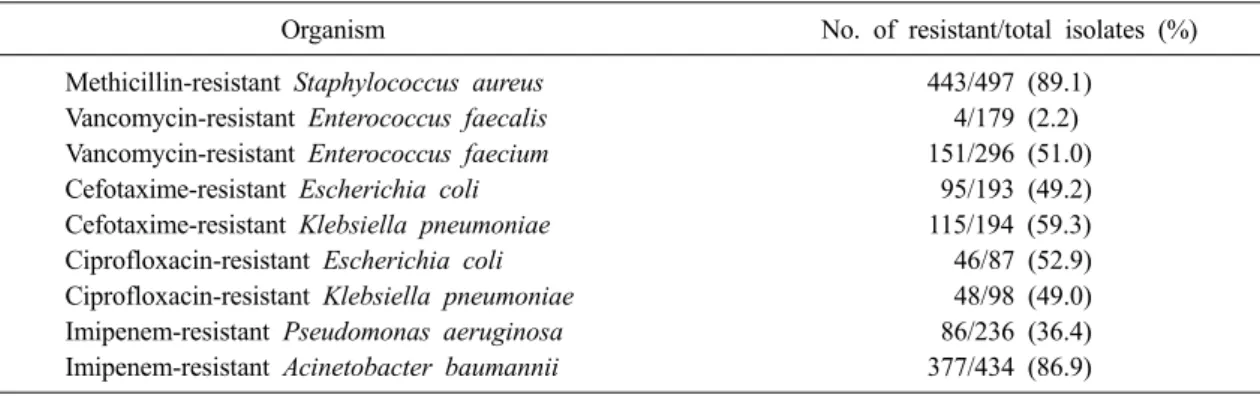
총 3,374건의 감염에서 3,464 균주가 분리되었 고, 감염병에 따른 원인 균주를 표7에 기술하였 다. 한편, 2011년 3분기(7월부터 9월까지)에만 무 증상 세균뇨가 보고되어 이를 Table 7에 기술하 였다. 주요 미생물의 주요 항생제에 대한 내성률은 Table 8에 기술하였다.
Table 4. Pooled means and percentiles of the distribution of device- utilization ratios, by number of hospital beds, July 2011 through June 2012
Urinary catheter utilization ratio*
No. of hospital beds
No. of units
Urinary catheter-days
Patient- days
Pooled
mean 95% CI 10‰ 25‰ 50‰ 75‰ 90‰
≥900 40 170,599 193,650 0.88 0.879-0.881 0.79 0.84 0.89 0.94 0.97
700-899 49 217,707 254,558 0.86 0.859-0.861 0.73 0.79 0.87 0.94 0.98
400-699 54 202,487 250,387 0.81 0.808-0.812 0.66 0.74 0.83 0.90 0.96
All 143 590,793 698,595 0.85 0.849-0.851 0.71 0.78 0.86 0.93 0.97
Central line utilization ratio† No. of
hospital beds
No. of units
Central line-days
Patient- days
Pooled
mean 95% CI 10‰ 25‰ 50‰ 75‰ 90‰
≥900 40 122,967 193,650 0.63 0.628-0.632 0.42 0.50 0.64 0.79 0.90
700-899 49 135,151 254,558 0.53 0.528-0.532 0.33 0.43 0.54 0.66 0.75
400-699 54 104,458 250,387 0.42 0.418-0.422 0.23 0.31 0.42 0.52 0.60
All 143 362,576 698,595 0.52 0.519-0.521 0.30 0.40 0.51 0.65 0.79
Ventilator utilization ratio‡ No. of
hospital beds
No. of units
Ventilator- days
Patient- days
Pooled
mean 95% CI 10‰ 25‰ 50‰ 75‰ 90‰
≥900 40 93,359 193,650 0.48 0.478-0.482 0.24 0.32 0.48 0.63 0.74
700-899 49 102,007 254,558 0.40 0.398-0.402 0.24 0.30 0.37 0.49 0.65
400-699 54 87,106 250,387 0.35 0.348-0.352 0.14 0.23 0.33 0.43 0.54
All 143 282,472 698,595 0.40 0.399-0.401 0.20 0.28 0.38 0.51 0.65
*No. of urinary catheter-days/No. of patient-days; †No. of central line-days/No. of patient-days; ‡No. of ventilator-days/
No. of patient-days.
Abbreviations: UTI, urinary tract infection; BSI, bloodstream infection; PNEU, pneumonia; CI, confidence interval.
7. 2007-2012년도의 기구사용률과 기구일수 감염률 비교
2011년 7월부터 2012년 6월까지의 기구사용률 과 기구일수 병원감염률을 KONIS 전년도 4개년 자료의 감염률과 비교하였다(Table 9).
요로카테터의 기구사용률은 2010년과 2011년 에 증가하였으나 이번 년도에는 유의하게 감소 되었다(0.86 [95% CI, 0.859-0.861], 0.86 [95% CI, 0.859-0.861]) vs. 0.85 [95% CI, 0.849-0.851]).
중심정맥관 기구사용률은 2009년도와 2010년 도에는 증가하였다가 2011년도와 2012년도에는 유의하게 감소하였다[0.56 (95% CI, 0.559-0.561), 0.56 (95% CI, 0.559-0.561) vs. 0.53 (95% CI, 0.529-0.531), 0.52 (95% CI, 0.519-0.521)]. 중심카 테터 사용률이 감소함에 따라 중심카테터 관련 혈류감염의 기구일수 감염률이 통계적으로 유의 하지는 않았지만 감소되는 경향을 보였다.
인공호흡기의 기구사용률은 2009년부터 이전 보다 유의하게 증가되어 2012년도까지 비슷한 수준을 유지하고 있었지만, 인공호흡기 관련 폐 렴의 기구일수 감염률은 감소되는 경향을 보이 고 있다.
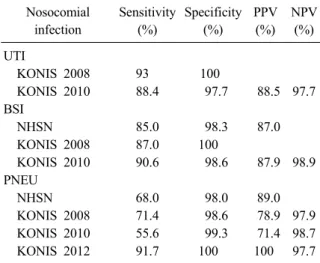
8. 중환자실 병원 감염에 대한 validation 결과 및 미국 자료와 비교
2008년도, 2010년도, 2012년도에 각각 시행된 중환자실 병원 감염 보고에 대한 validation 결과 를 table 10에 기술하였고, 미국 National Health- care Safety Network (NHSN)의 자료와도 비교하 였다.
Discussion
KONIS 중환자실 부문은 2007년 7월부터 연간 자료를 발표하기 시작하였고, 이 결과보고는 다
Table 5. Pooled means and percentiles of the distribution of device- associated infection rates, by type of ICU, July 2011 through June 2012
Urinary catheter-associated UTI rate*
Type of ICU
No. of units
No. of UTI
Urinary catheter-days
Pooled
mean 95% CI 10‰ 25‰ 50‰ 75‰ 90‰
MICU 60 507 251,633 2.01 1.85-2.20 0 0 1.11 2.87 5.18
MCICU 28 264 121,860 2.17 1.92-2.44 0 0.68 1.53 2.99 5.29
SCICU 12 130 57,205 2.27 1.91-2.70 0 0.83 1.68 3.20 5.44
SICU 20 197 78,901 2.50 2.17-2.87 0 0 1.22 3.35 7.16
NSICU 23 238 81,194 2.93 2.58-3.33 0 0.74 2.47 5.04 6.00
Central line-associated BSI rate† Type of
ICU
No. of units
No. of BSI
Central line-days
Pooled
mean 95% CI 10‰ 25‰ 50‰ 75‰ 90‰
MICU 60 488 162,087 3.01 2.76-3.29 0 0.15 2.12 4.08 6.70
MCICU 28 224 72,617 3.08 2.71-3.52 0 0 2.44 4.24 6.50
SCICU 12 85 33,705 2.52 2.04-3.12 0 0 2.34 3.50 6.49
SICU 20 179 52,462 3.41 2.95-3.95 0 0 2.08 3.53 6.20
NSICU 23 115 41,705 2.76 2.30-3.31 0 0 1.84 3.74 7.64
Ventilator-associated PNEU rate‡ Type of
ICU
No. of units
No. of PNEU
Ventilator- days
Pooled
mean 95% CI 10‰ 25‰ 50‰ 75‰ 90‰
MICU 60 136 144,082 0.94 0.80-1.12 0 0 0 1.54 3.13
MCICU 28 109 54,249 2.01 1.67-2.42 0 0 1.20 3.61 6.14
SCICU 12 75 22,018 3.41 2.72-4.27 0 0 2.64 6.06 8.89
SICU 20 66 35,110 1.88 1.48-2.39 0 0 0 2.70 6.50
NSICU 23 95 27,013 3.52 2.88-4.30 0 0 2.63 4.90 10.63
*(No. of urinary catheter-associated UTIs/No. of urinary catheter-days)×1,000; †(No. of central line-associated BSIs/No.
of central line-days)×1,000; ‡(No. of ventilator-associated PNEUs/No. of ventilator-days)×1,000.
Abbreviations: ICU, intensive care unit; MICU, medical ICU; MCICU, medical combined ICU; SCICU, surgical com- bined ICU; SICU, surgical ICU; NSICU, neurosurgical ICU; UTI, urinary tract infection; BSI, bloodstream infection;
PNEU, pneumonia; CI, confidence interval.
섯 번째 연간자료이다. KONIS에서는 2007년 7월 부터는 참여병원에서 각 병원의 사정을 감안하 여 참여를 원하는 분기(3개월 단위)를 스스로 선 택하도록 하였다. 그 결과 4분기에 걸쳐 각각 고 르게 참여하여 안정적인 자료를 생성하게 되었 다. 즉 본 감시체계는 dynamic cohort에 해당하며 이는 최대한 참여병원을 늘리면서도 안정적인 자료를 확보하기 위한 연구방법으로 타 연구에 서도 활용되고 있다[7].
이번 연간 자료를 병실 수 규모로 보았을 때, 900병상 이상의 병원의 수가 21개(25.9%)로 전년 도와 비슷한데 비해 400-699 병상 병원이 28개 (38.9%)에서 34개(42.0%)로 증가하여 중간규모 병원의 참여저변이 확대되었다. 이는 감염관리실
과 감염대책위원회의 활동이 강조되면서 더욱 KONIS 참여동기가 생겼기 때문이라고 판단되며, KONIS가 처음 의도했던 바대로 전국적인 병원 감염의 감시체계로서 자리 잡게 되었음을 의미 하는 것으로 생각된다.
확인된 병원감염은 3,374건으로 요로감염(1,356 건), 혈류감염(1,253건), 폐렴(765건) 순으로 발병 하였는데 이 순위는 최근 몇 년간 결과와 크게 다르지 않다[3,4]. 다만, 요로감염의 보고기준이 바뀌면서 2011년 3분기까지 요로감염에 포함되 었던 무증상 세균뇨가 2011년 4분기부터는 제외 되었기 때문에 이번 연간보고에서 요로감염과 관련된 결과를 해석할 때에는 이를 감안하는 것 이 필요하다[2].
Table 6. Pooled means and percentiles of the distribution of device- utilization ratios, by type of ICU, July 2011 through June 2012
Urinary catheter utilization ratio*
Type of ICU
No. of units
Urinary catheter-days
Patient- days
Pooled
mean 95% CI 10‰ 25‰ 50‰ 75‰ 90‰
MICU 60 251,633 305,525 0.82 0.819-0.821 0.67 0.75 0.84 0.89 0.95
MCICU 28 121,860 145,560 0.84 0.838-0.842 0.72 0.77 0.85 0.92 0.95
SCICU 12 57,205 63,884 0.90 0.898-0.902 0.75 0.86 0.93 0.95 0.98
SICU 20 78,901 92,047 0.86 0.858-0.862 0.65 0.81 0.89 0.95 0.98
NSICU 23 81,194 91,579 0.89 0.888-0.892 0.78 0.83 0.91 0.98 0.99
Central line utilization ratio† Type of
ICU
No. of units
Central line-days
Patient- days
Pooled
mean 95% CI 10‰ 25‰ 50‰ 75‰ 90‰
MICU 60 162,087 305,525 0.53 0.528-0.532 0.31 0.41 0.51 0.68 0.78
MCICU 28 72,617 145,560 0.50 0.497-0.503 0.30 0.38 0.45 0.62 0.83
SCICU 12 33,705 63,884 0.53 0.526-0.534 0.28 0.45 0.56 0.64 0.67
SICU 20 52,462 92,047 0.57 0.567-0.573 0.30 0.42 0.57 0.79 0.90
NSICU 23 41,705 91,579 0.46 0.457-0.463 0.27 0.33 0.48 0.58 0.65
Ventilator utilization ratio‡ Type of
ICU
No. of units
Ventilator- days
Patient- days
Pooled
mean 95% CI 10‰ 25‰ 50‰ 75‰ 90‰
MICU 60 144,082 305,525 0.47 0.468-0.472 0.26 0.38 0.46 0.59 0.69
MCICU 28 54,249 145,560 0.37 0.368-0.372 0.19 0.26 0.36 0.46 0.60
SCICU 12 22,018 63,884 0.34 0.336-0.344 0.22 0.28 0.34 0.38 0.53
SICU 20 35,110 92,047 0.38 0.377-0.383 0.12 0.23 0.32 0.51 0.67
NSICU 23 27,013 91,579 0.29 0.287-0.293 0.18 0.23 0.28 0.34 0.42
*No. of urinary catheter-days/No. of patient-days; †No. of central line-days/No. of patient-days; ‡No. of ventilator-days/
No. of patient-days.
Abbreviations: ICU, intensive care unit; MICU, medical ICU; MCICU, medical combined ICU; SCICU, surgical com- bined ICU; SICU, surgical ICU; NSICU, neurosurgical ICU; UTI, urinary tract infection; BSI, bloodstream infection;
PNEU, pneumonia; CI, confidence interval.
병상규모가 큰 병원으로 갈수록 요로카테터, 중심정맥관, 인공호흡기의 기구사용률이 의미있 게 더 높았는데(Table 4), 이러한 양상은 이전 KONIS 자료부터 일관되 나타나고 있으며[4-6]
병상규모가 클수록 중한 환자가 많고 그 만큼 침 습적인 기구의 사용이 많음을 보여준다. 그러나, 전년도의 결과와 유사하게 기구일수 감염률은 400-699병상의 병원이 700-899병상, 900병상 이 상 병원보다 더 높은 경향을 보였다[4]. 이러한 결과는 700 병상 미만의 중소 규모 병원 중환자 실 감염 관리에 대한 지원이 더욱 필요함을 보여 준다. 다른 원인으로는 700 병상 이상의 대규모 병원에서 상대적으로 감시의 민감도가 떨어질 가능성을 고려하는 것도 필요하다. 이러한 가능
성을 줄이기 위해 KONIS는 2년 마다 감시의 적 정성을 평가하여 보고하고 있는데, 현재까지 3회 실시한 폐렴 보고에 대한 적정성 평가는 미국의 수준과 크게 다르지 않았다[8].
중심정맥관 사용률이 2010년도에 비해 2011년 도와 2012년도에 유의하게 감소한 반면, 동 기간 의 중심카테터 관련 혈류감염의 기구일수 감염 률은 통계적으로 유의한 차이는 없었다[3,4]. 미 국 NHSN 자료와 비교하였을 때 중심정맥관 사 용률은 비슷한 수준이지만, 중심카테터 관련 혈 류감염의 기구일수 감염률은 높은 결과를 보여, 시술자 교육, 최대멸균차단법(Maximal barrier pre- caution), 클로르헥시딘-알코올 팅크 사용 등 미국 질병통제센터의 다양한 권고사항을 준수하려는
Table 7. Number (%) of microorganisms isolated from clinical specimens of patients with nosocomial infections
Organism No. of isolates
SUTI ASB UTI BSI PNU3 PNU2 PNU1 PNEU All
Gram-positive cocci (%) 251
(23.9) 64 (17.4)
315 (22.2)
702 (52.9)
1 (20.0)
24 (29.3)
213 (33.6)
238 (33.0)
1255 (36.2)
Staphylococcus aureus 45 9 54 231 1 15 200 216 501
Coagulase-negative staphylococci 32 6 38 199 0 3 3 6 243
Streptococcus pneumoniae 0 0 0 4 0 0 0 0 4
Streptococcus species 2 3 5 11 0 0 4 4 20
Enterococcus faecalis 77 24 101 77 0 2 2 4 182
Enterococcus faecium 93 22 115 177 0 3 4 7 299
Enterococcus species 0 0 0 1 0 1 0 1 2
Others 2 0 2 2 0 0 0 0 4
Gram-positive bacilli (%) 4
(0.4) 3 (0.8)
7 (0.5)
11 (0.8)
0 (0)
1 (1.2)
1 (0.2)
2 (0.3)
20 (0.6)
Corynebacterium species 3 3 6 3 0 1 1 2 11
Others 1 0 1 8 0 0 0 0 9
Gram-negative bacilli (%) 408 (38.9)
118 (32.2)
526 (37.1)
408 (30.8)
3 (60.0)
53 (64.6)
415 (65.4)
471 (65.3)
1405 (40.6)
Escherichia coli 126 37 163 27 0 2 9 11 201
Klebsiella pneumoniae 59 21 80 53 0 6 69 75 208
Klebsiella species 3 0 3 4 0 0 1 1 8
Enterobacter cloacae 14 7 21 19 0 1 17 18 58
Enterobacter aerogenes 7 5 12 6 0 1 16 17 35
Enterobacter species 4 1 5 6 0 0 0 0 11
Serratia marcescens 16 5 21 22 0 0 6 6 49
Proteus mirabilis 17 1 18 2 0 1 2 3 23
Proteus vulgaris 2 0 2 0 0 0 0 0 2
Citrobacter freundii 4 1 5 4 0 0 0 0 9
Citrobacter species 2 2 4 3 0 0 1 1 8
Morganella morganii 3 1 4 1 0 1 1 2 7
Providencia species 0 0 0 0 0 0 0 0 0
Pseudomonas aeruginosa 97 22 119 40 0 9 70 79 238
Pseudomonas species 2 1 3 13 0 2 1 3 19
Acinetobacter baumannii 42 9 51 166 2 27 204 233 450
Acinetobacter species 0 3 3 5 0 0 0 0 8
Burkholderia cepacia 0 0 0 0 0 0 0 0 0
Stenotrophomonas maltophilia 1 0 1 23 1 3 12 16 40
Others 9 2 11 14 0 0 6 6 31
Anaerobes (%) 3
(0.3) 0 (0)
3 (0.2)
10 (0.7)
0 (0)
0 (0)
0 (0)
0 (0)
13 (0.4)
Fungi (%) 383
(36.5) 182 (49.6)
565 (40.0)
196 (14.8)
1 (20.0)
4 (4.9)
5 (0.8)
10 (1.4)
771 (22.2)
Candida albicans 147 59 206 82 0 1 4 5 293
Candida tropicalis 76 39 115 40 0 0 0 0 155
Candida glabrata 39 12 51 14 0 0 0 0 65
Candida parapsilosis 11 5 16 35 0 0 0 0 51
Candida species 67 28 95 14 0 1 0 1 110
Cryptococcus species 1 0 1 3 0 0 0 0 4
Trichosporon asahii 12 13 25 0 0 1 0 1 26
Yeast 27 24 51 6 0 0 1 1 58
Others 3 2 5 2 1 1 0 2 9
Total 1049 367 1416 1327 5 82 634 721 3464
Table 8. Susceptibilities of major pathogens isolated from patients with nosocomial infections
Organism No. of resistant/total isolates (%)
Methicillin-resistant Staphylococcus aureus 443/497 (89.1) Vancomycin-resistant Enterococcus faecalis 4/179 (2.2) Vancomycin-resistant Enterococcus faecium 151/296 (51.0)
Cefotaxime-resistant Escherichia coli 95/193 (49.2)
Cefotaxime-resistant Klebsiella pneumoniae 115/194 (59.3)
Ciprofloxacin-resistant Escherichia coli 46/87 (52.9)
Ciprofloxacin-resistant Klebsiella pneumoniae 48/98 (49.0) Imipenem-resistant Pseudomonas aeruginosa 86/236 (36.4) Imipenem-resistant Acinetobacter baumannii 377/434 (86.9)
Table 9. Comparison of the device utilization ratios and the rates of device-associated infections from 2007 through 2012
Parameter July 2007
-June 2008
July 2008 -June 2009
July 2009 -June 2010
July 2010 -June 2011
July 2011 -June 2012
No. of hospitals 56 57 63 72 81
No. of units 96 101 116 130 143
Patient-days 367,352 435,035 518,620 585,325 698,595
Device-days
Urinary catheter-days 308,279 369,476 446,612 503,365 590,793
Central line-days 199,169 243,882 289,380 309,500 362,576
Ventilator-days 143,475 179,803 209,858 233,640 282,472
No. of infections
Urinary catheter-associated UTI 1,365 1,772 2,119 1,949 1,366
Central line-associated BSI 563 797 948 932 1,091
Ventilator-associated PNEU 357 335 410 410 481
Device utilization ratio (95% CI) [range*]
Urinary catheter 0.84
(0.839-0.841) [0.70-0.96]
0.85 (0.849-0.851)
[0.71-0.96]
0.86 (0.859-0.861)
[0.73-0.96]
0.86 (0.859-0.861)
[0.73-0.97]
0.85 (0.849-0.851)
[0.71-0.97]
Central line 0.54
(0.538-0.542) [0.33-0.85]
0.56 (0.559-0.561)
[0.35-0.83]
0.56 (0.559-0.561)
[0.35-0.82]
0.53 (0.529-0.531)
[0.31-0.81]
0.52 (0.519-0.521)
[0.30-0.79]
Ventilator 0.39
(0.388-0.392) [0.21-0.63]
0.41 (0.409-0.411)
[0.21-0.64]
0.41 (0.409-0.411)
[0.19-0.62]
0.40 (0.399-0.401)
[0.19-0.61]
0.40 (0.399-0.401)
[0.20-0.65]
Rate per 1,000 device-days (95% CI) [range*]
Urinary catheter-associated UTI 4.43 (4.20-4.67) [1.10-7.49]
4.80 (4.58-5.03) [1.08-8.13]
4.75 (4.55-4.95) [1.14-8.40]
3.87 (3.70-4.05)
[0-8.80]
2.26 (2.14-2.39)
[0-5.61]
Central line-associated BSI 2.83
(2.61-3.07) [0-6.34]
3.27 (3.05-3.51) [0.73-5.84]
3.28 (3.07-3.49) [0.68-5.61]
3.01 (2.82-3.21)
[0-6.92]
3.01 (2.84-3.19)
[0-6.64]
Ventilator-associated PNEU 2.49
(2.25-2.76) [0-10.31]
1.86 (1.67-2.07)
[0-4.75]
1.95 1.77-2.15
[0-6.33]
1.75 1.59-1.93
[0-5.88]
1.70 1.56-1.86
[0-5.96]
Abbreviations: ICU, intensive care unit; UTI, urinary tract infection; BSI, bloodstream infection; PNEU, pneumonia; CI, confidence interval.
*10th to 90th percentile range.
Table 10. Comparison of the results of validation studies of Korean Nosocomial Infections Surveillance System (KONIS) with those of National Healthcare Safety Network (NHSN)
Nosocomial infection
Sensitivity (%)
Specificity (%)
PPV (%)
NPV (%) UTI
KONIS 2008 93 100
KONIS 2010 88.4 97.7 88.5 97.7 BSI
NHSN 85.0 98.3 87.0
KONIS 2008 87.0 100
KONIS 2010 90.6 98.6 87.9 98.9
PNEU
NHSN 68.0 98.0 89.0
KONIS 2008 71.4 98.6 78.9 97.9
KONIS 2010 55.6 99.3 71.4 98.7
KONIS 2012 91.7 100 100 97.7
Abbreviations: UTI, urinary tract infection; BSI, blood- stream infection; PNEU, pneumonia; PPV, positive pre- dictive value; NPV, negative predictive value.
의료진의 노력이 필요하겠고, 이러한 노력에도 감 염률이 감소되지 않는 경우 은이나 클로르헥시딘 이 코팅된 중심정맥 카테터 사용에 대한 요양 급여 적용 같은 지원도 필요할 것으로 생각된다[9-11].
분리된 세균들의 항생제 내성률은 비교해보았 을 때, 대장균의 3세대 세팔로스포린 항생제와 퀴놀론 제제에 대한 내성률은 전년도보다 증가 된 경향을 보였다. Enterococcus faecium균의 반코 마이신 내성률은 전년도의 38%에서 이번 년도에 는 51%로 크게 상승하였다. 한편, 폐렴간균의 퀴 놀론제제에 대한 내성률은 전년도보다 감소하였 다. 이번 년도는 분리된 균주의 상당한 부분을 차지하는 무증상 세균뇨가 1/4분기까지만 보고되 었기 때문에 이전의 보고와 직접 비교에 어려움 이 있으나, 전반적으로 항생제 내성률이 높은 상 태가 유지되고 있기 때문에 이에 대한 다각적인 대책 마련이 필요할 것으로 생각된다.
KONIS 연구 자료는 병원감염을 예방하는 책 임이 있는 감염관리 전담자가 스스로 자발적인 감시체계를 통해서 환자의 안전을 위한 감염관 리 중재활동의 효과를 판정할 수 있는 지표로 사 용되도록 최적화되었다. 참여병원은 매 분기, 혹 은 달마다 특정 감염률의 추이를 비교할 수 있을 뿐 아니라 같은 규모 전국 KONIS참여병원 평균
값과 비교할 수 있으므로 문제가 되는 감염증가 에 대한 대책을 마련하고 감소시키기 위한 개선 감염관리 활동을 중재할 수 있을 것이다. 또한 참여병원에 감염관리에서 중요한 유행이나 사고, 분쟁이 발생하였을 경우, 평소 감염관리 활동을 성실하게 해온 것을 KONIS활동을 근거로 판단 할 수 있다. 그러나, 규모만 동일하다고 하여 환 자군의 특성 차이가 나는 병원들을 산술적으로 비교하여 서열화하지 않도록 주의하는 것이 필 요하다. 이는 같은 모집단에 속하지 않은 서로 다른 군에서 나온 자료인 관계로 감염 증례의 절 대값이나 감염률을 비교할 수 없기 때문이다.
결론적으로, 항생제 내성률과 감염발생을 줄이 기 위한 지속적인 노력과 지원이 필요하며, 자발 적이고 적극적인 감염 발생 감시 체계를 유지하 기 위해 연구의 목적과 연구자들이 동의한 수준 에 맞는 자료 활용을 지속해야 되겠다.
Summary
배경: 전국병원감염감시체계(Korean Nosocomial Infections Surveillance System, KONIS) 중환자실 부문에서 2011년 7월부터 2012년 6월까지 감시를 수행한 다섯 번째 연간 자료를 보고한다.
방법: 전국에 있는 81개 병원의 143개 중환자 실에서 발생한 원내 요로 감염, 혈류 감염 및 폐 렴에 대한 감시를 전향적으로 실시하였다. 병원 감염률은 1,000 재원일수 또는 기구일수 당 감염 건수로 구하였다. 2011년 10월 1일 이후부터 무 증상 세균뇨는 보고에서 제외되었다.
결과: 조사 기간 동안 총 3,374 건의 병원 감염 이 발생하였는데 요로 감염 1,356건, 혈류 감염 1,253건, 폐렴 765건이었다. 요로 카테터 관련 요 로 감염(CAUTIs)은 1,000 기구일 당 2,26건(95%
신뢰 구간, 2.14-2.39), 요로 카테터 사용률은 0.85 (95% 신뢰 구간, 0.84-0.851)였다. 중심정맥관 관 련 혈류 감염은 3.01 (2.84-3.19)이었고, 이용률은 0.52 (0.519-0.521)였다. 인공 호흡기 관련 폐렴의 비율은 1.70 (1.56-1.86)이었고, 이용률은 0.40 (0.399-0.401)였다. 인공 호흡기와 요 카테터 사용 률은 400-699 병상 규모 병원의 중환자실에서 더 낮았지만, 인공 호흡기 관련 폐렴과 요로 카테터
관련 요로감염은 이들 병원에서 더 많았다.
결론: 병원 감염 비율은 지난해 조사 결과와 비슷했다. 검증 된 감염 통제 전략의 구현이 지 속되어야 하겠고, 특히 중소규모 병원 중환자실 에 대한 지원이 필요하겠다.
Acknowledgements
전국병원감염감시체계 중환자실 부문에 참여해 주신 모든 참여병원 연구자 분들께 감사드립니다.
References
1. Korean Society for Nosocomial Infection Control.
Korean Nosocomial Infections Surveillance Manual 2008. 2nd ed, Seoul; Gold 2008: 1-132.
2. Korean Society for Nosocomial Infection Control.
Korean Nosocomial Infections Surveillance Manual 2010. 4th ed, Seoul; Gold 2012.
3. Lee SO, Kim ES, Kim HY, Park ES, Jin HY, Ki HK, et al; Korean Nosocomial Infections Surveillance System (KONIS). Korean nosoco- mial infections surveillance system, intensive care unit module report: data summary from July 2007 through June 2008. Korean J Noso- comial Infect Control 2008;13:69-82.
4. Jeon MH, Park WB, Kim SR, Chun HK, Han SH, Bang JH, et al. Korean nosocomial in- fections surveillance system, intensive care unit module report: data summary from July 2010 through June 2011. Korean J Nosocomial Infect Control 2012;17:28-39.
5. Kwak YG, Cho YK, Kim JY, Lee MS, Kim HY, Kim YK, et al; Korean Nosocomial Infections Surveillance System (KONIS). Korean Nosocomial Infections Surveillance System,
Intensive Care Unit Module Report: Data Summary from July 2009 through June 2010.
Korean J Nosocomial Infect Control 2011;16:
1-12.
6. Kwak YG, Cho YK, Kim JY, Lee SO, Kim HY, Kim YK, et al. Korean nosocomial in- fections surveillance system, intensive care unit module report: data summary from July 2008 through June 2009 and Analysis of 3-Year Results. Korean J Nosocomial Infect Control 2010;15:14-25.
7. Williamson JM, Satten GA, Hanson JA, Weinstock H, Datta S. Analysis of dynamic co- hort data. Am J Epidemiol 2001;154:366-72.
8. Klompas M and Yokoe DS. Automated surveil- lance of health care-associated infections. Clin Infect Dis 2009;48:1268-75.
9. Dudeck MA, Horan TC, Peterson KD, Allen- Bridson K, Morrell G, Pollock DA, et al.
National Healthcare Safety Network (NHSN) Report, data summary for 2010, device-asso- ciated module. Am J Infect Control 2011;39:
798-816.
10. Edwards JR, Peterson KD, Mu Y, Banerjee S, Allen-Bridson K, Morrell G, et al. National Healthcare Safety Network (NHSN) report: data summary for 2006 through 2008, issued December 2009. Am J Infect Control 2009;37:
783-805.
11. O'Grady NP, Alexander M, Burns LA, Dellinger EP, Garland J, Heard SO, et al; Healthcare Infection Control Practices Advisory Committee (HICPAC). Guidelines for the prevention of in- travascular catheter-related infections. Clin Infect Dis 2011;52:e162-93.