ISSN 2234-3806 • eISSN 2234-3814
https://doi.org/10.3343/alm.2019.39.2.200
Cluster Containing More Than 20 CD3-Positive Cells in Bone Marrow Biopsy Is a Candidate Prognostic
Indicator in Peripheral T-Cell Lymphoma, Not Otherwise Specified
Hyoeun Shim, M.D.1, Seongsoo Jang, M.D.2, Jooryung Huh, M.D.3, Dok Hyun Yoon, M.D.4, Cheolwon Suh, M.D.4, and Chan-Jeoung Park , M.D.2
1Department of Laboratory Medicine, National Cancer Center, Goyang, Korea; Departments of 2Laboratory Medicine, 3Pathology and 4Oncology, University of Ulsan College of Medicine and Asan Medical Center, Seoul, Korea
Assessment of bone marrow (BM) involvement in peripheral T-cell lymphoma, not other- wise specified (PTCL) is straightforward in cases of extensive involvement but difficult in cases of minimal to partial involvement. We evaluated the usefulness of CD3 as an immu- nohistochemical marker for assessing BM involvement in PTCL patients. BM biopsies of 92 PTCL patients were immunohistochemically stained for CD3, CD4, CD8, CD20, and CD56, and evaluated by two hematopathologists. CD3 positivity was graded according to the proportion of CD3-positive cells and the number of CD3-positive cells in a cluster. These criteria were used to determine the cut-offs at which significant differences in progression- free survival (PFS) and overall survival (OS) were observed. Multivariate analysis control- ling the International Prognostic Index (IPI) score and its individual factors revealed that
>20 CD3-positive cells in a cluster adversely affected PFS (relative risk [RR], 2.1; 95%
confidence interval [CI], 1.0–4.3; P =0.047) and OS (RR, 2.4; 95% CI, 1.1–5.1; P =0.028) independent of IPI score. A cluster with >20 CD3-positive cells is a candidate indicator for BM involvement in PTCL.
Key Words: Peripheral T-cell lymphoma, Bone marrow involvement, CD3 positivity
Received: February 25, 2018 Revision received: May 1, 2018 Accepted: September 27, 2018 Corresponding author:
Chan-Jeoung Park, M.D.
https://orcid.org/0000-0003-4396-8348 Department of Laboratory Medicine, University of Ulsan College of Medicine and Asan Medical Center, 86 Asanbyeongwon- gil, Songpa-gu, Seoul 05505, Korea Tel: +82-2-3010-4508
Fax: +82-2-478-0884 E-mail: [email protected]
© Korean Society for Laboratory Medicine This is an Open Access article distributed under the terms of the Creative Commons Attribution Non-Commercial License (http://creativecom- mons.org/licenses/by-nc/4.0) which permits unrestricted non-commercial use, distribution, and reproduction in any medium, provided the original work is properly cited.
Peripheral T-cell lymphomas, not otherwise specified (PTCLs) represent approximately 10% of all non-Hodgkin lymphomas [1]. They are aggressive diseases with various degrees of bone marrow (BM) infiltration. Overall, one-third of PTCL cases show evidence of BM infiltration, which can be best identified in biop- sies rather than on aspirates [2-5]. BM examination is routinely performed in PTCL patients to assess the extent and stage of the disease. CD3 is a pan-T-cell related marker expressed both in reactive and neoplastic T-cells. BM involvement is easily diag- nosed when the involvement is extensive but is more difficult
when the neoplastic cells show an interstitial pattern or in cases of a minimal amount of involvement. Moreover, a variety of reac- tive T-cell proliferations frequently show histological features re- sembling malignant processes [6]. We evaluated CD3 as an im- munohistochemical marker for assessing the extent of BM in- volvement in PTCL patients and its prognostic impact, and pro- vided a diagnostic guideline for assessing BM involvement in PTCL.
We retrospectively reviewed the electronic medical records of patients diagnosed as having PTCL in Asan Medical Center,
2017-03-16 https://crossmark-cdn.crossref.org/widget/v2.0/logos/CROSSMARK_Color_square.svg
Seoul, Korea, between July 1998 and December 2011, and 92 patients met the following inclusion criteria: (i) confirmed diag- nosis of PTCL on pathology review, (ii) BM evaluation (right and left sides) for staging work-up performed at diagnosis, (iii) BM blocks available for additional immunohistochemical analysis, and (iv) treatment with cyclophosphamide, doxorubicin, vincris- tine, and prednisone (CHOP) combination chemotherapy. All patients were staged according to the Ann Arbor system [7], performance status was assigned according to the Eastern Co- operative Oncology Group (ECOG) scale [8], and the Interna- tional Prognostic Index (IPI) score (with the factors age, perfor- mance status, lactate dehydrogenase level, BM involvement) was calculated as previously described [9] (Table 1). The study was approved by the Institutional Review Board of Asan Medical Center (AMC IRB 2012-0084), which is officially accredited by the Forum for Ethical Review Committees in Asia and the West- ern Pacific.
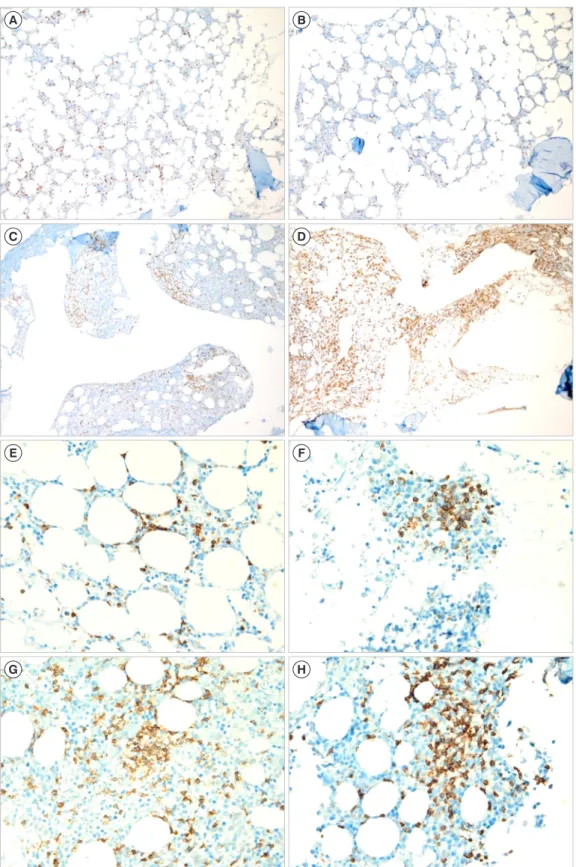
BM involvement was confirmed by immunohistochemical anal- ysis using monoclonal antibodies specific for CD3 and CD8 (DAKO, Glostrup, Denmark), CD4 and CD20 (NovoCastra, Newcastle, UK), and CD56 (Zymed, Carlsbad, CA, USA), following routine protocols for automated immunohistochemistry on the Ventana Benchmark XT system (Ventana Medical Systems, Tucson, AZ, USA). Two hematopathologists reviewed BM biopsies and graded the staining positivity semi-quantitatively. The proportion of CD3 positivity was graded as 0–10%, 10–25%, 25–50%, 50–75%, and 75–100%, and the number of CD3-positive cells in a clus- ter was graded as <10, 10–20, 20–30, 30–40, and >40 cells (Fig. 1). In cases showing discrepancy between the right and left sides of BM biopsies, the results with higher grades were used.
The proportion of CD3-positive cells and the number of CD3- positive cells in a cluster were evaluated to determine the cut-off points at which a significant difference in progression-free sur- vival (PFS) and overall survival (OS) was observed. PFS was de-
fined as the time between the first pathological diagnosis and time of relapse, disease progression, or death from any cause.
OS was defined as the time from diagnosis until death from any cause. To compare clinical characteristics between the groups assigned based on the proportion of CD3-positive cells and the number of CD3-positive cells, we used an independent t-test for continuous variables and the χ2 test for categorical variables.
The Kaplan-Meier method was used to assess PFS and OS, and the log-rank test was used for comparison between groups (Fig.
2). The Cox proportional hazards model was used for multivari- ate analysis to determine independent predictors of PFS and OS. A receiver operating characteristic (ROC) curve was con- structed to calculate the area under curve (AUC) for prediction of BM involvement. All statistical analyses were performed using SPSS version 18.0 for Windows (SPSS Inc., Chicago, IL, USA).
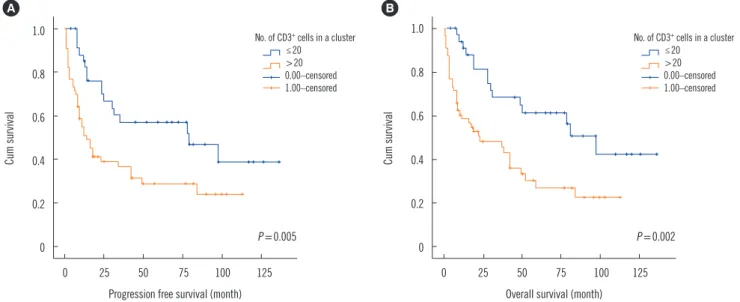
Univariate analysis showed that overall, a CD3-positive cell frequency >25% was associated with a borderline significant difference in PFS and OS compared with a CD3-positive cell frequency below or equal to 25% (P =0.132 and P =0.064, re- spectively). Having >20 CD3-positive cells in a cluster adversely affected PFS and OS (P =0.005 and 0.002, respectively); thus, the cut-off point for the number of CD3-positive cells in a cluster was 20. The median follow-up duration was 3.5 years, and the 5-year OS for the group with ≤20 CD3-positive cells in a cluster group was 56%, but only 27% for the group with >20 CD3- positive cells in a cluster. The 3-year OS was 65% and 46%, re- spectively, and the corresponding 3-year PFS was 57% and 32%, respectively.
Multivariate analysis confirmed that >20 CD3-positive cells in a cluster adversely affected PFS and OS, independent of the IPI score. However, when the five individual IPI factors were con- trolled, >20 CD3-positive cells in a cluster adversely affected only OS and had a borderline significant effect on PFS (Table 2).
BM involvement was reported in the initial BM reports for 32 of the 92 patients (34.8%), represented by the paratrabecular involvement and/or the partial or complete effacement of BM space with neoplasm. The AUC of >20 CD3-positive cells in a cluster for agreement with the initial report of BM involvement was 0.686 (95% CI: 0.560–0.813).
Cut-off points for the proportion of positive cells and the num- ber of positive cells in a cluster for CD4 and CD8 were not ob- tained. In the Kaplan-Meier analysis, >10% positivity of CD20 was associated with poorer OS (P =0.024). However, in the mul- tivariate analysis, the proportion of CD20-positive cells was not significantly associated with PFS or OS. CD56 was negative in all cases.
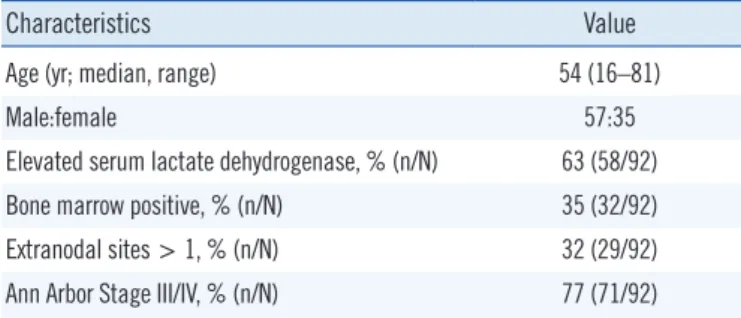
Table 1. Clinical features of patients with peripheral T-cell lympho- ma, not otherwise specified
Characteristics Value
Age (yr; median, range) 54 (16–81)
Male:female 57:35
Elevated serum lactate dehydrogenase, % (n/N) 63 (58/92)
Bone marrow positive, % (n/N) 35 (32/92)
Extranodal sites > 1, % (n/N) 32 (29/92) Ann Arbor Stage III/IV, % (n/N) 77 (71/92)
Fig. 1. Representative examples of bone marrow biopsies with various proportions of CD3 positivity in patients with peripheral T-cell lym- phoma, not otherwise specified (CD3 immunohistochemical stain, ×100): (A) 10–25%, (B) 26–50%, (C) 51−75%, and (D) 76–100%, and various numbers of CD3-positive cells in a cluster in patients with peripheral T-cell lymphoma, not otherwise specified (CD3 immunohisto- chemical stain, ×400): (E) <10 cells in a cluster, (F) 21–30 cells, (G) 31–40 cells, and (H) >40 cells.
A B
C D
E F
G H
Table 2. Cox proportional hazards analysis of predictors of PFS and OS in peripheral T-cell lymphoma, not otherwise specified
Variable PFS OS
RR 95% CI P RR 95% CI P
CD3 positivity and IPI score
CD3-positive proportion > 25% 0.6 0.3–1.3 0.209 0.6 0.3–1.4 0.292
CD3-positive cells in a cluster > 20 cells 2.1 1.0–4.3 0.047 2.4 1.1–5.1 0.028
IPI score (0–5) 2.8 1.1–10.3 0.005 3.3 1.0–11.2 0.009
CD3 positivity and individual IPI factors
CD3 positive proportion > 25% 0.7 0.4–1.5 0.384 0.8 0.4–1.6 0.543
CD3 positive cells in a cluster > 20 cells 2.0 1.0–1.3 0.059 2.5 1.1–5.5 0.024
Age >60 years 2.0 1.1–3.5 0.021 2.7 1.5–4.9 0.002
Stage III/IV 2.5 1.1–6.3 0.046 2.7 1.0–7.2 0.051
LD >ULN 1.7 0.9–3.1 0.100 1.7 0.9–3.4 0.100
ECOG PS ≥2 2.6 0.3–23.0 0.381 3.6 0.4–32.4 0.258
Extranodal sites >1 1.5 0.8–2.8 0.163 1.3 0.7–2.5 0.339
Abbreviations: IPI, International Prognostic Index; RR, relative risk; CI, confidence interval; LD, lactate dehydrogenase; ULN, upper limit of normal; ECOG PS, Eastern Cooperative Oncology Group performance status; PFS, progression-free survival; OS, overall survival.
Fig. 2. Kaplan-Meier survival graph showing statistically significant difference in (A) progression free survival and (B) overall survival be- tween >20 and ≤20 CD3+ cells in a cluster.
1.0
0.8
0.6
0.4
0.2
0
0 25 50 75 100 125 Progression free survival (month)
Cum survival
P =0.005 A
No. of CD3+ cells in a cluster ≤20
>20 0.00–censored 1.00–censored
1.0
0.8
0.6
0.4
0.2
0
0 25 50 75 100 125 Overall survival (month)
Cum survival
P =0.002 B
No. of CD3+ cells in a cluster ≤20
>20 0.00–censored 1.00–censored
BM involvement has particular clinical significance in PTCL compared with other malignant lymphomas. Galliamini et al.
[10] proposed a new prognostic index of T-cell lymphoma that incorporated three factors of the IPI: age >60 years, Eastern Cooperative Oncology Group (ECOG) performance status ≥2, and elevated serum lactate dehydrogenase, as well as BM in- volvement. Evaluation of BM involvement is therefore critical for assessing stage and predicting the clinical course of PTCL. This evaluation may be difficult when the neoplastic cells are infil-
trated in an interstitial pattern, and the secondary changes in the BM microenvironment may obscure the neoplastic infiltrate [11, 12]. Moreover, the individual cells of BM-involved PTCL display small to medium-sized lymphocytes compared with the large cells seen in Hodgkin’s lymphoma or diffuse large B cell lymphoma. Therefore, the staining pattern and formation of lym- phocytic aggregates are valuable factors in the assessment of BM involvement in PTCL.
Various pathological factors have been assessed for applica-
tion as prognostic indexes in PTCL, including the Ki-67 prolifer- ation index, number of Epstein-Barr virus-positive B cells, and CD56 and CD30 expression [13]. In our study, the IPI score was a significant predictor of OS and PFS, with age and stage of PTCL emerging as the strongest predictors among the IPI prognostic factors (Table 1). Although univariate analysis showed that the proportion of CD3 positivity was an adverse prognostic factor, in the multivariate analysis, only the number of CD3-positive cells in a cluster emerged as an independent predictor of survival af- ter the IPI factors were controlled. We propose >20 CD3-posi- tive cells in a BM biopsy cluster as a candidate indicator for BM involvement in PTCL.
Authors’ Disclosures of Potential Conflicts of Interest
The authors have no conflict of interest to declare.
REFERENCES
1. Savage KJ. Update: peripheral T-cell lymphomas. Curr Hematol Malig Rep 2011;6:222-30.
2. Delmer A, Caulet S, Bryard F, Tabah I, Audouin J, Le Tourneau A, et al.
Peripheral T-cell malignant lymphomas. Clinical, morphologic and de- velopmental features in 22 cases [Article in French]. Presse Med 1990;
19:851-5.
3. Chott A, Augustin I, Wrba F, Hanak H, Ohlinger W, Radaszkiewicz T.
Peripheral T-cell lymphomas: a clinicopathologic study of 75 cases. Hum Pathol 1990;21:1117-25.
4. Gisselbrecht C, Gaulard P, Lepage E, Coiffier B, Brière J, Haioun C, et al. Prognostic significance of T-cell phenotype in aggressive non-Hodg- kin’s lymphomas. Groupe d’Etudes des Lymphomes de l’Adulte (GELA).
Blood 1998;92:76-82.
5. López-Guillermo A, Cid J, Salar A, López A, Montalbán C, Castrillo JM, et al. Peripheral T-cell lymphomas: initial features, natural history, and prognostic factors in a series of 174 patients diagnosed according to the R.E.A.L. Classification. Ann Oncol 1998;9:849-55.
6. Dogan A and Morice WG. Bone marrow histopathology in peripheral T- cell lymphomas. Br J Haematol 2004;127:140-54.
7. Carbone PP, Kaplan HS, Musshoff K, Smithers DW, Tubiana M. Report of the committee on Hodgkin’s disease staging classification. Cancer Res 1971;31:1860-1.
8. Oken MM, Creech RH, Tormey DC, Horton J, Davis TE, McFadden ET, et al. Toxicity and response criteria of the Eastern Cooperative Oncology Group. Am J Clin Oncol 1982;5:649-55.
9. The International Non-Hodgkin’s Lymphoma Prognostic Factors Project.
A predictive model for aggressive non-Hodgkin’s lymphoma. N Engl J Med 1993;329:987-94.
10. Gallamini A, Stelitano C, Calvi R, Bellei M, Mattei D, Vitolo U, et al. Pe- ripheral T-cell lymphoma unspecified (PTCL-U): a new prognostic model from a retrospective multicentric clinical study. Blood 2004;103:2474-9.
11. Falini B, Pileri S, De Solas I, Martelli MF, Mason DY, Delsol G, et al. Pe- ripheral T-cell lymphoma associated with hemophagocytic syndrome.
Blood 1990;75:434-44.
12. Rao SA, Gottesman SR, Nguyen MC, Braverman AS. T cell lymphoma associated with myelofibrosis. Leuk Lymphoma 2003;44:715-8.
13. Weisenburger DD, Savage KJ, Harris NL, Gascoyne RD, Jaffe ES, Ma- cLennan KA, et al. Peripheral T-cell lymphoma, not otherwise specified:
a report of 340 cases from the International Peripheral T-cell Lympho- ma Project. Blood 2011;117:3402-8.