*Corresponding author: Jeong Ho Park, Tel: 055-751-3345, E-mail: [email protected]
Department of Environmental Engineering, Gyeongnam National University of Science and Technology, 33 Dongjin-ro, Jinju, Gyeongnam 660-758
Received: December 19, 2013, Revised: February 18, 2014, Accepted: March 7, 2014
This is an Open-Access article distributed under the terms of the Creative Commons Attribution Non-Commercial License (http://creativecommons.org/licenses/by-nc/3.0) which permits unrestricted non-commercial use, distribution, and reproduction in any medium, provided the original work is properly cited.
http://dx.doi.org/10.15269/JKSOEH.2014.24.1.038
A신축아파트 및 B백화점에서 기계환기에 의한 실내공기질의 개선 효과
박정호*·이상혁·김형갑 경남과학기술대학교 환경공학과
Effect of Mechanical Ventilation System on Improvement of Indoor Air Quality in A Newly Built Apartment and B Department Store
Jeong Ho Park*·Sang Hyuk Lee·Hyoung Kab Kim
Department of Environmental Engineering, Gyeongnam National University of Science and Technology
ABSTRACT
본 연구에서는 기계환기에 의한 실내공기질 개선효과를 현장실험을 통해 파악하기 위해 환기설비를 갖춘 A 신축아파 트와 다중이용시설인 B 백화점을 연구 대상으로 하였다.
A 신축아파트에서는 새집증후군 등 주요 실내공기오염의 원인물질인 VOCs 및 HCHO를 측정 대상물질로 선정하고 미 환기 상태에서 16가구에서 전반적인 신축아파트의 실내공기오염 특성을 파악하였으며, 이중 상대적으로 TVOC 농도가 높 은 2가구를 대상으로 환기전후의 농도 특성을 파악하였다. B 백화점에서는 CO2 및 HCHO를 대상물질로 선정하고 1~7층별 로 미환기시와 기계환기 1시간 이후의 농도 특성을 통해 환기에 의한 저감율을 파악하였으며, 이후 환기시설 정상가동 상태 에서 3년간 실내공기오염물질의 농도 특성을 파악하였다.
미환기 상태에서 A 신축아파트의 VOCs 및 HCHO 농도는 일부 지점에서는 에틸벤젠, 자일렌 등의 농도가 실내환경기준 을 초과하고 있었다. 특히 환기전후의 TVOC 농도 특성은 A-1 지점의 경우 미환기시 3,547 μg/m3에서 환기시 961 μg/m3 그 리고 A-2 지점의 경우 미환기시 3,117 μg/m3에서 환기시 594 μg/m3으로 환기에 의해 각각 73%, 81% 저감율이 나타났다. 또 한 개별 VOCs 및 HCHO물질별 환기에 의한 저감율은 31.4~96.7%로 나타났으며, 환기이후 모든 물질이 실내기준보다 훨 씬 낮은 수준으로 나타났다. B 백화점에서는 평균 CO2 농도는 미환기시 855 ppm에서 기계환기 1시간 이후 580 ppm으로 약 32% 저감되었으며, HCHO의 평균농도도 251 μg/m3에서 70.3 μg/m3으로 약 72%의 저감되는 것으로 나타났다. 이후 환 기시설 정상가동 상태에서 3년간 실내공기질의 측정결과 지속적으로 실내환경 기준을 만족하였다.
최근 실내공기질 개선을 위해 다양한 개선 방법이 소개되고 있으나, 이중 기계환기는 신축아파트 및 다중이용시설 등에 서 실내공기질을 실내환경기준 이하로 지속적이고 쾌적하게 유지할 수 효과적 방법으로 고려된다.
Key words : department store, indoor air quality, newly built apartment, ventilation
I. Introduction
Since the early 1970s, the energy crisis has brought unexpected problems associated with indoor air. Newly constructed buildings are better insulated and sealed tightly to conserve heat. However, those of structural
conditions have led to inadequate ventilation, thus resulting in poor indoor air quality(IAQ), which will also damage the health of people working and living in the building(Editorial, 2012).
The ventilation is a determinant of indoor air quality in the building, as it serves as the primary
mechanism for removal of gaseous contaminants generated. So, high concentration of the contaminants accumulated inside is expected at lower ventilation rates with constant emission rates(Hodgson et al., 2000). Therefore, the ventilation for fresh air exchange is essential for occupant health(Drivas et al., 1972; Hodgson et al., 2000; Zhang et al., 2012).
Recently in Korea, it has been emphasized that maintaining high quality of indoor environment is important for health and safety of occupants in the building. Many studies have also reported the importance of IAQ management and ventilation(Shin et al., 2005; Hwang et al., 2006; Ryu et al., 2009;
Park, 2010; Lee et al., 2012).
Another issue regarding IAQ is indoor sources.
Particularly, the sources environmentally issued are volatile organic compounds(VOCs) and formaldehyde (HCHO) since both sources highly associate with materials used in construction and finishing the interiors of the buildings. Continuous emission of VOCs results in substantial contamination of the indoor air, and such contamination would eventually have negative impacts on the health effects and well-beings of the occupants(Andersson et al., 1997). Offermann(2009) reported that new homes in California that are built with relatively higher air tightness can have lower outdoor air exchange rates, and can often exceed the limit suggested by a guideline for air contaminants with indoor sources, HCHO and VOCs. Thus, mechanical ventilation systems are needed to provide dependable and continuous supply of outdoor air to new homes as well as to reduce various indoor HCHO sources.
However, the IAQ problems are not limited to new homes. Many commercial buildings such as department store have also struggled with the IAQ due to inappropriate ventilation. For example, the mechanical ventilation systems are not considered when designing some of the buildings(US EPA, 2013).
The main objective of this study is to characterize the IAQ and to compare the IAQ before and after the mechanical ventilation system is applied. Based on the
objective, the study will identify current sources of indoor air contaminants, assess exposure to measured air contaminants, and suggest effective strategies that will enhance the indoor air quality in the building.
Ⅱ. Materials and Methods
1. Sampling site and air sampling
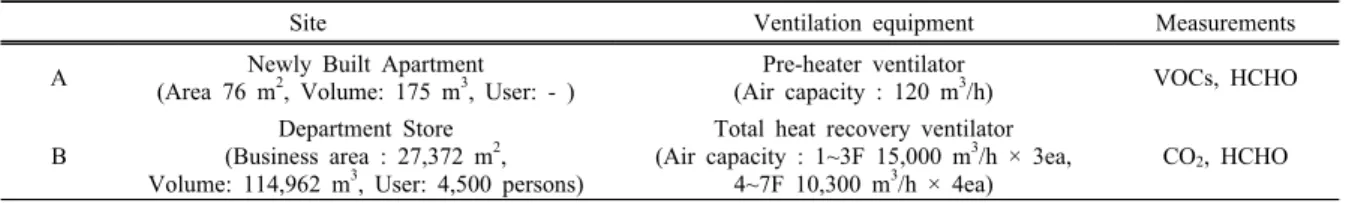
The study was performed at A newly built apartment(A site) in Pusan and B department store(B site) in Gyeongnam, which a mechanical ventilator is equipped with. The characteristics of the two sites are presented in Table 1.
The A site has pre-heater ventilator with 120 m3/h of air capacity and parameters used for chemical analysis are the concentrations of VOCs and HCHO estimated.
Samples of the indoor air were collected from 16 households under non-operation of the mechanical ventilation system. Of them, two households with relatively high TVOC concentration were selected to compare the IAQ concentrations before and after operating the ventilator.
The B site is equipped with total heat recovery ventilator with 15,000 m3/h of air capacity at 1~3 floor and 10,300 m3/h of air capacity at 4~7 floor separately. CO2 and HCHO were selected for chemical analysis. Since these compounds are commonly found in indoor environment of the building. Indoor air samples for pre and post ventilation were also collected, respectively for comparison.
The samples for pre ventilation were collected during non-operation of mechanical ventilation system and the samples of post ventilation were collected 1 hour after operating the ventilator.
According to BUILDING ACT in Korea, the recommended ventilation rate “by volume” is 0.7 of air change per hour(ACH) on minimum in apartment house and building(MOLIT, 2013). The ventilation rate calculated for the A site was 0.7 ACH and 1.3 ACH for the B site, respectively.
Site Ventilation equipment Measurements A Newly Built Apartment
(Area 76 m2, Volume: 175 m3, User: - )
Pre-heater ventilator
(Air capacity : 120 m3/h) VOCs, HCHO
B
Department Store (Business area : 27,372 m2, Volume: 114,962 m3, User: 4,500 persons)
Total heat recovery ventilator (Air capacity : 1~3F 15,000 m3/h × 3ea,
4~7F 10,300 m3/h × 4ea)
CO2, HCHO
Table 2. Analysis conditions of VOCs and HCHO
Compounds Sampling method Analysis system
VOCs Tenax TA Tube
Thermal desorption apparatus (ATD 400, Perkin Elmer) Oven temp. 320℃ / Desorb flow 30 ㎖/min, 10 min / Trap high temp. 320℃ / Trap low temp. -30℃ GC/MS system (Clarus 500, Perkin Elmer)
Column Elite-1(60m, 0.32mm, 1㎛) / Carrier gas Helium / Flow 1.0 ㎖/min / Final temp. 40℃→ 8℃→ 200℃ / MS ion source temp. 230℃
HCHO 2,4-DNPH Cartridge
HPLC (Series 200, Perkin Elmer)
Detector UV/vis. 360 nm / Column C18 reverses Mobile phase Acetonitrile / Flow 1.0 ㎖/min Table 1. Specifications for the newly built apartment and the department store
Methods used for collecting and analyzing the samples followed the general method for indoor air measurement by Ministry of Environment of Korea(MOE, 2010). With this method, VOCs were collected twice on sorbent samplers containing Tenax-TA. The flow rate and volume of the samples were 0.1 L/min and 3 L, respectively. For HCHO, the samples were collected twice in parallel on silica cartridges impregnated with 2,4-DNPH at the flow rate of 1 L/min. Volumes sampled was 30 L. The CO2 concentrations were measured for one hour using NDIR monitors(Model 8762, TSI, USA). The samplers were placed in the middle of the sampled sites with a height of 1.2~1.5 m above the floor. After sampling, the collected VOCs and HCHO samples were delivered to the laboratory for analysis.
2. VOCs and HCHO Analysis
The analysis methods for VOCs and HCHO are described in Table 2. VOCs were quantitatively analyzed by automatic thermal desorption(ATD 400, Perkin Elmer, USA) coupled with gas chromatography/mass spectrometry(Clarus 500, Perkin Elmer, USA), which follow Korean Indoor Air Quality Standard Method.
Target analytes were benzene, toluene, ethylbenzene, xylene, and styrene HCHO extracted with 5 mL of acetonitrile(HPLC grade) from the 2,4-DNPH cartridge was analyzed by high-performance liquid chromatography (Series 200, Perkin Elmer, USA) equipped with an UV diode array detector. The UV spectra of formaldehyde were compared with the respective spectra of standards.
Ⅲ. Results
1. VOCs and HCHO in the A newly built apartment The descriptive statistics of VOCs and HCHO concentrations in the 16 households of A newly built apartment is shown in Table 3. The samples were collected from the living room of the sampled in the absence of mechanical ventilation system. Besides, to minimize the impact of outdoor air, windows and doors were required to be closed as much as possible during the measurement time.
The range of TVOC concentration was from 1171.6 to 3546.8 μg/m3 with 2396.1 μg/m3 on average.
However, maximum concentrations in 4 households exceeded 3,000 μg/m3. For comparison, the mean concentration of 733 households by National Institute
Compounds
MOE standard
(μg/m3)
Concentration (μg/m3) in NIER(2005)
Concentration (μg/m3) in this study
Mean±SD Mean±SD Min~Max Median
TVOC - 2646.2±1992.4 2396.1±723.5 1171.6~3546.8 2404.3
Benzene 30 8.4±88.0 0.9±1.1 0.0~4.5 0.5
Toluene 1,000 1003.0±746.3 334.6±80.6 208.6~516.4 316.7
Ethylbenzene 360 120.0±129.9 204.6±88.4 68.3~411.9 183.0
Xylene 700 286.9±363.2 141.5±181.2 30.8~804.7 101.5
Styrene 300 63.2±71.8 66.7±17.1 33.3~101.4 64.8
HCHO 210 293.1±238.3 31.0±14.4 4.9~58.6 27.9
Table 3. Concentrations of VOCs and HCHO in the 16 households of A newly built apartment
Compounds
A-1 household A-2 household
Concentration (μg/m3) Reduction (%)
Concentration (μg/m3) Reduction Ventilation off Ventilation on Ventilation off Ventilation on (%)
TVOC 3546.8 961.0 72.9 3117.2 593.7 81.0
Benzene 1.72 1.18 31.4 4.47 1.22 72.7
Toluene 486.0 167.2 65.6 316.7 138.4 56.3
Ethylbenzene 411.9 58.8 85.7 298.4 42.8 85.7
Xylene 804.7 26.6 96.7 189.7 14.1 92.5
Styrene 57.6 37.9 34.2 89.4 44.3 50.5
HCHO 34.5 14.7 57.4 22.7 13.5 40.5
Table 4. Variations of VOCs and HCHO concentration by ventilation in A-1 and A-2 households of A newly built apartment
of Environmental Research(NIER) in 2005 was 2646.2 μg/m3(NIER, 2005).
The mean concentrations of VOCs and HCHO were toluene 334.6 μg/m3, ethylbenzene 204.6 μg/m3, xylene 141.5 μg/m3, styrene 66.7 μg/m3, benzene 0.9 μg/m3 and HCHO 31.0 μg/m3, respectively. From these results, it can be considered indoor pollutants are dominated by toluene, followed by ethylbenzene, xylene, styrene, HCHO and benzene.
The mean concentration ratio to MOE standard of benzene, toluene, ethylbenzene, xylene, styrene, and HCHO were 0.03, 0.33, 0.57, 0.20, 0.22, and 0.15, respectively, which means the mean concentrations of VOCs and HCHO measured were lower than the standards. Only one household showed the higher indoor concentration of ethylbenzene and xylene than the standard.
In this study, two sites (A-1, A-2 household) relatively high in TVOC concentration (>3,000 μg/m3) were selected to find decreasing rate of VOCs and HCHO concentration before(ventilator off) and after(ventilator on) operating the ventilator. The results of the monitored sites are presented in Table 4.
The concentrations of TVOC were decreased from 3,546.8 μg/m3 to 961.0 μg/m3 in A-1 site, and from 3117.2 μg/m3 to 593.7 μg/m3 in A-2 site by mechanical ventilation. Reduction rates of TVOC by ventilation were 72.9 and 81.0%, respectively.
Before operating the ventilator, ethylbenzene and styrene concentration in A-1 site exceeded the standards;
however, concentrations of all VOCs and HCHO after operating the ventilator decreased below the standards and the reduction rates of 5 VOCs and HCHO were from 31.4 to 96.7%. Through the ventilation, the concentrations
Compounds Standard 2010. 6. 15 2011. 6. 3 2012. 6. 29
3F 4F 6F 3F 4F 6F 3F 4F 6F Ave.
PM10
(μg/m3) 150 46.0 40.5 47.9 29.2 40.7 37.5 36.0 36.5 39.8 39.3±5.5 CO2
(ppm) 1,000 407 529 473 410 370 476 374 358 351 416±63
HCHO
(μg/m3) 100 47.0 61.8 51.6 62.8 70.8 59.0 61.1 84.7 44.8 60.4±12.3 CO
(ppm) 10 0.9 0.8 0.8 1.4 1.4 1.0 1.1 1.2 1.2 1.1±0.2
Table 5. IAQ concentration for the last 3 years in B department store
of xylene in A-1 and A-2 greatly decreased by 96.7%
and 92.5% with the reduction of the concentration of HCHO by more than 40%.
2. CO2 and HCHO in the B department store
This study was performed at B department store built in 2006. The B department store located in downtown have a business area of 27,372 m2 and 8 stories high, and often exceeded the IAQ guideline limit in accordance with IAQ Act.
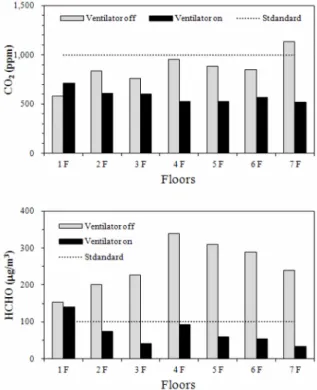
The variation in CO2 and HCHO concentrations before and after operating the ventilator on every floor(1~7th) is shown in Fig. 1.
The CO2 concentration under the ventilator off was average 855 ppm with 578~1,131 ppm range. In particular, on 7th floor, the concentration was estimated 1,131 ppm, which exceeds the MOE standard by 1,000 ppm. This may be because the 7th floor is the food court where many people are crowded. After 1 hour of mechanical ventilation, the average reduction of CO2 concentration was 580 ppm with the range of 516~714 ppm. All floors satisfied the MOE standard for the CO2 concentration under the ventilation, resulting in the reduction rate of 32.2% on average.
In regard to HCHO, building materials, clothing, furniture stores as well as inefficient ventilation can generate HCHO in the department store(Kim, 2010).
Before the ventilator was on, the HCHO concentrations were from 153 to 339.2 μg/m3. However, the level of HCHO for post ventilation decreased to 33.3~139.7 ppm,
which met the standards in all sites except the ground-floor. The reduction rate of HCHO was average 72.0%(251.0→70.3 μg/m3) by ventilation.
Table 5 illustrates how effective the ventilation applied to the department is in maintaining the satisfied level of IAQ for 3 years. The mean values of 4 compounds(PM10, CO2, HCHO and CO) all satisfied the standard. The concentrations of HCHO were 47.0~84.7 μg/m3 range, which were all acceptable.
Figure 1. Variations of CO2 and HCHO concentration by ventilation in B department store
Ⅳ. Discussion
A majority of materials used in construction of the building generates VOCs and HCHO and emissions of VOCs and HCHO will contaminate indoor ai and even possibly threaten the health and well-being of the occupants (Andersson et al., 1997).
In the 16 households in A newly built apartment, the mean concentrations of VOCs and HCHO were measured lower than the MOE standards, whereas the highest concentration of ethylbenzene and styrene were 411.9 μg/m3 and 804.7 μg/m3, which were higher than the standards. In other words, the mean concentrations of VOCs and HCHO acceptable according to IAQ Act(NIER, 2005; Kwak et al., 2006;
Lim et al., 2006; Kwon et al., 2009).
When it comes to indoor air quality in newly built apartments, improvement of airtightness and use of the building materials containing harmful chemical substances are the main issues discussed(Choi et al., 2006). Thus, the ventilation that assists air exchange to remove VOCs and HCHO generated is so important(Hodgson et al., 2000).
In comparison to the IAQ concentration that the ventilation was not applied(A-1, A-2 household), the concentration of VOCs and HCHO with the ventilation dropped by 34.2~96.7% and were even less than MOE standard with 1 hour ventilation.
In other words, the mechanical ventilation had remarkable impact on reducing the concentration of VOCs and HCHO. Recently, bake-out in newly built apartments has become a promising strategy that enhances indoor air quality. Lee et al.(2011) reported that the reduction rate of TVOC was approximately 66%
by application of bake-out process the newly-built apartments for seven days. However, contradictory evidence has also been arisen, reporting that the bake-out strategy did not work, but rather increased the concentration of TVOC to more than the original one(Girman et al., 1989). Hence, the efficiency of bake-out has yet to be proven domestically and
internationally(Kang et al., 2010; Kim et al., 2010).
In addition, the department store also needs to focus on maintaining the indoor air quality to the levels recommended by MOE, because many people are gathered spending considerable time in this closed environment. So control in indoor quality in the department store should be considered. For instance, some of the department stores are being managed for indoor air quality by a central automated system and IAQ certification system(Good Indoor Air Quality Certification, 2013).
In fact, great amount of the air pollution sources exists in the department store, because such a closed environment is inappropriately ventilated or mechanical ventilation systems in the building do not operate properly enough to bring the fresh air in. Most of all, the concentration of CO2 that is highly correlated with the quality of the indoor air was chosen as one of parameters determining the indoor air quality in this study.
In B department store, in the condition of ventilator switched off, the concentration on average was estimated above the standard, which was 855 ppm, and on 7th floor, in particular, about 1,000 ppm was more gone over the limit.
This phenomenon can be explained by two possible concepts. One comes from common sense that blockage of gas exchange, CO2 in this case, due to inadequate ventilation leads to the accumulation of the CO2 level inside, thus resulting in elevated concentration of CO2
compared to the outdoor. The other reason could be that a large number of people staying in the department store exhale the CO2 by breathing and the amount of the CO2
breathed out from all customers could not be neglected(Persily, 1997).
The level of CO2 in outdoor is normally not above 350~400 ppm. In other words, insufficient ventilation as well as considerably high numbers of the customers in B department store should be taken into account as major causes to lower the indoor air quality. However, 1 hour operation of the ventilator showed the great reduction of CO2 level by 32.2% on average as stated in the result.
The concentrations of all floors went to the normal level, which was 1,000 ppm, suggested by MOE by only allowance of the ventilation for 1 hour.
For HCHO, which was also considered as the parameter, MOE set 100 μg/m3 as the cut off level(MOE,2007). If the concentration is above this level, it can cause serious irritation on eye, nose, and throat as well as lowered airway and pulmonary dysfunction(Sametetal.,1988). With the same condition as used for CO2 level comparison, the levels of HCHO were compared with. Before the ventilator operated, the concentrations on all floors were reported 1.5 to 3.4 times higher than the standard. However, the ventilation system created the same effect of reduction on HCHO, lowering the level by 72.0% on average.
Ⅴ. Conclusions
In this study, the effect of the ventilation on IAQ in two sites was clearly proven. In A newly built apartment, by comparing with 0.7 ACH as the initial result without the ventilation, the TVOC with the ventilation was dropped by 70%. And the reduction rates of VOCs and HCHO were 31.4~96.7% range. In B department store with 1.3 ACH at the initial point, the reduction rates of CO2 and HCHO by ventilation were 32.2% and 72.0% on average, respectively. From those results, importance of operating the ventilation for enhancing the IAQ was remarkably emphasized.
Limit in using the building materials that induce decrease in IAQ can be the most efficient and effective ways, however application of this into the reality can sometimes hardly be possible, if they are already built on with those materials. Rather, equipment of the mechanical ventilation system to the newly constructed buildings should be emphasized and recommended to improve IAQ.
Acknowledgements
This work was supported by Gyeongnam National University of Science and Technology Grant.
References
Andersson, K., Bakke, J. V., Bjorseth, O., Bornehag, C.
G., Clausen, G., Hongslo, J. K., Kjellman, M., Kjaergaarrd, S., Levy, F., Molhave, L., Skerfving, S., Sundell, J., 1997, TVOC and health in non-industrial indoor environments -Report from a Nordic scientific consensus meeting at Langholmen in Stockholm 1996, Indoor Air, 7, 78-91.
Choi, S. Y., Kim, S. H., Yee, J. J., 2006, The effect on indoor air quality improvement by ventilation rate in newly built apartment, Korean Journal of Air-Conditioning and Refrigeration Engineering, 18(8), 649-655.
Drivas, P. J., Simmonds, P. G., Shair, F. H., 1972, Experimental characterization of ventilation systems in buildings, Environ. Sci. Technol., 6, 609–614.
Editorial, 2012, Climate change, indoor environments, and health, Indoor Air, 22, 89-95.
Girman, J. R., Alevantis, L. E., Kulasingam, G. C., Petreas, M. X., Webber, L. M., 1989, The bake-out of an office building: A case study, Environment International, 15, 449-453.
Good Indoor Air Quality Certification, 2013, http://goodair.
kaca.or.kr/main.htm
Hodgson, A. T., Rudd, A. F., Beal, D., Chandra, S., 2000, Volatile Organic Compound Concentrations and Emission Rates in New Manufactured and Site-Built Houses, Indoor Air, 10, 178-192.
Hwang, Y. J., Park, H. S., Jang, S. I., Roh, K. C., Son, T.
J., Han, J. W., Bae, G. S., Choi, I. J., 2006, The Characterization of Carbonyl Compounds in the Newly-Built Schools, Daegu City, J. KOSAE, 22(6), 831~841.
Kang, D. H., Choi, D. H., Lee, S. M., Yeo, M. S., Kim, K.
W., 2010, Effect of bake-out on reducing VOC emissions and concentrations in a residential housing unit with a radiant floor heating syste, Building and Environment, 45, 1816-1825.
Kim, S. Y., Kim, K. Y., Han, Y. S., Koo, J. W., 2010, Variation of Indoor Air Quality in a New Apartment Building by Bake-Out, Int. J. Environ. Res., 4(2), 263-270.
Kim, Y. S., 2010, Indoor Environmental Science, Shinkwang Publishing Co., Korea, 34-35.
Kwak, J., Kim, S. Y., Kim, S. N., 2006, A Study on Indoor Air Quality Variation with Time in New Apartment, The Annual Report of Busan Metropolitan City Institute of Health & Environment, Korea, 16(1),
146-153.
Kwon, M. H., Jang, S. K., Ryu, J. M., Seo, S. Y., Won, S.
R., Jung, S. J., Lim, J. H., 2009, A Study on Management of Major Indoor Air Pollutants by House Type in Korea(I) - Indoor Air Pollution and Health Effects in Residential Apartment, National Institute of Environmental Research, Korea.
Lee, K. S., Kim, H. J., Kim, S. S., Cho, J. K., Lee, J. B., 2011, Reduction Effect of VOCs and Formaldehyde using Auto Bake-Out System, J. of Korean Society for Indoor Environment, 1(2), 221-227.
Lee, S. H., Kim, N. H., Lee, K. S., Park, K. S., Park, S. Y., Kim, D. S., Kang, Y. J., Kim, E. S., Kim, D. S., 2012, Analysis of VOCs Influencing Environment Factors Using Statistics in Apartment House, J.
KOSAE, 28(4), 435~445.
Lim, Y. W., Yang, J. Y., Kim, H. H., Lee, Y. G., Kim, Y.
S., Jang, S. K., Sohn, J. R., Roh, Y. M., Shin, D. C., 2006, Health risk assessment in terms of VOCs at newly-built apartment house, J. of Korean Society for Indoor Environment, 3(3), 211-223.
Ministry of Environment of Korea(MOE), 2007, Indoor Air Quality Control in Public Use Facilities, etc. Act.
Ministry of Environment of Korea(MOE), 2010, The standard method for indoor air measurement in Korea.
Ministry of Land, Infrastructure and Transport of Korea (MOLIT), 2013, BUILDING ACT Article 62 - Standards for Building Facilities, Etc..
National Institute of Environmental Research(NIER), 2005, The study for IAQ guideline on the new apartment [II].
Offermann, F. J., 2009, Ventilation and Indoor Air Quality in New Homes, California Air Resources Board and California Energy Commission, PIER Energy-Related Environmental Research Program, Collaborative Report, CEC‐500‐2009‐085., California, USA.
Park, J. H., 2010, The Effect of Ventilation and Concentration of Indoor Air Quality at Indoor Parking Lots, J. Korean Soc. Occup. Environ. Hyg., 20(4), 241-247.
Persily, A. K., 1997, Evaluating Building IAQ and Ventilation With Indoor Carbon Dioxide, ASHRAE Transactions, 103(2), 4072(1-12).
Ryu, J. M., Jang, S. K., Yang, W. H., Cho, T. J., Son, B.
S., 2009, A Study on the Discharge of Volatile Organic Compounds in Indoor Air of Newly-constructed Apartment Houses, Journal of the Environmental Sciences, 18(50), 479-487.
Samet, J. M., Marbury, M. C., Spengler, J. D., 1988, Health effects and sources of indoor air pollution, Part II, American Review of Respiratory Disease, 137, 221–242.
Shin, H. S., Yeo, C. S., Byun, S. H., Ahn, Y. C., Lee, J.
K., Park, H. S., Kim, B. S., Lee, K. G., Kang, T. W., 2005, Indoor Air Quality Impact of Ventilation with the Existence of Occupants in Schools, J. of Korean Society for Indoor Environment, 1(2), 221-227.
US EPA, 2013, http://www.epa.gov/iaq.
Zhang, L. Z., Zhang, X. R., Miao, Q. Z., Pei, L. X., 2012, Selective permeation of moisture and VOCs through polymer membranes used in total heat exchangers for indoor air ventilation, Indoor Air; 22: 321-330.