도시유역의 부유고형물 유출평가를 위한 쓸림모형 개발
주진걸ᆞ정동휘ᆞ김중훈
†
ᆞ박무종*
고려대학교 건축 사회환경공학부
*한서대학교 토목공학과
A Development of Washoff Model for Suspended Solids in Urban Areas
Jingul Joo⋅Donghwi Jung⋅Joonghoon Kim
†
⋅Moojong Park*
School of Civil, Environmental and Architectural Engineering, Korea University
*
Department of Civil Engineering, Hanseo University (Received 7 May 2010, Revised 28 July 2010, Accepted 30 July 2010)
Abstract
Suspended Solid (SS) is one of the main pollutants and discharges with attached other pollutants such as heavy metal and toxic substance. It is very important to estimate and forecast the release characteristics of SS for water quality improvement. The current studies assumed that SS release rate is proportional to the rain intensity and suggested exponential washoff models.
These models related to the shear force of flow. In this study, a new washoff model is suggested based on relation with SS release rate and mean flow rate of the basin surface which is closely related to the shear force. The proposed model is applied to the Goonja drainage district in Seoul, Korea. The new washoff model simulates the SS discharge more accurately in the various rainfall types. The model can be widely applied to the real problems such as the management of non-point source pollutant and the design of treatment facilities.
keywords : Non-point source pollutant, Suspended solid, Urban area, Washoff model
1. 서 론
1)
강우 유출수는 도시에서 발생하는 비점오염원 중 큰 비 중을 차지하고 있으며, 도시화의 진행에 따라 비점오염원 발생량도 매년 증가하고 있다(김석구 등, 2004; 최지용과 신창민, 1997; Elliott and Trowsdale, 2007; Göbel et al., 2007; Zoppou, 2001). 이에 강우발생시 우수와 함께 유출 되는 오염물의 유출 특성을 알고 유출량을 예측하는 것이 도시하천의 수질개선을 위하여 매우 중요한 일이 되었다.
특히 도시유역의 우수유출수에 포함된 SS(Suspended solids) 는 중금속, 연료부산물 등의 위험성 오염물을 흡착하여 유 출되는 것으로 알려져 있다(Furumai et al., 2002; Hoffman et al., 1984; Pitt et al., 1995; Sansalone et al., 1998). 국내 의 경우 도시유역에서의 강우 유출수의 특성에 관한 연구 가 많이 진행되었으나, 유출량을 모의하기 위한 연구는 부 족한 실정이다(강용태 등, 2007; 김이형과 강주현, 2004a, 2004b; 노성덕 등, 2004; 이준호 등, 2005). 강우유출수에 포함된 SS의 양을 모의하기 위한 시도는 Sartor and Boyd(1972), Sartor 등(1974)에 의하여 처음 시도되었다.
Sartor는 미국의 12개 도시에서 관측된 자료를 분석하여 지 수형 쓸림모형을 제안하였다. Sartor 모형은 SS의 유출량이
†
To whom correspondence should be addressed.
[email protected]
유역에 쌓여있는 SS의 양, 강우강도 및 유역특성과 비례한 다고 가정하였다.
Sartor and Boyd(1972), Sartor 등(1974) 이후 지수형 쓸 림모형을 개선하여 도시유역에서 SS의 쓸림량을 모의하기 위한 연구가 수행되었다. Alley(1981)와 Nakamura(1984)는 Sartor식의 매개변수 산정에 관한 연구를 수행하였다.
Grottker(1987)는 건기시 청소에 의한 쓸림효과를 고려하였 으며, Calabro(2004)는 SS의 쓸림량을 최초유역에 쌓인 양 에 대한 비를 유출량(volume)의 지수형태로 제안하였다.
Egodawatta 등(2007)은 강우강도의 영향을 고려하기 위하 여 capacity factor를 추가하였으며, Soonthornnonda 등 (2008)은 선형 축적공식과 지수형 쓸림식을 겹합하여 사용 하였다. Zhang 등(2009)은 강우 중 대기와 나뭇잎에서 씻 기는 SS 양을 고려하였다. 이상의 연구들에서 유량과 SS 유출량의 지수관계는 유지되었다. 그러나 입자의 쓸림 및 이송은 흐름에 의한 전단력과 관계가 있으며, 이러한 전단 력을 활용하여 SS 유출량을 산정하려는 연구들이 수행되었 다. Moss 등(1979)은 rain-flow transportation이라고 불리는 빗물방울의 유사 부유효과가 유사이송에 중요한 영향을 미 치는 것을 증명하였다. 그 이후 다양한 연구에서 강우의 효과와 우수의 흐름의 전단력 효과를 구분하여 쓸림모형을 제안하였다(Deletic et al., 1997; Rose, 1985; Rose et al., 1994; Shaw et al., 2006; Tomanovic and Maksimovic, 1996).
그 외에 최근에는 추계학적 방법을 사용하거나(Lisle et al.,
Table 1. The surface characteristics of Goonja drainage district
Basinnumber
Basin area (ha)
Impervious area ratio (%)
Width (m)
Manning's roughness coefficient Surface storage (mm) Impervious area Pervious area Impervious area Pervious area
1 7.57 44.7 598 0.01 0.1 2.54 5.08
2 11.75 46.4 713 0.01 0.1 2.54 5.08
3 12.29 65.1 1,022 0.01 0.1 2.54 5.08
4 10.37 94.9 240 0.01 0.1 2.54 5.08
5 4.33 96.6 734 0.01 0.1 2.54 5.08
6 6.81 94.4 138 0.01 0.1 2.54 5.08
7 5.34 95.8 96 0.01 0.1 2.54 5.08
8 9.70 93.2 376 0.01 0.1 2.54 5.08
9 15.80 95.1 1,249 0.01 0.1 2.54 5.08
10 12.45 97.4 1,528 0.01 0.1 2.54 5.08
Table 2. The data of sewer in Goonja drainage district
Pipe Length (m) Slope Manning's roughness coefficient The characteristics of pipes
Shape Height (m) Width (m)
p1 124.53 0.020 0.018 Square 1.7 1.7
p2 421.30 0.007 0.018 Square 1.7 1.7
p3 107.49 0.003 0.018 Square 1.7 1.7
p4 267.40 0.003 0.018 Square 1.8 1.8
p5 221.28 0.025 0.018 Square 0.6 0.6
p6 20.24 0.023 0.018 Square 0.7 0.7
p7 21.89 0.001 0.018 Square 0.6 0.6
p8 256.84 0.001 0.018 Square 2.1 2.0
p9 418.22 0.001 0.018 Square 2.2 2.2
p10 13.17 0.052 0.018 Square 2.2 2.2
1998), stepwise cluster 방법을 사용하여(Liu et al., 2007) 비점오염원의 발생량을 모의하고자 하는 연구가 수행되었다.
이상의 연구들에도 불구하고 SS 유출량을 모의하는 것은 여전히 대단히 어려운 일이며 도전적인 과제이다. 유사를 움 직이는 직접적인 원인이 유수의 전단력이라는 측면에서 전 단력을 활용한 SS 유출량 산정 방법들은 좀 더 합리적이다.
그러나 다양한 강우 및 유역특성에서 전단력을 산정하는 것 은 쉬운 일이 아니다. 따라서 본 연구에서는 전단력과 관련 이 있으나 비교적 산정하기 쉬운 유속을 활용하여 도시 소유 역에서 SS량을 산정할 수 있는 새로운 모형을 개발하고자 한다. 이를 위하여 유속 및 지표 특성을 반영하는 SS 쓸림 모형 개발하였으며, 서울의 군자 배수구역에 적용하였다.
2. 연구방법
2.1. 대상지역
본 연구의 대상유역은 국토해양부의 ‘도시홍수 재해관리 기술 연구단’의 대상유역인 서울의 군자 배수구역이다(배덕 효 등, 2007). 군자 배수구역은 중랑천 좌안의 하류부인 광 진구에 위치하고 있으며, 유역면적은 약 96 ha이다. 군자 배 수구역은 전체 유역면적의 약 75%가 주택, 상업, 도로 등의 불투수지역으로 이루어져 있으며, 상류 유역에는 일부 산지 를 포함하고 있다. 주간선의 길이와 지선을 고려하여 대상 유역을 Fig. 1과 같이 총 10개의 소유역으로 구분하였으며,
Fig. 1. The shape and pipe network of Goonja drainage district.
각 소유역의 지형특성 및 관제원은 Table 1, 2와 같다.
2.2. 도시유역에서의 SS 유출량 모의기법 개발
Sartor 등(1974)은 유역에서의 SS 쓸림량은 강우량과 유역에 쌓인 SS의 양과 비례한다고 가정하여, 식 (1)을 제안하였다.
⋅ ⋅ (1)
여기서 M은 유역에 쌓인 SS량(kg), I는 강우량(mm), 는 유역표면 및 SS 성상에 따른 매개변수이다.
식 (1)은 식 (2)와 같이 나타낼 수 있으며, 양변을 적분하 면 유역에서의 SS 쓸림량은 식 (3)으로 나타낼 수 있다.
(2)
(3)
여기서 는 강우 시작시 유역에 쌓여있는 SS량(kg)이다.
SS의 쓸림량은 유역에 쌓여있는 SS량의 변화량이며, 유 수에 의하여 유역에 쌓여있는 SS가 얼마나 많이 쓸려 나갈 것인가와 연관이 있다. 따라서 SS의 쓸림은 기본적으로 유 수의 전단력과 관계가 있다. 그리고 이 유수의 전단력은 유속, 수심, 유역경사, 표면의 조도 등과 밀접한 연관이 있 으며, 모두 유속의 항으로 나타낼 수 있다. 이에 본 연구에 서는 SS 쓸림량은 유속과 비례하는 것으로 가정하였으며, 식 (4)로 나타내었다.
⋅⋅ (4)
여기서 는 지표에서의 평균유속(m/s)이다.
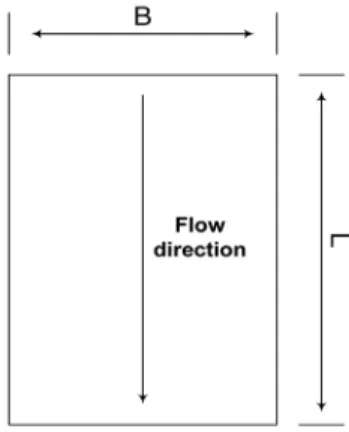
Fig. 2와 같은 직사각형 모양의 균질한 유역을 가정하여 보자. 이때 시간 t에서의 유량 Q(t)는 연속방정식으로부터 식 (5)처럼 나타낼 수 있다.
Fig. 2. Imaginary basin of rectangular shape.
× × (5)
여기서 d는 수심(m), 는 평균유속이다.
지표에서의 흐름이므로 광폭수로로 가정하면 ≈ 로 가 정할 수 있으며, Manning 공식에서 식 (6)과 같이 나타낼 수 있다.
(6)
식 (5)에 식 (6)을 대입하고 정리하면 식 (7)과 같이 나타 낼 수 있다.
(7)
식 (7)을 식 (4)에 대입하면 식 (8)과 같다.
⋅
⋅ (8)
식 (8)에서, n, B, S는 유역의 특성에 따른 상수이므로
(9)
로 놓을 수 있다.
따라서, 강우 시작 후 짧은 시간 간격 시간에서 유역 에 남아있는 SS의 양은 식 (10)과 같이 나타낼 수 있다.
⋅exp ⋅ ⋅ ⋅ (10)
식 (10)을 시간에 대하여 미분하면, 강우 후 시간동안 유역에서 쓸려나간 SS의 양은 식 (11)로부터 단계적으로 산정할 수 있다.
⋅ exp ⋅ ⋅ ⋅
(11)
2.3. 매개변수 민감도 분석
식 (10)에 사용되는 매개변수는 유역폭 B, 조도계수 n,
경사 S, 쓸림계수 와 시간 t에서의 유량 Q(t)이다. 각각의
매개변수가 SS의 유출에 미치는 영향에 대하여 확인하기
위하여, 한 변이 100 m인 정사각형의 완전불투수 유역에서
각 매개변수의 민감도 분석을 실시하였다. 강우는 전체 유
역에 대하여 균일하게 내린다고 가정하였으며, Table 3을
기본조건으로 설정하였다. 기본조건에서 유량을 20%씩 증
가, 감소시키며 쓸림량을 모의하였으며, 결과를 Fig. 3에 나
타내었다. Sartor의 식과 본 연구에서 제안한 식 모두 유량
이 증가할수록 SS의 유출이 더 빠르게 진행되었다. 특히
Sartor 식은 유량이 감소됨에 따라 SS 유출량이 급격하게
감소되어, 본 연구에서 제안한 식보다 SS의 쓸림량이 유량
에 민감하게 반응하는 것으로 나타났다. Fig. 3은 기본조건
에서의 Sartor 식에 의한 쓸림량과 본 연구의 식에 의한 쓸
림량에 차이가 있다. 이러한 차이를 제거하고 순수한 유량
차이에 따른 민감도를 확인하기 위하여, 유역에 쌓인 SS가
50% 제거되는 시간 비율을 모의하였다. 유량이 1 일
때 유역에 쌓인 SS의 50%가 쓸리는데 필요한 시간을 기준
으로, 유량을 20%씩 증감하며 SS의 50%가 유출되는 시간
의 비를 나타내 Fig. 4에 나타냈다. 그 결과 Sartor 식을 사
Table 3. The basic condition of the imaginary basin
Area(m2)
width
(m) Basin slope Manning's n
M
0(kg/m2)
Q (m3/sec)
Washoff parameter (Sartor)
Washoff parameter (This study)
10,000 100 0.001 0.013 0.2 1.0 0.2 0.005
(a) Sartor equation (b) This study
Fig. 3. The sensitivity of the washoff amount depending on the flow rate.
Fig. 4. The time ratio needed to release 50% of SS depen- ding on the flow rate at the imaginary basin.
용한 결과가 본 연구에서 제안한 식을 사용한 결과에 비하 여 유량에 따라 쓸림량이 민감하게 반응하는 것을 확인할 수 있었다. 이는 식 (4)와 식 (11)에서 유량의 지수의 차이 에서 발생한 것이다. 지형의 특성에 따른 매개변수들에 대 한 민감도 분석결과를 Fig. 5에 나타내었다. Fig. 5에서 제 시한 분석결과는 추후 연구에서 본 연구에서 개발한 식을 적용할 때 도움이 될 것으로 판단된다.
2.4. 모형 적용
Table 4의 대상호우에 대하여 본 연구에서 제안한 모의 를 통하여 TSS 유출량을 산정하였으며, 관측된 TSS 유출 량과 비교하였다. 강우자료는 국토해양부 ‘도시홍수재해관
리기술연구단’에서 설치 관리하고 있는 용마초등학교 관측 소에서 관측한 10분단위 강우자료를 사용하였으며, 유량 및 수질은 군자배수구역의 출구 지점인 군자교 직하류 약 50 m 지점에서 측정하였다. 오염물 축적함수는 식 (12)와 같은 지수식을 사용하였다.
max ×
(12)
여기서 max 는 단위면적에 축적될 수 있는 최대 SS량, 은 유역특성에 따른 매개변수이다.
대상유역의 토지이용을 오염물의 축적과 쓸림 특성에 따 라 3가지로 구분하였다. Landuse 1, 2는 도시의 포장지역으 로, 오염물의 축적 및 쓸림이 활발하게 일어나는 지역을 대표한다. Landuse 1은 거주 및 일반 상업지역, Landuse 2 는 주․간선 도로를 나타낸다. Landuse 3는 나지, 학교 운 동장, 산 등 비포장지역을 나타내며, 오염물의 축적이 느리 고 우수의 유출률이 낮아 호우시 오염물의 쓸림이 활발하 지 않은 지역을 나타낸다. 각 소유역별 토지이용은 Table 6 과 같다.
3. 결과 및 고찰
호우사상 1과 2에 대하여 EPA-SWMM 5.0 모형을 사용
하여 강우-유출분석을 수행하여 Fig. 6에 나타내었다. 호우
사상 1은 평균강우강도와 첨두 강우강도간의 차이가 거의
없이 비슷한 강우가 꾸준히 내린 사상이다. 호우사상 2는
강우 시작 후 25%의 시간동안 총 강우의 55%가 내려 강
우의 전반부에 호우가 집중된 형태이다. 두 가지 형태의
호우사상에서 SWMM에 의한 강우-유출 모의가 비교적 정
(a) Sensitivity depending on washoff parameter (b) Sensitivity depending on slopes
(c) Sensitivity depending on basin width (d) Sensitivity depending on Manning's roughness coefficients (n)
Fig. 5. The sensitivity analysis depending on the parameters.
Table 4. Case study rainfall event
No. Time Total rainfall
(mm)
Duration time Average rainfall intensity (mm/hr)
Peak rainfall intensity (mm/hr)
Antecedent dry days
1 2005. 8. 24 20:20 8.5 1hr 10min 7.3 9 4
2 2007. 6. 28 07:20 11.0 1hr 20min 8.3 33 3
주) Hydrological data survey report in Joongrang stream basin 2006 (FFC05-05)
Table 5. The parameter of buildup function and washoff fun- ction depending on landuse
Landuse case
Buildup function parameter
Washoff function parameter
m ax
Landuse 1 210 0.035 0.003
Landuse 2 230 0.040 0.008
Landuse 3 150 0.020 0.001
확하게 유출을 모의할 수 있는 것으로 나타났다. 산정된 유 출량에 따른 SS 유출량을 제안된 식을 사용하여 산정하였으 며, Fig. 7에 나타내었다. 제안된 식은 호우사상 1과 2 모두에 서 SS의 쓸림을 정확하게 모의할 수 있는 것으로 나타났다.
Table 6. Landuse of Goonja drainage district (unit : %)
Subbasin number Landuse 1 Landuse 2 Landuse 31 30 40 30
2 25 20 55
3 80 10 10
4 70 20 10
5 80 10 10
6 70 10 20
7 80 10 10
8 80 10 10
9 70 15 15
10 30 40 30
(a) Rainfall event 1 (b) Rainfall event 2
Fig. 6. Hyetograph and hydrograph.
(a) Rainfall event 1 (b) Rainfall event 2
Fig. 7. SS discharge curves.
4. 결 론
도시에서 우수유출수와 함께 배출되는 비점오염원들은 도시하천의 수질을 악화시키는 주요한 원인으로 지목되고 있다. 그 중 SS는 도시 유출수 중 주요한 오염원일 뿐 아 니라 차량 등에서 발생한 중금속 및 독성물질 등이 SS에 부착하여 유출되어 더욱 관리에 주의를 기울여야 한다. 본 연구에서는 SS 유출과 평균유속이 비례한다는 가정하에 도 시 소유역에서 SS 유출량을 산정할 수 있는 모형을 개발하 였다. 개발된 모형은 경사, 유역폭, 조도계수 등 유역의 지 표특성을 반영하여 SS 유출량을 산정할 수 있다. 또한 유 량의 영향도 고려하고 있으나, 기존의 Sartor 모형에 비하 여 SS 유출량이 유량에 덜 민감한 것으로 나타났다. 본 모 형은 소유역 단위에서 산정하기 어려운 전단력 대신 비교 적 산정하기 쉬운 지형 매개변수와 유량을 사용하여 SS 유 출량을 산정할 수 있다는 장점이 있다. 개발된 모형을 대 표적인 도시유역 중 하나인 서울의 군자 배수구역에 적용 하여 SS 유출량을 산정하고 관측값과 비교하였다. 그 결과 개발된 모형은 전방 집중형 강우와 중앙집중형 강우에서 모두 SS 유출을 적절하게 모의할 수 있는 것으로 나타났 다. 개발된 모형을 다양한 유역과 많은 호우사상에 적용하 여 매개변수들의 보정을 위한 충분한 자료가 축적된다면 개발지역 등의 관측자료가 없는 지역에서의 비점오염원 유 출을 모의할 수 있다. 이러한 모의 결과는 도시 비점오염
원 관리 및 비점오염원 처리 시설의 설계 등에 광범위하게 활용될 수 있을 것으로 판단된다.
사 사
이 논문은 2007년도 정부(교육과학기술부)의 재원으로 한국 연구재단의 지원을 받아 수행된 기초연구사업임(KRF-2007- 314-D00279). 본 연구에 사용할 수 있도록 관측 수질자료 를 제공해주신 경기대학교 이종태 교수님께 감사드립니다.
참고문헌
강용태, 한상윤, 전종규(2007). 초기강우에 의한 공업지역내
의 비점오염원 유출특성에 관한 연구.
한국수처리학회
지
, 15(1), pp. 59-68.김석구, 김영임, 윤상린, 이용재, 김이호, 김종오(2004). 강우
강도에 따른 노면유출수의 유출특성.
수질보전 한국물환
경학회지
, 20(5), pp. 494-499.김이형, 강주현(2004a). 강우로 인해 고속도로로부터 유출되
는 폐기물의 성상, 부하량 및 유출 특성.
수질보전 한국
물환경학회지
, 20(5), pp. 415-421.김이형, 강주현(2004b). 강우시 발생하는 고속도로 유출수의 초기우수 특성 및 기준.
수질보전 한국물환경학회지
, 20(6), pp. 641-646.노성덕, 이대근, 전양근(2004). 도로상의 비점오염물질 저감
을 위한 초기 우수유출수 처리에 관한 연구.
수질보전 한국물환경학회지
, 20(5), pp. 525-533.배덕효, 김형섭, 이종태, 김이현(2007).
중랑천 수문자료집 2006. FFC05-05, 도시홍수재해 관리기술 연구단기술보고서.
이준호, 조용진, 방기웅(2005). 강우시 도로유출수 수질특성 및 입경분포.
대한환경공학회지
, 27(7), pp. 777-784.최지용, 신창민(1997).
도시지역 비점오염원 관리방안 연구
. 한국환경정책평가연구원.Alley, W. M. (1981). Estimation of impervious-area washoff parameters. Water Resources Research, 17(4), pp. 1161-1166.
Calabro, P. S. (2004). Design storms and water quality control.
Journal of Hydrologic Engineering, 9(1), pp. 28-34.
Deletic, A., Maksimovic, C., and Ivetic, M. (1997). Modelling of storm wash-off of suspended solids from impervious surfaces. Journal of Hydraulic Research, 35(1), pp. 99-117.
Egodawatta, P., Thomas, E., and Goonetilleke, A. (2007).
Mathematical interpretation of pollutant washoff from urban road surfaces using simulated rainfall. Water Research, 41, pp. 3025-3031.
Elliott, A. H. and Trowsdale, S. A. (2007). A review of models for low impact urban stormwater drainage. Environ-
mental Modelling & Software, 22, pp. 394-405.
Furumai, H., Balmer, H., and Boller, M. (2002). Dynamic behavior of suspended pollutants and particle size distri- bution in highway runoff. Water Science and Technology,
46(11-12), pp. 413-418.
Göbel, P., Dierkes, C., and Coldewey, W. G. (2007). Storm water runoff concentration matrix for urban areas. Journal
of Contaminant Hydrology, 91, pp. 26-42.
Grottker, M. (1987). Runoff quality from a street with medium traffic loading. The Science of the Total Environment, 59, pp. 457-466.
Hoffman, E. J., Mills, G. L., Latimer, J. S., and Quinn, J. G.
(1984). Urban runoff as a source of polycyclic aromatic hydrocarbons to coastal waters. Environmental Science and
Technology, 18(8), pp. 580-587.
Lisle, I. G., Rose, C. W., Hogarth, W. L., Hairsine, P. B., Sanders, G. C., and Parlange, J. Y. (1998). Stochastic sediment transport in soil erosion. Journal of Hydrology,
204, pp. 217-230.
Liu, W. T., Huang, Y. F., and Gong, T. L. (2007). Stepwise cluster analysis methodology study for urban nonpoint
source pollution in Los Angeles. Environmental Informatics
Archives, 5, pp. 422-430.
Moss, A. J., Walker, P. H., and Hutka, J. (1979). Raindrop- stimulated transportation in shallow water flows: an experi- mental study. Sedimentary Geology, 22, pp. 165-184.
Nakamura, E. (1984). Factors affecting the removal rate of street surface contaminants by overland flow. Journal of
Research, 24, pp. 1-24.
Pitt, R., Field, R., Lalor, M., and Brown, M. (1995). Urban stormwater toxic pollutants: assessment, sources and treat- ability. Water Environmental Research, 67(3), pp. 260-275.
Rose, C. W. (1985). Developments in soil erosion and deposition models. Advances in Soil Science, 2, pp. 1-63.
Rose, C. W., Hogarth, W. L., Sander, G., Lisle, I., Hairsine, P., and Parlange, J. Y. (1994). Modeling processes of soil erosion by water. Trends in Hydrology, 1, pp. 443-451.
Sansalone, J. J., Koran, J. M., Smithson, J. A., and Buch- berger, S. G. (1998). Physical characteristics of urban road- way solids transported during rain events. Journal of
Environmental Engineering, 124(5), pp. 427-440.
Sartor, J. D. and Boyd, G. B. (1972). Water pollution aspects
of street surface contaminants. EPA-R2-72-081(NTIS PB-
214408), Environmental Protection Agency, Washington, DC.Sartor, J. D., Boyd, G. B., and Agrdy, F. J. (1974). Water pollution aspects of street surface contaminants. Water
Pollution Control Federation, 46(3), Part 1, pp, 458-467.
Shaw, S. B., Walter, M. T., and Steenhuis, T. S. (2006). A physical model of particulate wash-off from rough imper- vious surfaces. Journal of Hydrology, 327, pp. 618-626.
Soonthornnond, P., Christensen, E. R., Liu, Y., and Li, J.
(2008). A washoff model for stormwater pollutants. Science
of the Total Environment, 402, pp. 248-256.
Tomanovic, A. and Maksimovic, C. (1996). Improved modelling of suspended solids discharge from asphalt surface during storm event. Water Science and Technology, 33(4-5), pp.
363-369.
Zhang, W., Keller, A. A., and Wang, X. (2009). Analytical modeling of polycyclic aromatic hydrocarbon loading and transport via road runoff in an urban region of Beijing, China. Water Resources Research, 45, W01423.
Zoppou, C. (2001). Review of urban storm water models.