186 Kor. J. Pharmacogn. 52(3) : 186 ∼ 191 (2021)
https://doi.org/10.22889/KJP.2021.52.3.186
곰보배추에 함유된 6-Hydroxyluteolin 7-O-Glucoside 분석을 위한 HPLC/DAD 분석법 밸리데이션
이학동
1·바헤
1·최중원
1·김주리
1·유아람
1,2·배민정
2·이상현
1,3,4*
1
중앙대학교 식물생명공학과,
2한국식품산업클러스터진흥원
3
중앙대학교 생명환경연구원,
4한국천연물과학기술연구소
HPLC/DAD Method Validation of 6-Hydroxyluteolin 7-O-Glucoside Analysis from Salvia plebeia
Hak-Dong Lee
1, Leo Adrianne Paje
1, Jungwon Choi
1, Juree Kim
1, A Ram Yu
1,2, Min-Jung Bae
2, and Sanghyun Lee
1,3,4*
1
Department of Plant Science and Technology, Chung-Ang University, Anseong 17546, Korea
2
Technical Assistance Department, The Food Industry Promotional Agency of Korea, Iksan 54576, Korea
3
BET Research Institute, Chung-Ang University, Anseong 17546, Korea
4
Natural Product Institute of Science and Technology, Anseong 17546, Korea
Abstract − We developed a method to identify and quantify 6-hydroxyluteolin 7-O-glucoside in the powder of Salvia plebeia (PS) using high-performance liquid chromatography coupled with diode array detector (HPLC/DAD) and equipped with reverse-phase INNO C18 column. The analytical method was optimized and validated using novel parameters. The obtained values for the limits of detection and quantification were 3.60 and 10.90 µg/mL, respectively. Calibration curve showed good linearity in the concentration range tested (0.00625-0.1 mg/mL, r
2= 1.0000), high accuracy (96.2-101.4%), and precision values (RSD ≤ 0.27%). Our analysis support the use of our method for accurately identifying and quantifying 6-hydroxyluteolin 7-O- glucoside from PS in routine analyses and large-scale extraction processes for content determination.
Keywords − Salvia plebeia, 6-Hydroxyluteolin 7-O-glucoside, Method validation, HPLC/DAD
Salvia plebeia belongs to the family Lamiaceae. It is a biannual grass widely distributed in many countries such as Korea, China, and Japan. S. plebeia has been used as a medicinal plant for a long time in Asia to treat inflammatory diseases like common cold, cough, flu, hepatitis, hemorrhoid.
1)Many studies have shown that S. plebeia possess various bio- activities such as anti-oxidants,
2)anti-cancer,
3)anti-inflam- matory,
4)hepatoprotective,
5)cytotoxic, and anti-microbial
6)effects. It is also good for atopy
2)and asthma.
7)Besides, the plants in the genus Salvia are known to be a rich source of plant secondary metabolites. These include flavonoids,
8,9)diter- penoids,
10)lignans,
11,12)caffeic acid derivatives,
1)sesquit- erpenoids
13)and essential oils.
14)Currently, people’s interest in health and longevity is rap- idly increasing. As a result, interest in natural product-based various foods, medicines, and supplements are also increasing.
S. plebeia could be used as a good candidate in developing health functional food and supplements because of its various effects and abundant ingredients. Therefore, it is necessary to develop a marker compound analysis method of S. plebeia and verify if the established analytical method is reproducible and reliable. To the best of our knowledge, there have been many studies reported on the physiological activities of S.
plebeia extracts. However, little has been conducted on the analysis of 6-hydroxyluteolin 7-O-glucoside (6-HLG) and validation of its analytical method. Our recent study was able to isolate and identify 15 different materials from S. plebeia including 6-HLG.
15)In order to utilize a plant derived mate- rial as a functional ingredient, at least one marker compound
*교신저자(E-mail):[email protected] (Tel): +82-31-670-4688
needs to be standardized, developed, and verified. Analytical method validation is a set of procedures for establishing whether an analytical method is reproducible and provides reliable results when used for the intended purpose.
16)These validation procedures have gained wide acceptance as a criterion for determining the validity of analytical methods used for the quality control of health-related functional foods and phar- maceuticals.
17)In this study, we aim to establish a rapid and convenient HPLC analytical method for quantifying the marker com- pound in the powder of S. plebeia extract (PS). This study validated the established analytical method of functional marker compoound 6-HLG of PS using HPLC/DAD, prior to developing a high value-added functional product using PS.
Materials and Methods
Plant materials and preparation of PS − The raw plant materials were provided by FromBio, Suwon, Korea. Voucher specimen (FIE-SP) was deposited at FromBio, Suwon, Korea.
All of the preparation of PS were conducted by The Food Industry Promotional Agency of Korea in December 2020.
The dried leaves of S. plebeia were cultivated in Gyeongbuk- do, Korea. Grinded S. plebeia leaves (85 kg) were extracted with water (85°C, 8 h), filtered, and dried using a spray dryer.
The extraction yield was approximately 34%.
Instruments and reagents − Chromatographic analysis was performed using an HPLC system (Agilent 1260 Infinity II Quat Pump, CA, USA) equipped with a pump, auto-sam- pler, and diode array detector (DAD WR detector, CA, USA).
HPLC-grade solvents, including water, methanol (MeOH), and acetonitrile (ACN), were purchased from J. T. Baker (Phil- lipsburg, PA, USA). Acetic acid (99.7%) was purchased from Samchun Pure Chemicals (Pyeongtaek, Korea). 6-HLG was isolated and identified from S. plebeia in a previous paper (Fig. 1).
15)6-HLG was obtained from Natural Product Insti- tute of Science and Technology (www.nist.re.kr), Anseong, Korea.
Preparation of sample and standard solutions for HPLC − PS was dissolved in MeOH (70 mg/mL) and filtered through a syringe filter (0.45-μm) to prepare the sample stock solutions. Standard stock solution of 6-HLG was also pre- pared by dissolving 1 mg of 6-HLG in 1 mL MeOH. To pre- pare the 6-HLG calibration curve, working solutions were prepared by diluting the stock solution to the desired con- centrations.
HPLC/DAD conditions − HPLC analysis was conducted using reverse-phase HPLC system with an INNO C18 col- umn (25 cm × 4.6 mm, 5 μm). The injection volume was 10 μL and was monitored at 345 nm. It was conducted at room tem- perature and the flow rate was set at 1.0 mL/min. A gradient elution system was used for analysis. The mobile phase was composed of 0.5% acetic acid in water (A) and ACN (B).
The elutions were conducted as follows: 95% A at 0 min, fol- lowed by 75% A from 0 to 20 min, then 50% A from 20 to 45 min, 10% A from 45 to 55 min, and 95% A from 55 to 65 min, then maintained until 70 min.
Method validation − The specificity, accuracy, precision,
linearity, limit of detection (LOD), and limit of quantification
(LOQ) of the new HPLC method were validated. The HPLC
method was validated following the guidelines provided by
the International Council for Harmonisation of Technical
Requirements for Pharmaceuticals for Human Use (ICH).
18)The specificity of the method was tested to see whether
there was any interference between the retention times and
UV spectra of the standards and PS, and if the peaks indi-
cated the presence of the same compounds. HPLC method
accuracy was measured by conducting recovery tests in which
sample extracts were spiked with four different standard mix-
tures at various concentrations and calculating the % recov-
ery of the compound in the extract. To validate precision, three
different concentrations of sample extracts were used for intra-
day (repeatability) analysis, and only one concentration for
the inter-day (intermediate precision) analysis which was
repeated five times. Intra and inter-day precision were exam-
ined by calculating the percent of relative standard deviation
(% RSD) of the standard on the same day and on three dif-
ferent days, respectively. Linearity was assessed by using five
concentration levels of standard solution (0.00625-0.1 mg/mL)
with three injections. Using the peak areas measured at 345 nm
on the chromatogram, a calibration curve was plotted against
Fig. 1. Chemical structure of 6-HLG (6-hydroxyluteolin 7-O-
glucoside).
the known concentrations of the standard solutions. Linear least-squares regression was used to analyze the standard curve of 6-HLG, and the correlation coefficient (r
2) of the regression formula were used to validate the linearity. The calibration curve of standard compound was obtained by fitting, and the standard deviation values of the intercept (σ) and the slope (S) were used to calculate the LOD and LOQ.
The LOD is the lowest amount or concentration of analyte that can be reliably distinguished from the base line and the LOQ is the lowest amount of analyte that can be quantified with acceptable repeatability and accuracy. The standard deviation of the response and the slope of calibration were used to obtain the LOD and LOQ values. The LOD and LOQ were derived using the following formulas: LOD = 3.3 (σ/S) and LOQ = 10 (σ/S).
Calibration curve − A calibration curve was prepared by plotting the concentrations of the standard solution with their respective peak areas. The linearity of the cal- ibration curve was determined based on the correlation coefficient (r
2), and the 6-HLG concentrations in the sam- ples were then calculated from the calibration curve. The calibration functions were determined based on the peak area (Y), concentration (X, μg/mL), and mean ± standard deviation (n = 3).
Results and Discussion
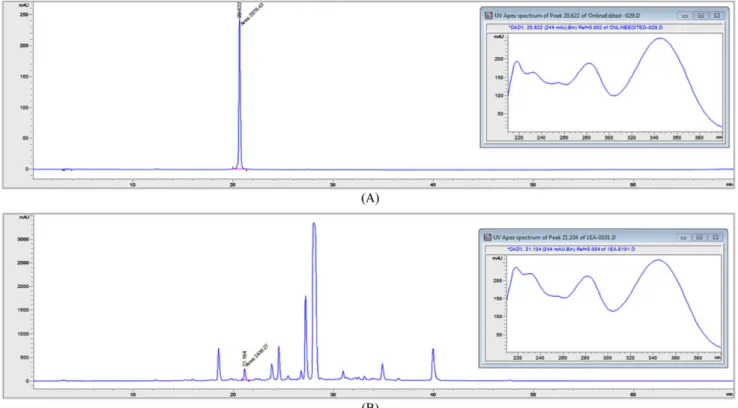
An HPLC analytical method used to quantify 6-HLG was developed and validated. 6-HLG was analyzed using HPLC/
DAD, and the results are shown in Fig. 2. Good separation was achieved using our HPLC method with the retention time at 20.8 min. A wavelength of 345 nm was the most effective wavelength for quantifying the main compound 6- HLG and all impurities in a single run. There was no inter- ference in detecting the retention time showing a fine peak resolution of 6-HLG, suggesting that the validated method has high level of accuracy. The chromatograms in Fig. 2 shows absolute separation and the UV spectra showed good detection of 6-HLG. Thus, we can find that 6-HLG is present in PS from their corresponding retention time and UV spectra in Fig. 2. Our findings suggest a good validation of the HPLC approach as it achieved the specificity of the 6-HLG study found in the PS. The quantification parameters for 6-HLG were tested under the HPLC conditions described above. A calibration curve for the isolated compound was constructed by mapping the peak areas of the prepared concentrations, and linear regression was used to assess the linearity. For the evaluation of linearity, five solutions were used with a con- centration range of 0.00625-0.1 mg/mL (n = 3). The regres-
Fig. 2. HPLC chromatograms and specificity of 6-HLG (A) and PS (B).
sion equation was calculated by plotting the peak area (y) versus the 6-HLG concentration (x) expressed in mg/mL.
The correlation coefficient (r
2= 1.0000) obtained for the regression line indicated a strong linear relationship between the peak area (Table I) and 6-HLG concentration.
The LOD of 6-HLG is the minimum concentration of the compound that can be detected, and it can be determined using an analytical method and the HPLC instrument. Conversely, the LOQ is the minimum concentration of the analyzed com- pound that can be quantified with fine precision and accuracy using the instrument and the analytical method. The LOD value obtained in our study was 3.60 μg/mL, whereas the LOQ value was 10.90 μg/mL, indicating that the analytical method used to calculate 6-HLG derived from PS achieved high sen- sitivity to quantifying 6-HLG (Table I).
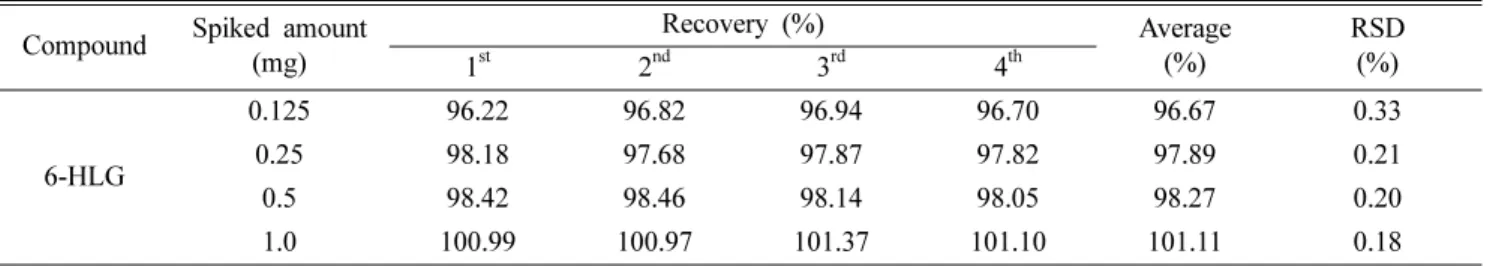
The PS (50 mg/mL) was spiked with four concentrations of 6-HLG and the recovery was evaluated to check the accuracy of the analytical method developed. Quadruplet analyses were conducted using four injections. As shown in Table II, recov- ery rates for 6-HLG ranged from 96.2-101.4%. Acceptable recovery values have been obtained indicating that the ana- lytical method we used to calculate 6-HLG has achieved high accuracy.
Precision was confirmed by measuring the intra-day and inter-day precision levels of the analytical method used for 6-
HLG. The results of the analysis are summarized in Table III and IV. The coefficient of variance of the precision values for 6-HLG ranged from 0.19 to 0.41% for intra-day precision experiments and 0.19 to 0.28% for inter-day precision exper- iments. The values obtained were lower than 2%, which meets the criteria recommended by the ICH guidelines. The results indicated that the analytical method to quantify 6-HLG derived from PS showed great reliability. Furthermore, when comparing the intra- and inter-day RSD mean values, a minor difference was observed between the two, but the latter val- ues were slightly lower. It indicates that these compounds are relatively stable after being dissolved over time.
There have been many studies about flavonoids. Flavo- noids are major classes of plant secondary metabolites having huge diversity in their structures, making them valuable. Fla- vonoids can play many roles in the human body such as skin protection from ultraviolet A/B radiations, anti-photoaging,
19)anti-inflammatory, anti-aging,
20)anti-allergic, hepatoprotec- tive, neuroprotective, anti-obesity, osteogenic activity, anti- diabetic, anti-viral, anti-diarrheal, anti-fungal, anti-microbial activities, etc.
21-24)Glycosidic flavonoids synthesized in plants are used in response to certain abiotic stresses, like drought, high and low temperatures
25)and ultraviolet radiations.
26)6-HLG, a type of glycosidic flavonoid, is a luteolin deriv- ative. Luteolin belongs to the family of flavonoids existing in Table I. Linearity, LOD and LOQ of 6-HLG
Compound t
RRange (mg/mL) Calibration equation
ar
2 bLOD (µg/mL) LOQ (µg/mL)
6-HLG 20.6 0.00625-0.1 Y = 26109 X + 13.939 1.0000 3.5968 10.8995
a
Y = peak area, X = concentration of standards (mg/mL).
b