RAPD Variation and Phenetic Relationships for Six Populations of Equisetum pratense in Korea
Man Kyu Huh
1*, Jaewon Choi
2, Jangseop Lee
2, Bogye Jin
2and Hyun Kyung Kim
21
Department of Molecular Biology, Dongeui University, Busan 614-714, Korea
2
Busanil Science High School, Busan 604-828, Korea
Received March 10, 2014 /Revised June 22, 2014 /Accepted June 24, 2014
The phenetic relationships among six natural populations of Equisetum pratense in Korea were inves- tigated at the population level by constructing a tree based on Random Amplified Polymorphic DNA (RAPD) markers. RAPD analysis was also conducted to estimate genetic diversity and the population structure of E. pratense. A mean of 26.7% at the six population levels indicated polymorphism. E. pra- tense was found to have fewer alleles per locus (1.267) and fewer effective alleles per locus (1.176).
Genetic diversity (0.102) in E. pratense is lower than the average for species with similar life history traits. Total genetic diversity values (H
T) varied between 0.112 (OPD-07) and 0.445 (OPD-16), for an average overall polymorphic locus of 0.141. Inter-locus variation in the within-population genetic di- versity (H
S) was low (0.102). Asexual reproduction, small population size, and the colonization process are proposed as possible factors contributing to the observed low genetic diversity in E. pratense. On a per-locus basis, the proportion of total genetic variation due to differences among populations (G
ST) ranged from 0.129 for OPD-07 to 0.455 for OPD-09, with a mean of 0.277. This indicated that about 27.7% of the total variation was among populations. Thus, genetic variation (72.3%) resided within populations. This study contributes new information for research on the taxonomy and population ge- netics of E. pratense.
Key words : Equisetum pretense, genetic diversity, genetic variation, population structure, random amplified polymorphic DNA (RAPD)
*Corresponding author
*Tel : +82-51-890-1529, Fax : +82-51-890-1521
*E-mail : [email protected]
This is an Open-Access article distributed under the terms of the Creative Commons Attribution Non-Commercial License (http://creativecommons.org/licenses/by-nc/3.0) which permits unrestricted non-commercial use, distribution, and reproduction in any medium, provided the original work is properly cited.
Journal of Life Science 2014 Vol. 24. No. 6. 612~617 DOI : http://dx.doi.org/10.5352/JLS.2014.24.6.612
Introduction
To survive a plant population must be adapted to its im- mediate environment [13]. For a natural population to be adapted to a local area or region, most of the individuals in it must possess genotypes and phenotypes that enable them to survive and reproduce. Its genetic structure must be sufficiently malleable that new genotypes can arise and be perpetuated in response to inevitable changes in the environment. Population genetics is about the information and collection of genes belonging to all the members of a population taken together [19].
Equisetum is a "living fossil" and has a history stretching back to the Cretaceous and possibly as far back as the Triassic [2]. Equisetum was much more diverse and domi-
nated the understory of late Paleozoic forests. As a result, Equisetum may perhaps be the oldest living genus of vascular plants [8].
Equisetum pratense Ehrh is commonly known as meadow horsetail, shade horsetail or shady horsetail and the species is a plant species belonging to the division of horsetails (Equisetophyta). Shade horsetail can be commonly found in forests with shade or moisture. They also tend to grow closer and thicker around streams, ponds and rivers. E. pratense has green, bottlebrush-like perennial, from spreading rhi- zomes and is erect, hollow, and slender. The height of plants is 10-50 cm tall and the thick of plants has 1-4 mm [17].
Fertile stems grow at first without chlorophyll. Becoming green and growing branches after spores are shed. Sterile stems are mostly single, whitish green, with 10-18 minutely roughened ridges and many whorled branches are fine, 3 -sided, and a central cavity 1/6 to 1/3 the diameter of the stem [17].
Although molecular and biochemical approaches are in-
creasingly being applied to address the taxonomic and phy-
logenic relationships within animals and plants in Korea [9],
no population genetics studies have been conducted, espe-
Table 1. The symbol of populations used in this study and geo- graphic location
Symbol Population Region
P1 P2 P3 P4 P5 P6
Yecheon Sancheong
Uiryeong Juchon
Jinhae Busan
Yongmun-meon, Yecheon -gun, Gyeonsangbuk-do
Samjang-meon, Sancheong-gun, Gyeonsangnam-do
Daeeui-meon, Uiryeong-gun, Gyeonsangnam-do Juchon-meon, Kimhae-si,
Gyeonsangnam-do Jinhae-gu, Changweon-si,
Gyeonsangnam-do
Dangri-dong, Saha-gu, Busan-si
cially on the population genetic structure of E. pratense.
Therefore, detailed studies, in particular at the DNA level, on genetic diversity of natural populations of E. pratense, and genetic relationships among populations are necessary from the viewpoint of plant evolution. Such lack of information limits understanding of speciation, adaptation, or genetic change, which requires knowledge of genetic patterns and process by which they are modified. This knowledge is cru- cial for developing program to protect and preserve the ge- netic resources of plant species.
Random amplification of polymorphic DNA (RAPD) is a type of PCR reaction, but the segments of DNA are ampli- fied randomly. The RAPD analysis described by Williams et al. [21] is a commonly used molecular marker in genetic diversity studies. RAPD assay has been useful in determin- ing genetic relationships among closely related species [3, 18]. RAPD analysis is quick, robust, requires minimal pre- liminary work [14]. Perhaps the main reason for the success of RAPD analysis is the gain of a large number of genetic markers that require small amounts of DNA without the re- quirement for cloning, sequencing or any other form of the molecular characterization of the genome of the species in question [1]. In this study six populations of E. pratense from Korea were analyzed for RAPD markers. We expected that the RAPD analyses assess the amount and structure of ge- netic diversity within and among populations and we suc- cessfully assess the genetic relationships among the local populations of E. pratense in Korea.
The objective of study is to estimate the level of genetic diversity in the species. We wanted to detect the pattern of differentiation and speciation using RAPD makers.
Materials and Methods Plant materials
Six populations of E. pratense in Korea were collected for this study (Table 1).
From April 2013 to July 2013, fifteen plants per each pop- ulation were randomly sampled and their leaves were used for molecular analysis. The distance between the selected in- dividuals was about 20 m to avoid including individuals emanating from the same rhizome.
Genomic DNA isolation and RAPD analysis DNA was extracted using the plant DNA Zol Reagent (Life Technologies Inc., Grand Island, New York, USA) ac-
cording to the manufacturer’s protocol. Twenty arbitrarily chosen 10-mer primers, the kit A (OPA-01 to 20) and kit D (OPD-01 to 20) of Operon Technologies (Alameda, Co., USA) were used. Amplification reactions were performed in 0.6 ml tubes containing 2.5 μl of the reaction buffer, 10 mM Tris-HCl (pH 8.8), 1.25 mM each of dATP, dCTP, dGTP, dTTP, 5.0 pM primer, 2.5 units Taq DNA polymerase, and 25 ng of genomic DNA. All the reactions were repeated twice and only reproducible bands were scored for analyses.
The amplification products were separated by electro- phoresis on 2.0% agarose gels, stained with ethidium bro- mide, and photographed under UV light using Alpha Image TM (Alpha Innotech Co., USA). A 100 bp ladder DNA mark- er (Pharmacia) was used in the end of for the estimation of fragment size.
Data analysis
All monomorphic and polymorphic RAPD bands visible by eye were scored and only unambiguously scored bands were used in the analyses. Each polymorphic RAPD band was given a score of 1 for presence or 0 for absence. Several standard genetic parameters were estimated using the com- puter program, POPGENE ver. 1.31 [22]. The percentage of polymorphic loci (Pp), mean number of alleles per locus (A), effective number of alleles per locus (A
E), Nei’s [15] gene diversity (H), and Shannon’s Information index (I) [11].
The estimation of genetic similarity (GS) between geno-
types was based on the probability that an amplified frag-
ment from one individual will also be present in another
[16]. GS = 2× Number of shared fragment between A and
B / (Number of fragment in A + Number of fragment in
B). GS was converted to genetic distance (1-GS) [10].
Table 2. List of decamer oligonucleotide utilized as primers, their sequences, and associated polymorphic frag- ments amplified in the
E. pratense
test array No. ofPrimer Sequence (5’ to 3’)
No. of Fragments
detected
No. of Polymorphic
loci OPA-13
OPA-15 OPA-19 OPD-03 OPD-07 OPD-08 OPD-09 OPD-12 OPD-16 OPD-20
CAGCACCCAC TTCCGAACCC CAAACGTCGG GTCGCCGTCA TTGGCACGGG
GTGTGCCCCA CTCTGGAGAC CACCGTATCC AGGGGTAAG ACCCHHYCAC
45 89 9 77 65 8
34 65 4 54 33 4
Total 68 41
A B
Fig. 1. The RAPD profiles generated by primer of OPA-19 (A) and OPD-07 (B) that resolved in 2.0% agarose gel. M is a DNA size marker (100 bp ladder). P1~P6 are same symbols in Table 1.
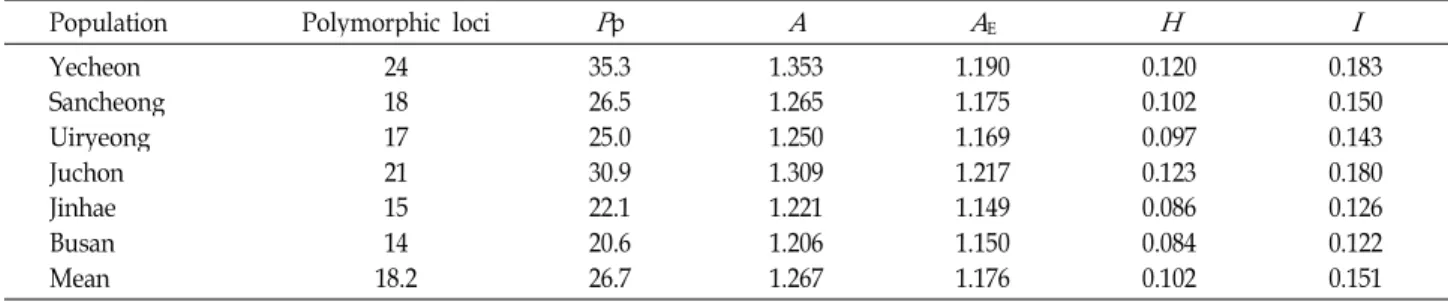
Table 3. Measures of genetic variability for RAPDs generated among six populations of
E. pratense
Population Polymorphic loci
P
pA A
EH I
Yecheon Sancheong Uiryeong Juchon Jinhae Busan Mean
24 18 1721 1514 18.2
35.3 26.5 25.030.9 22.120.6 26.7
1.353 1.265 1.250 1.309 1.221 1.206 1.267
1.190 1.175 1.169 1.217 1.149 1.150 1.176
0.120 0.102 0.097 0.123 0.086 0.084 0.102
0.183 0.150 0.143 0.180 0.126 0.122 0.151
Nei's gene diversity formulae (H
T, H
S, and G
ST) were used
to evaluate genetic diversity within and among populations [15]. The G
STcoefficient corresponds to the relative amount of differentiation among populations. Furthermore, gene flow (Nm) between the pairs of species was calculated from G
STvalues by Nm =0.5(1/G
ST-1) [12].
Cluster analyses
A phenetic tree was constructed by the neighbor joining (NJ) method [20] using the NEIGHBOR program in PHYLIP version 3.57 [4].
Results
From the 40 decamer primers used for a preliminary RAPD analysis, ten primers produced good amplification products both in quality and variability (Table 2). The re- maining primers either did not amplify or showed unclear amplification across all genotypes. For example, Fig. 1 showed the RAPD profiles at the isolate level using gen- erated by primer of OPA-19 and OPD-07. P3 is different from other populations in the OPA-19 primer and P3~P6 had spe- cific band in last second lines from bottom in OPD-07.
In a simple measure of inter-populations variability i.e.
the percentage of polymorphic bands, the Yecheon pop-
ulation exhibited the highest variation (35.3%) among pop-
ulations and the Busan population the lowest (20.6%) (Table
3). The average number of alleles per locus (A) was 1.267
across species, varying from 1.206 to 1.353. The effective
numbers of alleles per locus (A
E) at the lowest population
Table 4. Estimates of genetic diversity statistics and 41 poly- morphic loci in
E. pratense
. Total genetic diversity (H
T);genetic diversity within populations (
H
S), proportion of total genetic diversity partitioned among pop- ulations (G
ST), and gene flow (Nm
)Locus
H
TH
SG
STNm
OPA-13 OPA-15 OPA-19 OPD-03 OPD-07 OPD-08 OPD-09 OPD-12 OPD-16 OPD-20 Mean
0.294 0.320 0.156 0.149 0.112 0.263 0.156 0.187 0.445 0.358 0.141
0.204 0.2065
0.135 0.112 0.100 0.226 0.058 0.077 0.375 0.249 0.102
0.266 0.388 0.134 0.226 0.129 0.144 0.455 0.359 0.165 0.336 0.277
3.878 1.209 3.665 2.562 3.838 1.214 1.612 2.047 4.490 1.180 1.308
Table 5. Similarity matrix (above diagonal) of six populations based on RAPD and genetic distances (below diagonal)
Population Yecheon Sancheong Uiryeong Juchon Jinhae Busan
Yecheon Sancheong Uiryeong Juchon Jinhae Busan
0.0749- 0.0404 0.0163 0.0188 0.0531
0.9278 - 0.0929 0.0803 0.0791 0.1126
0.9604 0.9113 0.0272- 0.0461 0.0539
0.9838 0.9228 0.9731
- 0.0214 0.0524
0.9814 0.9240 0.9550 0.9788
- 0.0389
0.9483 0.8935 0.9475 0.9489 0.9618
-
Nei's genetic distance
0.4 0.3 0.2 0.1 0.0
P1 P2 P3 P4 P5 P6 0.1 changes
Fig. 2. A phenogram showing the genetic relationships among six populations of
E. pratense
based on RAPD analysis. Symbols are shown in Table 1.and the highest population level were 1.150 and 1.190, respectively. The mean genetic diversity within species was 0.102. Overall, the Yecheon and Juchon populations ex- hibited high variation among populations. The Busan and Jinhae populations were shown the low genetic variation . Total genetic diversity values (H
T) varied between 0.112 (OPD-07) and 0.445 (OPD-16), for an average over all poly-
morphic loci of 0.141 (Table 4). Interlocus variation in the within-population genetic diversity (H
S) was low (0.102). On a per-locus basis, the proportion of total genetic variation due to differences among populations (G
ST) ranged from 0.129 for OPD-07 to 0.455 for OPD-09, with a mean of 0.277.
This indicated that about 27.7% of the total variation was among populations. Thus, about genetic variation (72.3%) re- sided within populations. The estimate of gene flow, based on G
ST, was slightly high among populations of E. pratense (N
m=1.308). Values of genetic distance (D) were <0.113 (Table 5). Genetic identity values among pairs of populations ranged from 0.894 to 0.984. Genetic distances between pop- ulations were low. Thus, there was not shown significant difference among six populations.
Clustering of E. pratense, using the NJ algorithm, was per- formed based on the matrix of calculated distances (Fig. 2).
Six populations of E. pratense were well separated each other.
The phylogenic tree showed two distinct groups; Yecheon and Sancheong clade and the other populations.
Discussion
Technological advances, especially in the area of bio-
chemical genetics, have also contributed to the increased in- terest in plant populations [5]. For example, Hamrick et al.
[7] demonstrated that species which were widespread, long lived, primarily outcrossed by wind pollination maintained higher levels of intrapopulation genetic variation than spe- cies with other combinations of these characteristics.
Genetic diversity of Korean E. pratense is comparable with other species, although the use of different methods (e.g., isozyme [co-dominant marker] and RAPD [dominant mark- er], the number of loci, populations sampled, and the en- zyme systems studied) may preclude meaningful direct comparisons. Genetic diversity in E. pratense is low in com- parison that of most plant species. For example, the genetic diversity of Korean E. pratense at the species level (mean H
ES= 0.064) is lower than that of selfing breeding system (0.124) or the mode of sexual and asexual reproduction (0.138), tem- perate-zone species (0.146), sexual reproduction (0.151), and species with widespread geographic ranges of plant species (0.202) [6]. The same trend is observed at the other genetic parameters.
The relatively low level of genetic variation found in E.
pratense is consistent with several aspects of its biology. First, the breeding system of E. prolifera has an important role in genetic variability. Predominantly asexual reproduction spe- cies tend to have less genetic diversity overall and to main- tain less variation within their species than species with higher proportion of sexual reproduction species [6, 7].
Equisetum species have a remarkable ability to reproduce vegetative [8]. This helps to compensate for the inefficiency of spore reproduction. The fertile and sterile stems are dissimilar. Fertile stems are rare, unbranched at first and lat- er develop many whorls of branches. Fertile stems grow at first without chlorophyll. Becoming green and growing branches after spores are shed. Sterile stems are mostly single. First branch segment is not longer than adjacent stem sheath. Second, high genetic diversity is associated with the species’ colonizing success [6]. Korean E. pratense do not have maintained a considerable amount of variation during the colonization process despite being mostly distribution of East Asia. Korean species are almost located in marginal of north limitation of growth. During spread, many in- dividuals lost their comrade and gene pool of natural selection.
Although we did not analyze further subdivision of a lo- cal population, we may infer that RAPD variation that re- sided mainly within E. pratense species is maintained in
patchily distributed subpopulations or demes, either by ran- dom drift of neutral alleles or micro- environmental selection for adaptive alleles [19].
However, no great local differentiation of RAPD variation of cultivated populations was observed. Gene flow between species was not relatively great. The estimated Nm was 0.870. However gene flow (Nm) among cultivated pop- ulations was high (Nm =2.184). Hence, we can expect weak or low gene flow. The movement of plants may have results in high gene flow chance and little spatial genetic differentiation.
In a phenetic tree based on RAPD variability, the position of the species in the NJ tree and their geographical position almost completely matched in the Korean species (Fig. 2).
Six populations showed a close relationship between their phenetic and geographical positions. The uneven dis- tribution of locality specific bands could be explained by iso- lation-by-distance. Thus, RAPD markers are very effective in classifying natural populations of E. pratense in Korea.
References
1. Bardakci, F. 2001. Random amplified polymorphic DNA (RAPD) markers.
Turk J Biol
25, 185-196.2. Channing, A., Zamuner, A., Edwards, D. and Guido, D.
2011.
Equisetum thermale
sp. nov. (Equisetales) from the Jurassic San Agustín hot spring deposit, Patagonia: anat- omy, paleoecology, and inferred paleoecophysiology.Am J Bot
98, 680-697.3. Demeke, T., Adams, R. P. and Chibbar, R. 1992. Potential taxonomic use of random amplified polymorphic DNA (RAPD): a case study in
Brassica
.Theor Appl Genet
84, 990-994.4. Felsenstein, J. 1993. PHYLIP (Phylogeny Inference Package) version 3.5s. Distributed by the author. Department of Genetics, Univ. Washington, Seattle.
5. Hamrick, J. L. 1982. Population genetics and evolution.
Am J Bot
69, 1685-1603.6. Hamrick, J. L. and Godt, M. J. W. 1989. Allozyme diversity in plant species. In Plant population genetics, breeding and genetic resources, pp. 43-63, In: Brown A. D. H., Clegg, M.
T., Kahler, A. L., and Weir, B. S. (eds.), Sinauer Press, Sunderland, Mass.
7. Hamrick, J. L., Godt, M. J. W. and Sherman-Broyles, S. L.
1992. Factors influencing levels of genetic diversity in woody plant species.
New Forests
6, 95-124.8. Hauke, R. L. 1963. A taxonomic monograph of the genus
Equisetum
subgenusHippochaete
.Nova Hedwigia
8, 1-123.9. Huh, M. K. 2001. Allozyme variation and population struc- ture of
Carex humilis
var.nana
(Cyperaceae) in Korea.Can
J Bot
79, 457-463.초록:한국 내 물쇠뜨기 6개 집단의 RAPD 변이와 표현형 관계 허만규
1*․최재원
2․이장섭
2․진보규
2․김혜경
2(
1동의대학교 분자생물학과 ,
2부산일과학고등학교 )
한국 내 물쇠뜨기 여섯 개 자연 집단의 표현형적 유연 관계를 RAPD 마커에 근거하여 집단수준에서 조사하였
다 . 또한 RAPD로 물쇠뜨기 집단의 유전적 다양성과 집단구조를 분석하였다. 물쇠뜨기는 평균 26.7%의 유전적
다형성을 나타내었다 . 물쇠뜨기는 대립유전자좌위당 적은 수의 좌위(1.267)와 유효한 유전자좌위(1.176)를 나타내
었다 . 물쇠뜨기의 유전적 다양도(H)는 0.102로 유사한 생활사를 가진 다른 종에 비해 낮았다. 전체 유전적 다양도
(H
T)는 0.112(OPD-07)에서 0.445(OPD-16)까지였으며 평균은 0.141이었다. 전체 유전적 다양도에서 집단 내 다양 도 (H
S)는 0.102로 낮았다. 이런 낮은 물쇠뜨기의 다양도는 무성적 생식, 작은 집단 크기, 집단화 과정 등으로 설명
될 수 있었다 . 유전자좌위에 근거한 집단간 분화를 나타내는 다양도는 비율은 OPD-07의 0.129에서 OPD-09에
0.455로 평균은 0.277이었다. 전체 유전적 변이에서 집단간 변이는 27.7%였으며 나머지 변이의 72.3%는 집단 내에
있었다 . 본 결과는 물쇠뜨기의 분류학적 연구 및 집단유전학에 기여할 수 있을 것이다.
10. Le Thierry d’Enneequin, M., Poupance, B. and Starr, A.
2000. Assessment of genetic relationships between
Setaria italica
and its wild relativeS. viridis
using AFLP markers.Theor Appl Genet
100, 1061-1066.11. Lewontin, R. C. 1972. The apportionment of human diversity.
Evol Biol
6, 381-398.12. McDermott, J. M. and McDonald, B. A. 1993. Gene flow in plant pathosystems.
Ann Rev Phytopathy
31, 353-373.13. Mettler, L. E., Gregg, T. G. and Schaffer, H. E. 1988.
Population Genetics and Evolution. Prentice Hall, Engle- wood Cliffs, NJ.
14. Molnar, S. J., James, L. E. and Kasha, K. J. 2000. Inheritance and RAPD tagging of multiple genes for resistance to net blotch in barley.
Genome
43, 224-231.15. Nei, M. 1973. Analysis of gene diversity in subdivided populations.
Proc Natl Acad Sci USA
70, 3321-3323.16. Nei, M. and Li, W. H. 1979. Mathematical model for studing genetical variation in terms of restriction endonucleases.
Proc Natl Acad Sci USA
74, 5267-5273.17. Polunin, N. 1952.
Equisetum pratense
Ehrh. in Arctic Alaska.Am Fern J
42, 111-113.18. Quires, C. F., Hu, J., This, P., Chevre, A. M. and Delseny, M. 1991. Development and chromosomal localization of ge- nome-specific markers by polymerase chain reaction in
Brassica
.Theor Appl Genet
82, 627-632.19. Roughgarden, J. 1996. Theory of Population Genetics and Evolutionary Ecology: an Introduction. Prentice Hall, Upper Saddle River, NJ.
20. Tamura, K., Peterson, D., Peterson, N., Stecher, G., Nei, M.
and Kumar, S. 2011. MEGA5: Molecular evolutionary genet- ics analysis using maximum likelihood, evolutionary dis- tance, and maximum parsimony methods.
Mol Biol Evol
28, 2731-2739.21. Williams, J. G. K., Kubelik, A. R., Livak, K. J., Rafalski, J.
A. and Tingey, S. V. 1990. DNA polymorphisms amplified by arbitrary primers are useful as genetic markers.
Nucleic Acids Res
18, 6531-6535.22. Yeh, F. C., Yang, R. C. and Boyle, T. 1999. POPGENE Version 1.31, Microsoft Windows-based Freeware for Population Genetic Analysis. University of Alberta, Alberta.