The difference of selectivity of gill net between least square method with polynomials in Kitahara s and maximum
likelihood analysis
Hae-Hoon P
ARK*, Russell B. M
ILLAR1, Bong-Seong B
AE2, Heui-Chun A
N2, and Seon-Jae H
WANG3Fisheries System Engineering Division, National Fisheries Research and Development Institute, Busan 619-705, Korea
1
Department of Statistics, University of Auckland, Private Bag 92019, Auckland 1142, New Zealand
2
East Sea Fisheries Research Institute, NFRDI, Gangwon-do 210-861, Korea
3
Fisheries Resources Research Division, National Fisheries Research and Development Institute, Busan 619-705, Korea
This paper showed the difference between the selectivity of gill net by least square method with polynomials in Kitahara s and that by maximum likelihood analysis for Japanese sandfish and Korean flounder. Catch experiments for Japanese sandfish using commercial vessels off the eastern coast of Korea were conducted with six different mesh sizes between October and December 2007 and those for Korean flounder with five different mesh sizes between 2008 and 2009. The mesh size of 50% probability of catch corresponding to biological maturity length of fish was not different between that by least square method and that by maximum likelihood analysis for Japanese sandfish, however, a little different for Korean flounder, that is, those mesh sizes of 50% probability of catch for biological maturity length of Korean flounder were 10.6cm and 10.1cm by least square method and maximum likelihood analysis, respectively.
Keywords: Selectivity, Gill net, Kitahara s method, Least square method, Maximum likelihood analysis, Japanese sandfish, Korean flounder
*Corresponding author: [email protected], Tel: 051-720-2571, Fax: 051-720-2586
.
, ,
.
,
.
(Losanes et al., 1992; Fujimori et al., 1996;
Millar and Fryer, 1999; Park et al., 2003, 2004;
Jeong et al., 2009).
Baranov
Ishida Kitahara (1968) ,
,
. Kitahara
Master .
(Fujimori et al., 1996).
.
,
. Kitahara
.
Millar
,
( ) (
) SELECT
.
(Millar, 1992;
Wileman et al., 1996),
(Millar and Fryer, 1999; Fujimori and Tokai, 2001;
Santos et al., 2003; Park et al., 2007).
(Hiramatsu, 1992) , (parameter)
.
.
.
,
( )
.
( , maximum likelihood method) (least square method)
Kitahara
.
( )
Baranov
Kitahara
.
mi ljCij
.
Cij s (lj
/ m
i)
qi Xi dj(1) , q
imi
,
Xi
mi ,
dj j
. ,
Cij
.
cij Cij
/ X
i s (lj/ m
i)
qi dj(2)
(3) .
ln s (l
j/ m
i) ln c
ijln (q
i dj) (3) (3)
. Kitahara
Fujimori et al. (1996) (4) .
ln s (R) a
nR
na
n 1R
n 1a
n 2R
n 2a
0(4)
, R
lj/ m
i. 1
, s (R) (5)
.
s (R) exp{(a
nR
na
n 1R
n 1a
n 2R
n 2a
0) F
max} (5)
, F
max(4) ,
(Kim and Lee, 2002). (4) (
) ,
E
Σ
i[ln s (R) ln ˜s (R)]
2(6)
, s (R) , ˜s (R)
.
2 3 , 4
. 2
3 .
, (
)
(Millar, 1992; Millar and Fryer, 1999; Fujimori and Tokai, 2001; Santos et
al., 2003). (Poisson)
, j
(Santos et al., 2003).
n
ljPois (p
j(l), λ
l, r
j(l)) (7)
, n
ljj
l
, p
j(l) λ
lr
j(l) . p
jl
j
, λ
ll
, r
j(l) .
n
lj(log-likelihood)
Σ
iΣ
j{n
llog
e{p
jλ
lr
j(l)}
pjλ
lr
j(l)} (8)
SELECT
(y
ljn
lj/ n
l) ( , n
l), λ
lpjrj
(l)
ϕ
lj________ (9)
Σ
j pjrj(l)
, (y
lj)
.
Σ
iΣ
jn
ljlog
e(ϕ
lj) (10)
( )
. ,
, .
, 3
( )
.
2 3
,
(normal) , ,
, skew-normal , binormal
AIC ,
.
(Jeong et al., 2009) .
2007 ,
6 (36.4, 39.4, 45.5, 51.5, 53.0, 57.6mm)
Table 1
Table 2 .
2008 12 2009 6
, ,
,
( ) 3 (
0.284mm), 60.6, 72.7, 90.9,
121.2, 151.5mm 5 20
.
Table 3 .
Table 1
Kitahara 3
Fig. 1 .
. Table 1
.
3 .
Fig. 2 .
Table 2
Kitahara 3
Fig. 3 . Fig.
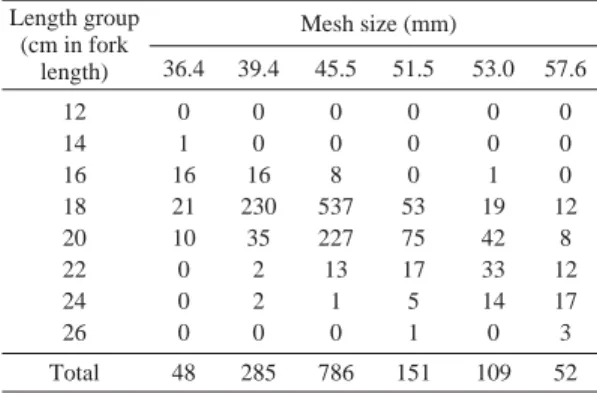
Table 1. Length frequency of female Japanese sandfish (Arctoscopus japonicus) caught by gill net with six different mesh sizes near Gosung, Korea from October to December 2007
Length group Mesh size (mm) (cm in fork
length) 36.4 39.4 45.5 51.5 53.0 57.6
12 0 0 0 0 0 0
14 1 0 0 0 0 0
16 16 16 8 0 1 0
18 21 230 537 53 19 12
20 10 35 227 75 42 8
22 0 2 13 17 33 12
24 0 2 1 5 14 17
26 0 0 0 1 0 3
Total 48 285 786 151 109 52
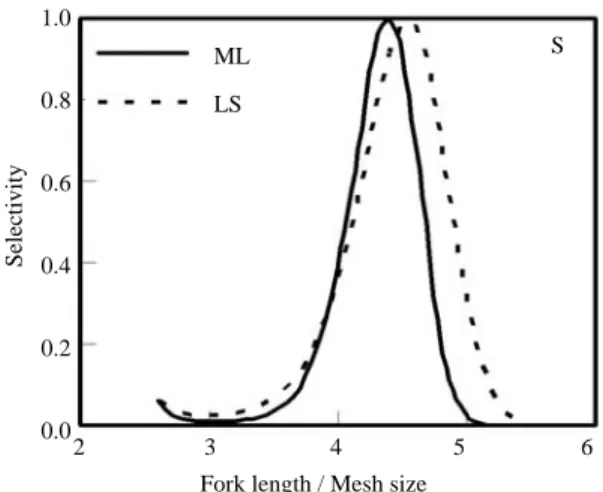
3
,
Table 2 36.4mm
19cm 1
Fig. 3 .
. ,
Fig. 3
,
. Fig. 4
. 50%
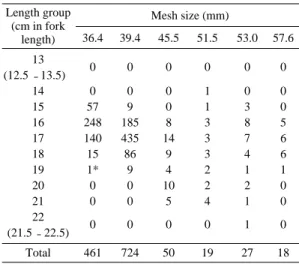
Table 2. Length frequency of male Japanese sandfish (Arctoscopus japonicus) caught by gill net with six different mesh sizes near Gosung, Korea from October to December 2007
Length group Mesh size (mm) (cm in fork
length) 36.4 39.4 45.5 51.5 53.0 57.6
13 0 0 0 0 0 0
(12.5 13.5)
14 0 0 0 1 0 0
15 57 9 0 1 3 0
16 248 185 8 3 8 5
17 140 435 14 3 7 6
18 15 86 9 3 4 6
19 1* 9 4 2 1 1
20 0 0 10 2 2 0
21 0 0 5 4 1 0
22 0 0 0 0 1 0
(21.5 22.5)
Total 461 724 50 19 27 18
Fig. 1. Master curve in logarithm by least square method with polynomials and data points (upper), that by maximum likelihood (lower) of mesh selectivity of gill net for female Japanese sandfish (Arctoscopus japonicus) caught near Gosung, Korea from October to December 2007.
Fig. 2. The comparison of the selectivity curves for female Japanese sandfish.
ML: maximum likelihood, LS: least square method.
6
4
2
0 8
6
4
2
0
-2
2 3 4 5 6 7
Fork length / Mesh size
Ln S
Ln S
0.8
0.6
0.4
0.2
0.0
2 3 4 5 6 7
Fork length / Mesh size ML S
LS
Relative selectivity Selectivity
* This is the catch corresponding to the largest ratio of fish length to mesh size (l/m) and the point illustrated as an arrow in right hand side of Fig.2.
.
Table 3
Fig. 5 .
,
.
Fig. 6 .
Table 4
16.7cm (NFRDI, 2007) 50%
45.4mm (1.50 ) , 44.2mm (1.46 ) ,
53.0mm (1.75 )
.
13.0cm 50%
31.6mm (1.04 )
Fig. 3. Master curve in logarithm by least square methodwith polynomials and data points (upper), that by maximum likelihood (lower) of mesh selectivity of gill net for male Japanese sandfish (Arctoscopus japonicus) caught near Gosung, Korea from October to December 2007.
Fig. 4. The comparison of the selectivity curves for male Japanese sandfish.
ML: maximum likelihood, LS: least square method.
8
6
4
2
0 8
6
4
2
0
-2
2 3 4 5 6
Fork length / Mesh size
Ln S Ln S
1.0
0.8
0.6
0.4
0.2
0.02 3 4 5 6
Fork length / Mesh size ML S
LS
Relative selectivity Selectivity
Table 3. Length frequency distribution of Korean flounder caught by gill net with five different mesh sizes near Sokcho, Yangyang and Yeongdeok, Korea from December 2008 to June 2009
Length group Mesh size (mm) (cm in fork
length) 60.6 72.7 90.9 121.2 151.5
13 1 2 1 0 0
17 212 31 7 4 1
21 119 192 43 7 5
25 22 78 69 11 3
29 1 1 7 7 2
33 0 0 2 4 2
Total 355 304 129 33 13
39.4mm (1.3 )
. ,
25.6cm 50%
106mm (3.50
) , 101mm (3.35 )
, 78.8
84.8mm (2.6 2.8 )
.
50%
,
Fig. 5. Master curve in logarithm by least square method with polynomials and data points (upper), that by maximum likelihood (lower) of mesh selectivity of gill net for Korean flounder (Glyptocephalus stelleri) caught near Yangyang, Sokcho, Yeongdeok, Korea from December 2008 to June 2009.
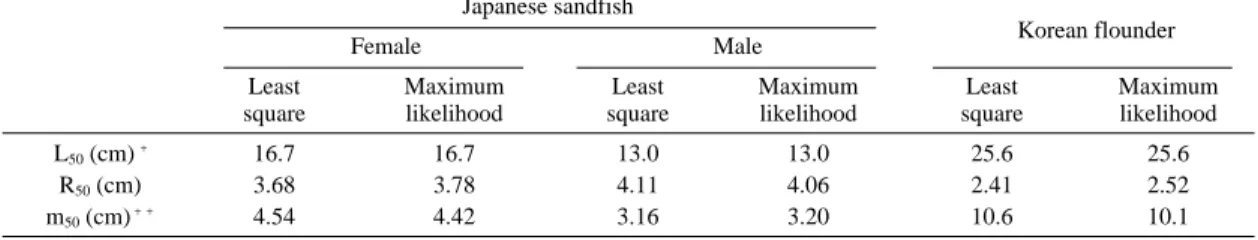
Table 4. The mesh size of 50% probability of catch corresponding to the biological maturity length of fish.
Japanese sandfish
Korean flounder
Female Male
Least Maximum Least Maximum Least Maximum
square likelihood square likelihood square likelihood
L50(cm) 16.7 16.7 13.0 13.0 25.6 25.6
R50(cm) 3.68 3.78 4.11 4.06 2.41 2.52
m50(cm) 4.54 4.42 3.16 3.20 10.6 10.1
6
5
4
3
2
1
0 6
5
4
3
2
1
0
0 1 2 3 4 5 6
Total length / Mesh size
Ln S
Relative selectivity
Fig. 6. The comparison of the selectivity curves for Korean flounder.
ML: maximum likelihood, LS: least square method.
1.0
0.8
0.6
0.4
0.2
0.00 1 2 3 4 5 6 7
Total length / Mesh size ML S
LS
Selectivity
Biological maturity length (cm).
Mesh size to catch the biological maturity length of fish with 50% probability.
.
Kitahara
3 3
( )
.
(normal) , ,
binormal , skew-normal .
,
.
Kitahara (least square method) ( , maximum likelihood analysis)
.
16.7cm 50%
45.4mm (1.50
) , 44.2mm (1.46 )
. 13.0cm
50%
31.6mm (1.04 ) , 32.0mm (1.06 ) .
. ,
25.6cm 50%
10.6cm (3.50 ) , 10.1cm
(3.35 )
. 50%
,
.
. (RP 2010 FE 015)
.
Fujimori, Y., T. Tokai, S. Hiyama and K. Matuda, 1996.
Selectivity and gear efficiency of trammel nets for kuruma prawn (Penaeus japonicus). Fish. Res., 26, 113 124.
Fujimori, Y. and T. Tokai, 2001. Estimation of gillnwt selectivity curve by maximum likelihood method.
Fisheries Science, 67, 644 654.
Hiramatsu, K., 1992. A statistical study of fish popultion dynamics using maximum likelihood method- parameter estimation and model selection-. Bull.
Nat. Res. Inst. Far Seas. Fish., 29, 57 114.
Jeong, E.C., H.H. Park, B.S. Bae, D.S. Chang, C.S., Kim, S.H. Choi and H.K. Cha, 2009. Size selectivity of gill net for male Japanese sandfish (Arctoscopus japonicus) off Gangwon in winter. J. Kor. Fish.
Soc., 42, 78 82.
Kim, S.H. and J.H. Lee, 2002. Mesh selectivity in trammel net for flat fish. Bull. Kor. Soc. Fish.
Technol., 38, 91 100.
Kitahara, T., 1968. On sweeping trammel net (Kogisasiami) fishery along coast of the San in district III. Mesh selectivity curve of sweeping trammel net for Branquillos. Bull. Jap. Soc. Sci.
Fish., 34, 759 763.
Losanes, L.P., K. Matuda and Y. Fujimori, 1992.
Estimating the entangling effect of trammel and
Res., 15, 229 242.
Millar, R.B., 1992. Estimating the size-selectivity of fishing gear by conditioning on the total catch. J.
Am. Stat. Assoc. 87, 962 968.
Millar, R.B. and R.J. Fryer, 1999. Estimating the size- selection curves of towed gears, traps, nets and hooks. Rev. Fish Bio. Fish. 9, 89 116.
NFRDI (National Fisheries Research & Development Institute), 2007. The report for examination of regulation of catch prohibition by fisheries resources. Busan, Korea, 1 327.
Park, C.D., H.C. An, S.K. Cho and C.I. Baik, 2003. Size selectivity of gill net for male snow crab, Chionoecetes opilio. Bull. Kor. Soc. Fish. Tech., 39, 143 151.
Park, C.D., E.C. Jeong, J.K. Shin, H.C. An and Y.
Fujimori, 2004. Mesh selectivity of encircling gill net for gizzard shad Konosirus punctatus in the
Park, H.H., R.B. Millar, H.C. An and H.Y. Kim, 2007.
Size selectivity of drum-net traps for whelk (Buccinum opisoplectum dall) in the Korean coastal waters of the East Sea. Fish. Res., 86, 113 119.
Santos, M.N., M. Gaspar, C.C. Monteiro and K. Erzini, 2003. Gill net selectivity for European hake Merluccius merluccius from southern Portugal:
implications for fishery management. Fisheries Science, 69, 873 882.
Wileman, D.A., R.S.T. Ferro, R. Fonteyne and R.B.
Millar, 1996. Manual of methods of measuring the selectivity of towed fishing gears. ICES Cooperative Research Report, No. 215, pp. 126.