Journal of the Environmental Sciences
Characterization of Volatile Organic Compounds in New Residential Buildings Before Moving-in
Seung-Ho Shin, Wan-Kuen Jo
*Department of Environmental Engineering, Kyungpook National University, Daegu 702-701, Korea
(Manuscript received 2 November, 2011; revised 29 November, 2011; accepted 12 January, 2012)
Abstract
This study investigated the characteristics of selected volatile organic compounds(VOCs) in newly-finished residential buildings, before the occupants moved in. This investigation was carried out by measuring the indoor and outdoor concentrations of selected VOCs before the occupants moved in and by utilizing an indoor mass balance model. Among 25 target VOCs, five aromatics(benzene, ethyl benzene, toluene, m,p-xylene, and o-xylene) were detected in all samples of both indoor and outdoor air. Toluene was most abundant VOC in the indoor air of new apartments, with a median value of 168 mg m-3. Unlike other VOCs, halogenated compounds would not be significantly emitted from building materials. The indoor air concentrations of all selected VOCs, except for 1,3,5-trimethyl benzene, exhibited significant correlations each other, while for outdoor air concentrations, five aromatics only were significantly correlated between them. The emission rate of toluene was higher for the current study(median value, 76.8 mg m-2 h-1) than for a previous study, while the emission rates of limonene, a-pinene and b-pinene(geometric means of 2.4, 13.8 and 9.6 mg m-2 h-1, respectively) were lower and the emission rates of m,p-xylene and 2-butanone(geometric means of 10.9 and 21.3 mg m-2 h-1, respectively) were similar. Although there were a few exceptions, the emission strengths are likely proportional to indoor temperature, and appear to reversely proportional to air exchange rate.
Key Words : Emission characterization, Building materials, Indoor model, New apartment, Air exchange rate
1)
1. Introduction
Residential buildings are one of most important microenvironments which are closely associated with individual exposure to volatile organic compounds (VOCs)(Gokhale et al., 2008; Jia et al., 2008). The VOC levels inside residential buildings are determined by various indoor sources as well as the penetration of outdoor VOCs into the building interiors. The outdoor VOCs in most urban areas originated primarily from anthropogenic sources such as vehicle
*Corresponding author : Wan-Kuen Jo, Department of Environ- mental Engineering, Kyungpook National University, Daegu 702-701, Korea
Phone: +82-53-950-6584 E-mail: [email protected]
emissions, combustion process of fossil fuels, petrochemical processes, and other industrial processes(Na and Kim, 2007; Roukos et al., 2009;
Leuchner and Rappenglück, 2010). The indoor VOC sources in residential buildings include building materials, furniture, household products(laundry detergents, glass cleaners, oven cleaners, furniture polishes, moth repellents, pesticides, etc.), cooking, and smoking(Gokhale et al., 2008; Kwon et al., 2008;
Han et al., 2011). Elevated VOC levels in residential
buildings, due to those indoor and outdoor sources,
have been linked to adverse health effects such as
sick building syndrome(SBS) such as irritation of the
eyes, nose, and throat, headache, and general fatigue
(Loh et al., 2006). In addition, individual exposure to
VOCs can cause harmful effects to the nervous
system, the development of cancers, and liver and kidney toxic effects(Delfino et al., 2003; OEHHA, 2005; Nielsen et al., 2007). These characteristics of VOCs derive to examine residents’ exposure levels to these compounds and to evaluate potential indoor sources for the establishment of effective control measures for indoor air quality management.
These control measures are suggested especially to occupants of new residential buildings, since high VOC concentrations have usually been reported in newly-built or renovated residential buildings compared to established residential buildings(Park and Ikeda, 2006). This high VOC levels in new buildings are mainly due to emissions from building and finishing materials such as floor coverings, wall papers, doors, and closets(Jia et al., 2010; Han et al., 2011).
Meanwhile, recent buildings are more tightly sealed for mainly energy savings, thereby inducing low ventilation conditions. In turn, VOCs emitted from building materials can more accumulate inside buildings under low ventilation conditions(Jia et al., 2010). Thus, a more conservative strategy is required to mitigate more indoor VOCs especially in newly-built apartment buildings. Consequently, various control programs have been operated by several countries for the improvement of indoor air quality(IAQ) in new buildings(Tuomainen et al., 2001; Järnström et al., 2006; Takigawa et al., 2009; Lim et al., 2011). In the United States(US), the US Environmental Protection Agency and the American Society of Heating, Refrigerating and Air-Conditioning Engineers have established national guidelines for the control of IAQ(Tuomainen et al., 2001). The Finish Society of Indoor Air Quality and Climate(FSIAQ) developed the Finnish Climate Classification, which defines design and target levels for the concentration of indoor VOCs and other IAQs(Järnström et al., 2006).
The FSIAQ also suggested to use low-emitting building materials. As part of a strategy for the control of the indoor VOCs in Japan, the Institute of
Public Health has performed a broad survey of indoor VOC levels in Japanese dwellings(Takigawa et al., 2009). In Korea, the IAQ Management Act that limits the concentration of VOCs in newly built apartment buildings was enforced by the Ministry of Environment and came into effect in May 2004(Lim et al., 2011). In addition, certain international guidelines have been established by the World Health Organization and the European Collaborative Action(Tuomainen et al., 2001).
The effective strategy will require sufficient information on emission characteristics of a wide range of VOCs in new residential buildings.
Nevertheless, this kind of information in newly-finished apartment buildings is hardly found in literature, warranting the need of collecting this information.
Accordingly, the present study was performed to investigate VOC emission characteristics in new residential buildings. This investigation was carried out by measuring the indoor and outdoor concentrations of selected VOCs before the occupants moved in, in order to estimate VOCs emitted from building materials only, excluding household products as other indoor sources. An indoor mass balance model was utilized for the calculation of surface area-specific emission strengths.
2. Methodology
2.1. Study protocol
This study was designed to collect a total of 100
indoor air samples from10 newly-built high-rise
apartment buildings(defined as 10 or more stories)
before occupants moved in. All these apartments
were investigated 10 times for their indoor air VOC
concentrations. In addition, outdoor air sampling was
simultaneously conducted. The apartment buildings
were located at least 100 meters away from a major
roadway in order to minimize the impact of motor
vehicle emissions. The floor levels surveyed were
between 2st and 17
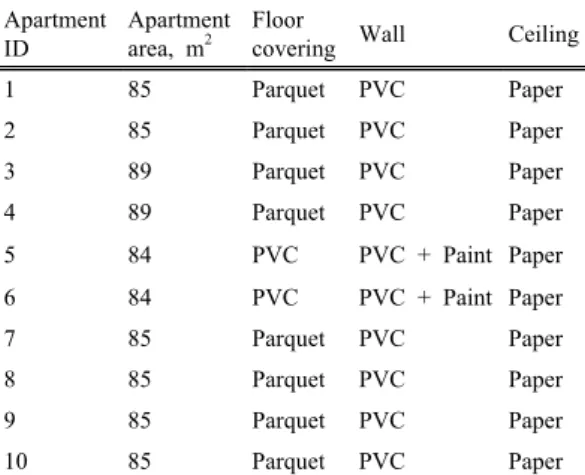
th, and the apartments had a similar size(two to three bedrooms, one living room, and two bath rooms). All apartment constructions were completed within 2-6 months before starting this experiment, on the basis of the construction documents. These documents also indicated that the apartments were built according to the current Korean Building Construction regulation, with concrete and iron frames. Floor covering included parquet, polyvinyl chloride(PVC) and/or marble, while interior wall coverings did PVC and/or marble and ceiling coverings did PVC only. There were two fans in the bathroom and the kitchen, but they were not activated during indoor air sampling. The surveyed apartments had built-in wardrobes and kitchen cabinets, whose types and dimensions were similar to each other. Information on each apartment is provided in Table 1.
Table 1. Information on the apartments surveyed in this study Apartment
ID
Apartment area, m2
Floor
covering Wall Ceiling
1 85 Parquet PVC Paper
2 85 Parquet PVC Paper
3 89 Parquet PVC Paper
4 89 Parquet PVC Paper
5 84 PVC PVC + Paint Paper
6 84 PVC PVC + Paint Paper
7 85 Parquet PVC Paper
8 85 Parquet PVC Paper
9 85 Parquet PVC Paper
10 85 Parquet PVC Paper
Indoor air samples were collected from the new apartments before occupants moved in. This sampling was done by following the indoor air sampling procedure guided by the indoor air quality act of Korea. At the beginning of sampling procedures, all the windows and doors were left open for 0.5 h for the equilibration of the indoor concentrations to the
ambient concentrations. Subsequently, all the windows and doors were closed for 5 h, but the doors between the rooms in the apartments were opened to obtain high air mixing efficiency in the internal space of apartments. The indoor sampling were conducted at the middle location of living room at a height of about 1.5 m from the floor level for 0.5 h during the morning(06:00-12:00) or afternoon(14:00-20:00) period.
After the measurement procedure, the air exchange rate(ACH) was estimated by means of the tracer CO
2gas decay method. The sampling persons were asked not to smoke during sampling to prevent any interference due to tobacco smoke. Outdoor measurements were done at the outdoor balcony of apartments, and temperature and relative humidity in the living rooms were recorded.
Air samples were collected by using a constant- flow sampling pump(Aircheck Sampler Model 224-PCXR8) and a 1/4 in. stainless steel trap containing 0.2 g of Tenax TA and 0.1 g of Carboxen 569. The sampling pump was calibrated by a mass flow meter prior to and following the collection of each sample. The average of these two rates was then used as the sample flow rate in all the volume calculations. None of the samples departed by more than 10% from the initial flow rate. Air samples of 1.7-2.2 L were collected at a flow rate of 55-75 mL min
-1.
Target compounds were analyzed by coupling a thermal desorption system(TDS, Perkin Elmer ATD 400) to a gas chromatograph(HP 5890II)/mass spectrometer(HP MSD5973)(GC/MS) system or a GC/flame ionization detector(FID) system(HP 7890).
The GC/FID system was primarily utilized for theses analyses, and the GC/MS was utilized for the confirmation of GC/FID results. The identification of each compound was confirmed using its retention time and/or mass spectra(Wiley 275 software library).
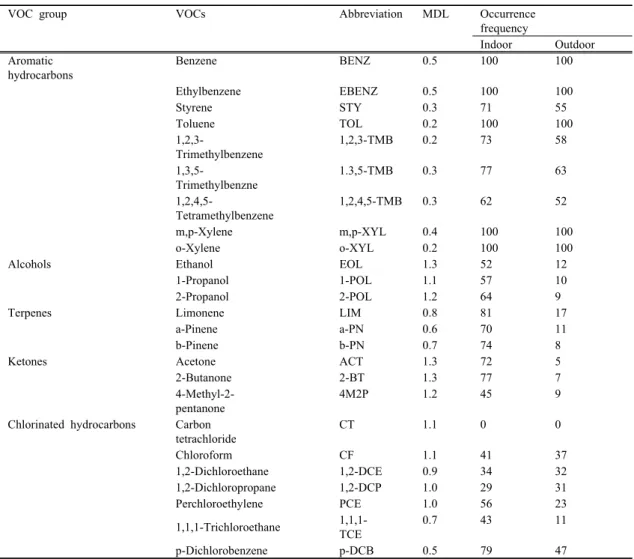
Twenty-five compounds(9 aromatics, 3 alcohols, 3
terpenes, 3 ketones, and 7 chlorinated hydrocarbons)
VOC group VOCs Abbreviation MDL Occurrence frequency
Indoor Outdoor Aromatic
hydrocarbons
Benzene BENZ 0.5 100 100
Ethylbenzene EBENZ 0.5 100 100
Styrene STY 0.3 71 55
Toluene TOL 0.2 100 100
1,2,3-
Trimethylbenzene
1,2,3-TMB 0.2 73 58
1,3,5-
Trimethylbenzne
1.3,5-TMB 0.3 77 63
1,2,4,5-
Tetramethylbenzene
1,2,4,5-TMB 0.3 62 52
m,p-Xylene m,p-XYL 0.4 100 100
o-Xylene o-XYL 0.2 100 100
Alcohols Ethanol EOL 1.3 52 12
1-Propanol 1-POL 1.1 57 10
2-Propanol 2-POL 1.2 64 9
Terpenes Limonene LIM 0.8 81 17
a-Pinene a-PN 0.6 70 11
b-Pinene b-PN 0.7 74 8
Ketones Acetone ACT 1.3 72 5
2-Butanone 2-BT 1.3 77 7
4-Methyl-2- pentanone
4M2P 1.2 45 9
Chlorinated hydrocarbons Carbon tetrachloride
CT 1.1 0 0
Chloroform CF 1.1 41 37
1,2-Dichloroethane 1,2-DCE 0.9 34 32
1,2-Dichloropropane 1,2-DCP 1.0 29 31
Perchloroethylene PCE 1.0 56 23
1,1,1-Trichloroethane 1,1,1- TCE
0.7 43 11
p-Dichlorobenzene p-DCB 0.5 79 47
Table 2. Method detection limits(mg m-3) and occurrence frequencies(%) of selected VOCs for the indoor and outdoor air samples collected in new apartments before moving-in
are listed in Table 2.
Laboratory and field blank traps and spiked samples were analyzed for the quality control procedure. External standards were analyzed daily to check the quantitative response. The laboratory blank traps, obtained from each analytical batch, and the field blank traps were analyzed to check for any trap contamination. No trap contamination was identified.
Seven traps spiked with known amounts of the target compounds were analyzed to identify the method detection limits(MDLs) of the analytical system.
2.2. Estimation of surface area-specific emission strength
For individual VOC and sum of VOCs, surface area-specific emission strength of building materials was estimated by using the mass balanced equation:
SES = A
chV
as(C
in- C
out)/A
s(1)
where SES is the surface area-specific emission
strength(mg m
-2h
-1), A
chthe air exchange rate(h
-1),
V
asthe volume of apartment space(m
3), C
inthe living
room concentration(mg m
-3), C
outthe outdoor
concentration(mg m
-3), and A
sis the surface area of apartment space(m
2). A key assumption made for this equationis that the indoor space is homogeneously mixed, and that sink effects such as wall or other surface adsorption and reemission of adsorbed VOCs are not significant for indoor air VOC levels.
2.3. Statistical analysis
The measured VOC concentrations were statistically analyzed by utilizing the Statistical Analysis System(SAS) Version 9.1(SAS Institute Inc., Cary, NC, USA). On the basis of log-transformed data, the paired sample means of indoor and/or outdoor air concentrations were analyzed by using a paired t-test.
The concentration differences between log-normally distributed data were analyzed using a nonparametric test(Wilcoxon Rank-Sum Test). When the Shapiro- Wilk statistical test indicated that the data were log-normally distributed, median values were also presented. The criterion for significance of the procedures was p<0.05. Spearman correlation coefficients were calculated in order to examine the relationship between the VOC concentrations.
3. Results and discussion
3.1. Indoor and outdoor concentrations
Indoor and outdoor concentrations of selected VOCs were measured in new apartments before occupants moved in. Table 2 reveals the VOC groups, abbreviated VOC names, MDL values and occurrence frequencies determined for VOC measurements in the indoor and outdoor air samples collected in the new apartments. From now on, the abbreviated names are used. The MDLs varied from 0.2 to 1.3 mg m
-3, depending upon VOC types.
Aromatic VOCs exhibited relatively low MDLs compared to other VOC types. Five aromatic VOCs(BENZ, EBENZ, TOL, m,p-XYL, and o-XYL) were detected in all samples of both indoor and outdoor air. Similarly, previous studies reported that
those aromatic compounds belonged to VOC groups that were most prevalently measured in outdoor as well as indoor air of Japan(Ohura, et al., 2006, 2009), China(Ohura, et al., 2009), USA(Jia et al., 2008; Su et al., 2011), and European countries(Geiss et al., 2011; Sarigiannis et al., 2011). Meanwhile, chlorinated compounds had low occurrence frequencies for both indoor and outdoor measurements. In particular, CT has not been detected in any samples of either indoor or outdoor air.
The statistic of the indoor and outdoor concentrations of selected VOCs measured in newly- finished residential buildings before the occupants moved in is presented in Table 3. The mean values of target VOCs were higher than the median values(50
thpercentiles) for both indoor and outdoor air samples.
This suggests that the indoor and outdoor air VOC concentrations had a positive skewness with a long tail of high values, thereby reflecting a log-normal distribution(Edwardsetal., 2005). These indoor and outdoor VOC distributions are consistent with those of previous studies(Edwardsetal., 2005; Ohura et al., 2006; Schlink et al., 2010). This log-normal distribution led to utilize the 50th percentiles(median values) to represent the levels of VOCs. Toluene was most abundant VOC in the indoor air of new apartments, with a median value of 168 mg m
-3. Similar to the occurrence frequencies, chlorinated compounds revealed relatively low indoor concentration levels, with the lowest median concentration of 1.3 mg m
-3for 1,2-DCE. Previous studies(Schlink et al., 2004; Gokhale et al., 2008) also reported low indoor concentration levels compared to other types of VOCs.
The indoor VOC concentrations measured in the
present study were higher than those for previous
studies(Schlink et al., 2004; Ohura et al., 2009; Peng
et al., 2009), which were performed in other
countries. For example, the median indoor benzene
concentration was 10.7 mg m
-3in the current study,
VOCs Indoor concentration Outdoor concentration
5th 25th 50th 75th 95th Mean 5th 25th 50th 75th 95th Mean
BENZ 1.2 4.3 10.7 17.8 22.1 11.5 0.8 2.5 5.4 7.6 10.3 5.7
EBENZ 1.5 10.2 27.1 51.4 60.3 29.8 0.9 3.9 9.1 15.2 21.6 10.4
STY 0.8 2.7 6.8 9.8 12.9 7.7 0.5 0.7 1.2 2.2 2.7 1.4
TOL 5.3 33.5 168 267 352 183 3.2 13.4 29.0 45.7 60.7 34.2
1,2,3-TMB 0.6 1.9 4.5 8.6 11.2 5.2 0.4 1.1 2.0 3.1 3.9 2.4
1.3,5-TMB 0.5 4.7 9.1 13.4 17.8 9.9 0.4 1.5 3.4 5.3 7.2 4.0
1,2,4,5- TMB
0.6 1.5 3.7 5.6 7.7 4.3 0.5 0.8 1.5 2.2 2.8 1.6
m,p-XYL 3.9 11.4 24.0 45.3 53.8 25.1 1.3 6.1 12.6 18.5 25.7 13.5
o-XYL 2.2 6.9 12.8 26.2 31.2 13.9 0.9 1.9 4.8 6.8 9.3 5.3
EOL 1.7 8.2 17.9 28.7 33.6 19.7 1.3 1.5 2.1 2.6 3.3 2.2
1-POL 1.6 9.6 20.7 36.5 42.1 22.3 1.1 1.4 1.7 2.5 2.9 2.1
2-POL 1.5 6.2 14.0 22.3 29.5 16.5 1.2 1.6 1.9 2.7 3.4 2.3
LIM 1.3 2.1 5.2 8.7 10.1 6.9 0.9 1.2 1.8 2.7 3.5 1.9
a-PN 0.9 13.4 30.3 41.5 55.4 33.2 0.7 1.7 4.1 5.8 7.9 4.9
b-PN 1.2 8.9 20.9 37.9 45.9 22.6 0.9 2.2 5.1 7.9 10.3 5.5
ACT 1.8 17.8 40.5 78.4 99.6 42.3 1.5 3.8 8.5 11.2 16.6 8.7
2-BT 1.7 21.2 46.7 73.6 92.5 50.8 1.5 1.8 3.1 4.9 6.7 3.4
4M2P 1.6 4.2 8.8 11.2 15.3 9.4 1.4 1.9 3.4 5.2 7.2 4.1
CT <1.1 <1.1
CF 1.2 1.3 1.6 2.3 2.7 1.9 1.2 1.5 1.9 2.6 3.1 2.1
1,2-DCE 1.0 1.1 1.3 1.8 2.2 1.5 1.1 1.3 1.4 2.1 2.5 1.7
1,2-DCP 1.3 1.5 1.8 3.3 3.9 1.9 1.3 1.4 1.6 2.8 3.4 1.8
PCE 1.6 1.8 2.4 3.6 4.2 2.3 1.2 1.5 2.0 3.7 4.3 2.1
1,1,1-TCE 1.0 1.4 1.9 2.7 3.2 2.0 0.9 1.1 1.7 2.8 3.2 1.9
p-DCB 1.1 2.3 5.2 8.3 11.8 5.4 0.8 1.3 2.4 4.6 5.2 2.7
Table 3. Summary of indoor and outdoor VOC concentrations(mg m-3)(percentiles and arithmetic mean values) measured in new apartments
while it was 2.3 mg m
-3in the American homes (Schlink et al., 2004), 1.6 mg m
-3in Japanese homes (Ohura et al., 2009), and 6.5 mg m
-3in Chinese homes(Ohura et al., 2009).
For toluene, the median indoor concentration was 168 mg m
-3in the current study, while it was 30 mg m
-3in the American homes(Schlink et al., 2004), 12 mg m
-3in Japanese homes (Ohura et al., 2009), and 25 mg m
-3in Chinese homes(Ohura et al., 2009). This difference is primarily attributed to the home ages surveyed in those studies. The present study investigated new apartments prior to moving-in, whereas the previous studies did old established houses. For the present study, meanwhile, building materials would be major indoor sources, since the pre-occupancy stage excludes emissions from
household products, occupants, and furniture such as beds, sofas and tables. However, furniture and household products as well as building materials would be important sources. Nevertheless, the higher VOC levels in the present study suggest that VOC emission source(building materials) in new houses at pre-occupancy stage would exceed the effect of furniture/ household products/building materials in old established houses at post-occupancy stage on indoor VOC levels.
3.2. Relationship between indoor and outdoor concentrations
Table 4 represents the relationship between indoor
and outdoor VOC concentrations measured in new
apartments. 2-BT had the highest indoor-to-outdoor
concentration ratio, 15.1. The ratios were greater than
VOCs BENZ EBENZ STY TOL 1,2,3-TMB 1,3,5-TMB 1,2,4,5-TMB m,p- Xyl
o-Xyl
BENZ 1
EBENZ 0.68* 1
STY 0.66* 0.67* 1
TOL 0.70* 0.69* 0.71* 1
1,2,3- TMB
0.74* 0.72* 0.70* 0.68* 1
1.3,5- TMB
0.13 0.11 0.15 0.17 0.14 1
1,2,4,5-TMB 0.67* 0.70* 0.66* 0.70* 0.69* 0.09 1
m,p- XYL
0.51* 0.60* 0.64* 0.63* 0.66* 0.07 0.65* 1
o-XYL 0.62* 0.65* 0.68* 0.62* 0.64* 0.10 0.69* 0.74* 1
*Statistical significance: *, p<0.05
Table 5. Spearman correlations between indoor aromatic VOCs*
Table 4. Relationship between indoor and outdoor VOC concentrations*
VOCs Indoor-to-outdoor ratio
R2 p
BENZ 2.0 0.08 >0.05
EBENZ 2.9 0.12 >0.05
STY 5.7 0.09 >0.05
TOL 5.8 0.07 >0.05
1,2,3-TMB 2.3 0.13 >0.05
1.3,5-TMB 2.7 0.09 >0.05
1,2,4,5-TMB 2.5 0.11 >0.05
m,p-XYL 1.9 0.16 >0.05
o-XYL 2.7 0.15 >0.05
EOL 8.5 0.12 >0.05
1-POL 12.2 0.18 >0.05
2-POL 7.4 0.08 >0.05
LIM 2.9 0.12 >0.05
a-PN 7.4 0.13 >0.05
b-PN 4.1 0.15 >0.05
ACT 4.8 0.09 >0.05
2-BT 15.1 0.08 >0.05
4M2P 2.6 0.10 >0.05
CT NA
CF 084 0.79 <0.05
1,2-DCE 0.93 0.86 <0.05
1,2-DCP 1.1 0.81 <0.05
PCE 1.2 0.79 <0.05
1,1,1-TCE 1.1 0.68 <0.05
p-DCB 2.2 0.13 >0.05
* Indoor-to-outdoor ratios were calculated using median values; NA, not available
1 for aromatics, alcohols, terpenes, and ketones with probabilities less than 0.05, thereby suggesting the
indoor concentrations were significantly higher than outdoor concentrations. The higher indoor levels are attributed to emissions from building materials. This pattern is consistent with those of previous studies(Edwards et al., 2005; Gokhale et al., 2008; Jia et al., 2008). However, the ratios were similar to 1 for halogenated compounds, except for p-DCB, implying that there were no significant sources in new apartments. Consequently, unlike other VOCs these halogenated compounds would not be significantly emitted from building materials.
3.3. Correlations between aromatic VOCs
With respect to aromatic VOCs which were found to be significantly from building materials emitted, their correlation tests were further conducted for outdoor as well as indoor concentrations. Table 5 reveals the Spearman correlations between indoor aromatic VOCs. All selected VOCs, except for 1,3,5-TMB, exhibited significant correlations each other. As such, there would be one or multiple common source(s) for those VOCs, whereas a different indoor source(s) is attributed to 1,3,5-TMB.
Meanwhile, the Spearman correlations between outdoor aromatic VOCs are represented in Table 6.
For outdoor air concentrations, five VOCs(BENZ,
EBENZ, TOL, m,p-XYL, and o-XYL) were significantly
VOCs BENZ EBENZ STY TOL 1,2,3-TMB 1,3,5-TMB 1,2,4,5-TMB m,p- Xyl
o-Xyl
BENZ 1
EBENZ 0.53* 1
STY 0.17 0.15 1
TOL 0.62* 0.66* 0.13 1
1,2,3- TMB
0.09 0.11 0.08 0.10 1
1.3,5- TMB
0.08 0.14 0.12 0.09 0.06 1
1,2,4,5-TMB 0.12 0.14 0.08 0.07 0.11 0.09 1
m,p-XYL 0.61* 0.64* 0.16 0.71* 0.12 0.10 0.08 1
o-XYL 0.65* 0.58* 0.12 0.66* 0.08 0.14 0.11 0.65* 1
*Statistical significance: *, p<0.05.
Table 6. Spearman correlations between outdoor aromatic VOCs*
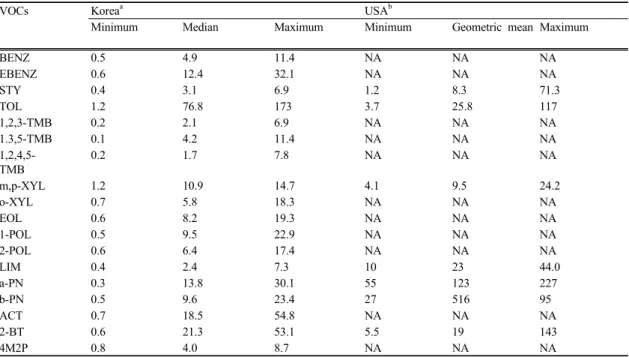
VOCs Koreaa USAb
Minimum Median Maximum Minimum Geometric mean Maximum
BENZ 0.5 4.9 11.4 NA NA NA
EBENZ 0.6 12.4 32.1 NA NA NA
STY 0.4 3.1 6.9 1.2 8.3 71.3
TOL 1.2 76.8 173 3.7 25.8 117
1,2,3-TMB 0.2 2.1 6.9 NA NA NA
1.3,5-TMB 0.1 4.2 11.4 NA NA NA
1,2,4,5- TMB
0.2 1.7 7.8 NA NA NA
m,p-XYL 1.2 10.9 14.7 4.1 9.5 24.2
o-XYL 0.7 5.8 18.3 NA NA NA
EOL 0.6 8.2 19.3 NA NA NA
1-POL 0.5 9.5 22.9 NA NA NA
2-POL 0.6 6.4 17.4 NA NA NA
LIM 0.4 2.4 7.3 10 23 44.0
a-PN 0.3 13.8 30.1 55 123 227
b-PN 0.5 9.6 23.4 27 516 95
ACT 0.7 18.5 54.8 NA NA NA
2-BT 0.6 21.3 53.1 5.5 19 143
4M2P 0.8 4.0 8.7 NA NA NA
*NA, not available. aPresent study. bHodgson et al.’ study (2000).
Table 7. Statistic of emission strengths (mg m-2 h-1) determined in this study, along with that of a previous study*
correlated between them, suggesting that they have a common source(s) outdoors. These compounds have been considered as a well-known marker of motor vehicle emissions(Parra et al., 2008; Leuchner and Rappenglück, 2010). As such, the major outdoor source of the five VOCs is likely to be motor vehicles.
3.4. VOC emission strength
The surface area-specific emission strengths were
determined using an indoor mass balance model and
on-site indoor concentrations measured in new
apartments. The statistical values of emission strengths
determined in this study, along with those of previous
studies, are presented in Table 7. The emission rate of TOL was higher for the current study(median value, 76.8 mg m
-2h
-1) than for the American study (geometric mean, 25.8 mg m
-2h
-1)(Hodgson et al., 2000). Since the median value is approximated to geometric means, both values can be reasonably compared(Weisel et al., 1992). However, the emission rates of LIM, a-PN and b-PN(geometric means of 2.4, 13.8 and 9.6 mg m
-2h
-1, respectively) for the present study were lower than those(geometric means of 23, 123 and 516 mg m
-2h
-1, respectively) of the American study. Meanwhile, the emission rates of m,p-XYL and 2-BT for the current study(geometric means of 10.9 and 21.3 mg m
-2h
-1, respectively) were similar to those of the American study geometric means(9.5 and 19 mg m
-2h
-1, respectively). The Hodgson et al.’s study(2000) was conducted in site-built 1 to 2-month-old houses of eastern and southeastern United States before occupants moved in. Thus, the difference between the two studies is attributed to emission strength difference likely due to different building materials.
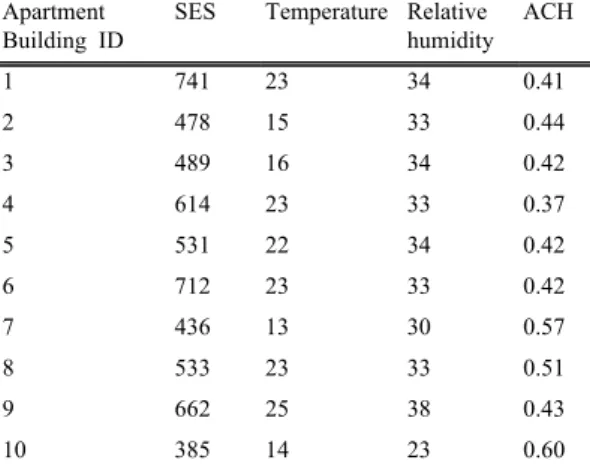
Table 8. Comparison of apartment buildings for median surface area-specific emission strength (SES, mg m-2 h-1) of sum of VOCs in living rooms, mean indoor temperature (°C), mean relative humidity (%), and mean air exchange rates (ACH, h-1)
Apartment Building ID
SES Temperature Relative humidity
ACH
1 741 23 34 0.41
2 478 15 33 0.44
3 489 16 34 0.42
4 614 23 33 0.37
5 531 22 34 0.42
6 712 23 33 0.42
7 436 13 30 0.57
8 533 23 33 0.51
9 662 25 38 0.43
10 385 14 23 0.60