326
and Safety
Available online at http://www.foodhygiene.or.kr
https://doi.org/10.13103/JFHS.2020.35.4. 326
Determination of 11 Illicit Compounds in Dietary Supplements Using High-Performance Liquid Chromatography and Liquid
Chromatography-Tandem Mass Spectrometry
Dasom Shin, Hui-Seung Kang*, Hyung-soo Kim, Guiim Moon
New Hazardous Substances Team, Department of Food Safety Evaluation, National Institute of Food and Drug Safety Evaluation, Ministry of Food and Drug Safety, Cheongju, Korea
(Received July 3, 2020/Revised August 10, 2020/Accepted August 12, 2020)
ABSTRACT - In this work, we developed an analytical method for determining 11 illicit compounds in dietary supplements using high-performance liquid chromatography and liquid chromatography-tandem mass spectrometry.
Eleven target compounds, including those meant for weight loss (7-keto-dihydroepiandrosterone, buformin, met- formin, phenformin, salbutamol, and tolbutamide), sexual enhancement (dihydroepiandrosterone), and relaxation (asarone, kavain, magnoflorine, and picamilon) were screened and confirmed in dietary supplements. Method valida- tion was performed by evaluating the selectivity, linearity, limit of quantification (LOQ), accuracy, and precision according to the Association of Official Analytical Chemists guidelines. The linearity was > 0.993 for all analytes.
The LOQs were ranged in 2.1-9.9 µg/mL (HPLC-DAD) and 0.002-0.008 µg/mL (LC-MS/MS). The accuracies (expressed as recovery) were 90.0-106% (HPLC-DAD) and 83.0-114% (LC-MS/MS). The precision (expressed as the relative standard deviation) was below 10% using HPLC and LC-MS/MS. The proposed method can be used for the surveillance of illicit compounds in dietary supplements.
Key words : Illicit compounds, Overseas direct purchase, Analytical method, HPLC, LC-MS/MS
In the last few years, consumer demand for dietary supplements that support healthy lifestyles has steadily increased worldwide, and online overseas direct purchase is usually preferred. However, such dietary supplements can pose potential health risks and have side effects due to the presence of illicit adulterants such as prohibited ingredients and pharmaceuticals that are not authorized in the Korean food standards. Based on the statistics of the overseas products purchased in the Republic of Korea, overseas direct purchases of food items (including dietary supplements) are estimated to be worth over 3 billion dollars; the experience rate for such online overseas direct purchases increased from 28.1% in 2017 to 37.8% in 2019, rising by 4-5% every year
1). In addition, consumptions of beauty-related dietary supplements (e.g., those providing relaxing effect or muscle
strengthening) and those related to health have increased significantly
2).
Illicit compounds, such as those for weight loss and sexual enhancement, are being continuously detected in dietary supplements
3). Adulteration of unauthorized drugs is commonly detected in plant food products
4). In addition, an increasing number of similar substances with some modifications to their chemical structures, including analogues of pharmaceutical ingredients such as diuretics and antidepressants, has been identified. Indeed, the presence of synthetic substances that have chemical structures similar to those of erectile dysfunction, anti- diabetic, and anti-obesity drugs is not approved medication
5). Adulterated dietary supplements by new and exotic substances are generally more difficult to be detected in routine monitoring program and these samples would pass the customs inspection
6). Thus, the Ministry of Food and Drug Safety (MFDS) has been working with the Korea Customs Service to inspect dietary supplements containing illicit compounds with safety concerns. The respective online websites selling dietary supplements are being blocked according to the Food Sanitation Act and Customs Law
7).
In this study, we selected 11 illicit compounds that are banned in dietary supplements in South Korea. Four of the
*Correspondence to: Hui-Seung Kang, New Hazardous Substances Team, Department of Food Safety Evaluation, National Institute of Food and Drug Safety Evaluation, Ministry of Food and Drug Safety, Osong, Cheongju 28159, Korea
Tel: +82-43-719-4454, Fax: +82-43-719-4450 E-mail: [email protected]
Copyright © The Korean Society of Food Hygiene and Safety. All rights reserved. The Journal of Food Hygiene and Safety is an Open-Access journal distributed under the terms of the Creative Commons Attribution Non-Commercial License(http://creativecommons.org/licenses/by-nc/3.0) which permits unrestricted non-commercial use, distribution,and reproduction in any medium, provided the original work is properly cited.
plant food compounds, namely, asarone (Acorus), kavain (Piper methysticum), magnoflorine (Aristolochia contorta), and picamilon, are designated as prohibited food ingredients owing to the lack of safety data
8-10). Four of the pharmaceutical compounds, buformin, metformin, phenformin, and tolbutamide, employed biguanide and sulfonylurea for the treatment of diabetes. The remaining three compounds, salbutamol (asthma treatment), dehydoepiandrosterone (DHEA), and 7- keto-dehydoepiandrosterone (7-keto-DHEA), were designated as prohibited substances by the World Anti-Doping Agency in 2012
11). We herein report the development an analytical method that allows the simultaneous detection of these 11 illicit compounds using high-performance liquid chromatography (HPLC) and liquid chromatography-tandem mass spectrometry (LC-MS/MS). HPLC with diode array detector (DAD) and LC- MS/MS are considered as fast and accurate analytical methods for confirming the presence of illicit compounds in dietary supplements
12-14).
Materials and Methods Reagents and chemicals
Asarone, DHEA, kavain, magnoflorine, metformin, phenformin, salbutamol, and tolbutamide of high purity (>98%) were purchased from Sigma-Aldrich (St. Louis, MO, USA), and buformin and picamilon were obtained from Toronto Research Chemicals (Toronto, ON, Canada) and BOC Science (Shirley, NY, USA), respectively. 7-Keto- DHEA was synthesized by the MFDS in Korea. Analytical grade methanol and acetonitrile were purchased from Merck (Darmstadt, Germany). Formic acid (≥98%) and phosphoric acid (85%) were purchased from Sigma-Aldrich (St. Louis, MO, USA). For filtration, 0.22-μm hydrophilic polytetrafluoroethylene (PTFE) filter was supplied by Teknokroma (Barcelona, Spain). Dietary supplements were obtained online through overseas direct purchase. Blank samples were confirmed to be free of the target analytes.
Preparation of stock and standard solutions
Stock solution of the individual standard was accurately prepared by dissolving each compound in methanol. All the stock solutions were stored at -20
oC in amber vials to prevent photolysis. All the stock solutions were mixed for simultaneous analysis and serially diluted to 0.5-100 µg/mL to obtain the target concentrations.
Sample Preparation
For the sample preparation, 10 g of each sample (capsule, tablet, and soft-gel) was thoroughly grinded and mixed. An amount (1.0±0.001 g) of sample was weighed into a 50 mL volumetric flask. The sample was mixed in water (15 mL)
for 1 min. After that added methanol (20 mL) and sonicated for 20 minutes to extract the analytes. The methanol was added into the final volume up to 50 mL. After that, the extracts were filtered through a 0.22-μm PTFE syringe filter. Final extracts (5 µL) was injected to HPLC-DAD and LC-MS/MS system.
LC-DAD analysis
Nanospace SI-2 HPLC (Osaka soda Co., Ltd., Tokyo, Japan) system with a DAD was operated using a Osaka soda Capcell Pak C
185.0 μm, 4.6×250 mm (MG II) analytical column. The absorption spectra were monitored by the DAD at 210 nm. The oven temperature was maintained at 40
oC.
The flow rate was 1.2 mL/min and the volume injected into the HPLC-DAD system was set to 5 μL. The binary mobile phase consisted of a 0.5 mM aqueous solution of sodium-1- hexane sulfonate containing 0.1% phosphoric acid (A) and 95% acetonitrile (B). The gradient elution program was as follows: 0-6 min, 5% B; 6-21 min, 30% B; 21-31 min, 40%
B; 31-35 min, 40% B; 35-43 min, 100% B; 43-50 min, 100% B; 50-52 min, 5% B; 52-60 min, 5% B. The total HPLC run time was 60 min.
LC-MS/MS analysis
Ultra-performance liquid chromatography (UPLC) system equipped with XEVO triple quadrupole tandem mass spectrometer (Waters, Milford, MA, USA) was used. The chromatographic separation was performed using Acquity UPLC BEH C
18column (2.1 mm×150 mm, 3.5 µm, Waters, Dublin, Ireland). The oven and column temperature were both set at 40
oC. A mobile phase gradient consisting of 0.1%
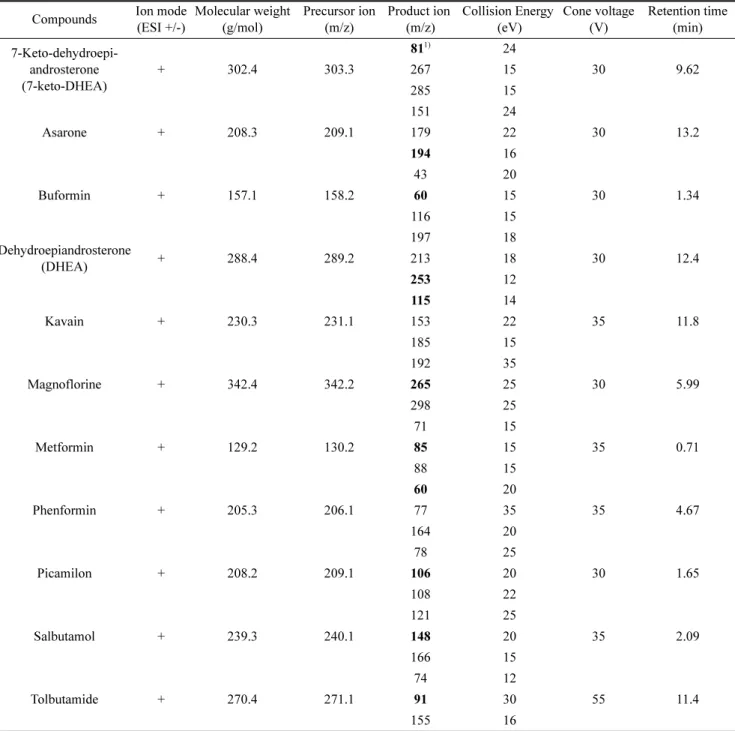
formic acid in water (A) and 0.1% formic acid in acetonitrile (B) was used with an injection volume of 5 μL. The flow rate was set to 0.3 mL/min. The mobile phase gradient was as follows: 0-3 min, 5% B; 3-18 min, 80% B; 18-18.1 min, 100% B; 18.1-20.9 min, 100% B; 20.9-21 min 5% B; 21- 25 min, 5%. For the MS analysis, an electrospray ionization (ESI) source in the positive and multiple reaction monitoring (MRM) modes was used (settings are listed in Table 1). The operation parameters for MS were as follows: capillary voltage of 3.5 kV; desolvation and source temperatures of 500 and 150
oC, respectively; desolvation gas flow of 650 L/h;
cone voltage of 30 V. Collision-induced dissociation was performed using argon. Using the intensity ratio as the confirmation parameter, the optimal declustering potential, collision energy potential, and two MRM transitions were obtained for each analyte.
Method validation
The method was validated according to the procedure
described in the Association of Official Analytical Chemists
(AOAC) guidelines
15). The validation parameters were
linearity, accuracy, precision, and limit of quantification (LOQ). The intra-day and inter-day precision were evaluated in triplicate within a day and over three consecutive days, respectively. The linearity for each analyte was determined using the corresponding standard stock solution in the range 0.5-100 μg/mL based on a linear regression model. The LOQs were calculated by ten times the standard deviation divided by the slope of standard curves. The working solutions were spiked into the blank matrix sample to calculate the recovery (five replicate analyses). To evaluate the accuracy, recovery experiments were conducted by spiking standards at 2 and 10 μg/mL into the blank samples
in five replicate analyses. To evaluate the precision, the relative standard deviation (%RSD) was determined by spiking standards at 2-3 levels into the blank samples in five replicate analyses.
Results and Discussion Optimization of HPLC conditions
The HPLC-DAD method was developed for screening 11 illicit compounds in dietary supplements. Separation conditions were optimized by thoroughly adjusting the LC parameters such as column temperature, mobile phase, and
Fig. 1. HPLC chromatograms of the 11 illicit compounds (210 nm) and their corresponding spectra (10-50 µg/mL).
flow rate, based on a previous study
16). Gradient was optimized by the variation of mobile phases through repeated analyses of the standard mixture of the 11 compounds. The optimized gradient conditions allowed sufficient chromatographic separation of the target analytes within 60 min. Chromatograms of the target compounds using HPLC-DAD are shown in Fig. 1.
Optimization of LC-MS/MS parameters
LC-MS/MS was used for confirming the presence of 11
illicit compounds in dietary supplements. The MS parameters were optimized by the direct infusion of the working solution of each compound (0.1 µg/mL) into the MS. The MS parameters for the target compounds were optimized based on the mass spectral data. The peak- intensity ratios of the selected ions were monitored for each analyte. Protonated ([M+H
+]) molecular ions were chosen as precursor ions of the target analytes, considering the chemical properties in the ESI positive mode. Collision energies for the 11 target compounds were set at 12-35 V.
Table 1. MRM transition and optimized parameters of LC-MS/MS for 11 targeted compounds Compounds Ion mode
(ESI +/-)
Molecular weight (g/mol)
Precursor ion (m/z)
Product ion (m/z)
Collision Energy (eV)
Cone voltage (V)
Retention time (min) 7-Keto-dehydroepi-
androsterone (7-keto-DHEA)
+ 302.4 303.3
81
1)24
30 9.62
267 15
285 15
Asarone + 208.3 209.1
151 24
30 13.2
179 22
194 16
Buformin + 157.1 158.2
43 20
30 1.34
60 15
116 15
Dehydroepiandrosterone
(DHEA) + 288.4 289.2
197 18
30 12.4
213 18
253 12
Kavain + 230.3 231.1
115 14
35 11.8
153 22
185 15
Magnoflorine + 342.4 342.2
192 35
30 5.99
265 25
298 25
Metformin + 129.2 130.2
71 15
35 0.71
85 15
88 15
Phenformin + 205.3 206.1
60 20
35 4.67
77 35
164 20
Picamilon + 208.2 209.1
78 25
30 1.65
106 20
108 22
Salbutamol + 239.3 240.1
121 25
35 2.09
148 20
166 15
Tolbutamide + 270.4 271.1
74 12
55 11.4
91 30
155 16
1)
Values in bold denote quantification ion.
The mass spectrum was acquired in full scan mode to generate the precursor ions and product ions, and the product ions with the best sensitivities were set as quantitative ions
17). Of all the product ions, only two product ions with high sensitivities were established as the qualitative ions (Table 1).
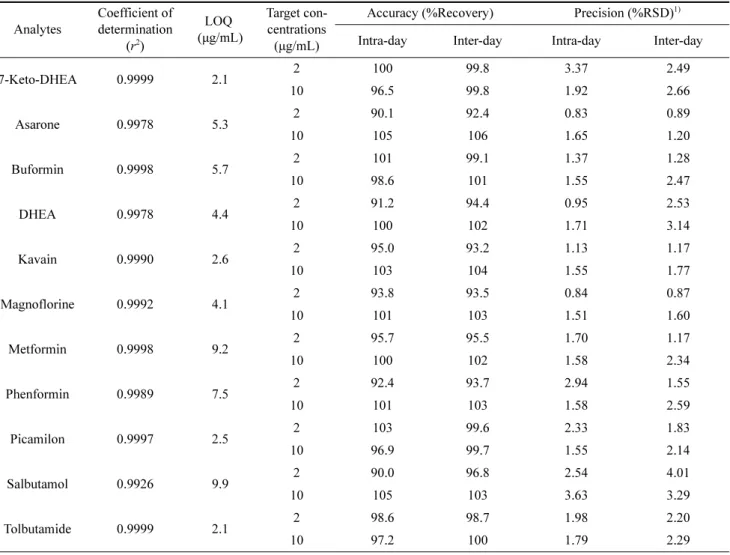
Method validation
The HPLC quantification method was verified in terms of the selectivity, linearity, LOQ, precision, and accuracy; an inter-laboratory validation was also performed (Table 2).
The LOQ values were 2.1-9.9 μg/mL, respectively. The linearity was >0.993 for five-point concentrations in the range of 1-20 μg/mL. The precision (expressed as coefficient of variation, %) was <10% at two concentrations (2 and 10 μg/mL). The intra- and inter-day accuracies were determined to be 90.0-105% and 92.4-106%, respectively, with precision values of 0.83-3.63% and 0.87-4.01%, respectively. The proposed method showed a high accuracy
and an acceptable sensitivity, with satisfactory values for all method validation parameters being obtained according to the requirements of the Association of Official Analytical Chemists (AOAC) guidelines
15).
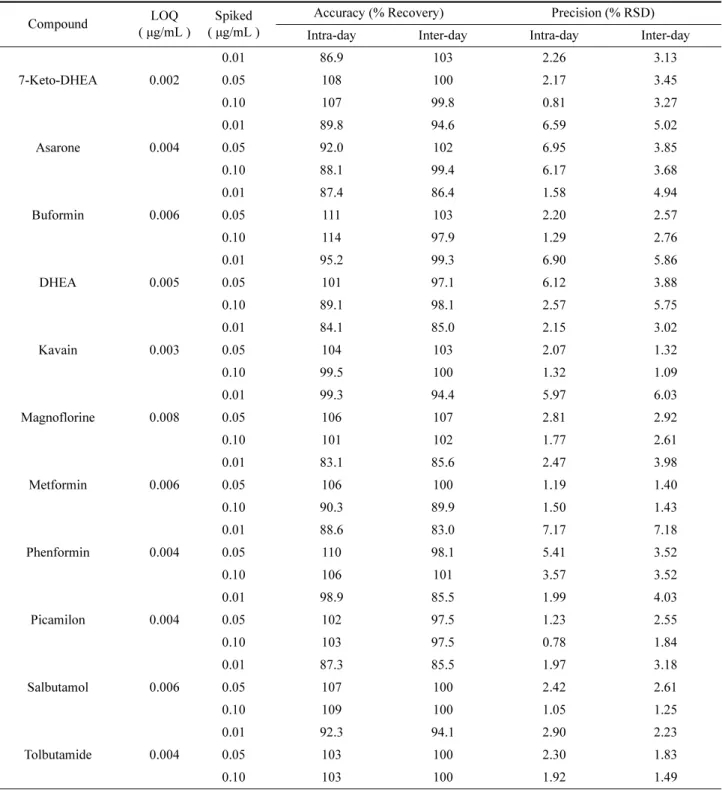
The LC-MS/MS validation was performed to identify and confirm the target compounds corresponding to the unmatched peaks in the HPLC data. A specificity was observed from the analysis of the blank sample, and no interfering substances were observed (n=5). The chromatograms of the target compounds are shown in Fig. 2. LOQs were in the range 0.002-0.008 μg/mL. Calibration curve confirmed that the data corresponding to the compounds were linear (r
2>0.994) at the three target concentrations. Accuracy (average recovery) of the illicit compounds was in the range of 83.0-114%, while the precision (RSD) was less than 7.2% (Table 3). Compared to previous methods, the proposed LC-MS/MS-based method is simple and allows the simultaneous analysis of 11 illicit compounds in dietary supplements with high sensitivity and repeatability
18-19).
Table 2. Linearity, limit of quantification (LOQ), accuracy, and precision for the target compounds using HPLC-DAD Analytes
Coefficient of determination
( r
2)
LOQ (µg/mL)
Target con- centrations (µg/mL)
Accuracy (%Recovery) Precision (%RSD)
1)Intra-day Inter-day Intra-day Inter-day
7-Keto-DHEA 0.9999 2.1 2 100 99.8 3.37 2.49
10 96.5 99.8 1.92 2.66
Asarone 0.9978 5.3 2 90.1 92.4 0.83 0.89
10 105 106 1.65 1.20
Buformin 0.9998 5.7 2 101 99.1 1.37 1.28
10 98.6 101 1.55 2.47
DHEA 0.9978 4.4 2 91.2 94.4 0.95 2.53
10 100 102 1.71 3.14
Kavain 0.9990 2.6 2 95.0 93.2 1.13 1.17
10 103 104 1.55 1.77
Magnoflorine 0.9992 4.1 2 93.8 93.5 0.84 0.87
10 101 103 1.51 1.60
Metformin 0.9998 9.2 2 95.7 95.5 1.70 1.17
10 100 102 1.58 2.34
Phenformin 0.9989 7.5 2 92.4 93.7 2.94 1.55
10 101 103 1.58 2.59
Picamilon 0.9997 2.5 2 103 99.6 2.33 1.83
10 96.9 99.7 1.55 2.14
Salbutamol 0.9926 9.9 2 90.0 96.8 2.54 4.01
10 105 103 3.63 3.29
Tolbutamide 0.9999 2.1 2 98.6 98.7 1.98 2.20
10 97.2 100 1.79 2.29
1)
RSD, relative standard deviation.
Comparison of instrumental analysis
The results of this study showed that the HPLC-DAD and LC-MS/MS method has acceptable linearity, accuracy, and precision. Although there were slight different concentrations of illicit compounds in dietary supplements due to the retention time and chromatographic separation. Both the HPLC-DAD and LC-MS/MS method were successfully applied to quantify 11 illicit compounds. The lower LOQ was achieved by the
LC-MS/MS method. To evaluate the applicability of the proposed HPLC and LC-MS/MS methods, illicit compounds were monitored in 115 samples collected through overseas direct purchase from March to June in 2020. As a result, three compounds were detected in dietary supplements using HPLC (DHEA, 39.7±1.17 mg/g; kavain 18.8±0.51 mg/g, magnoflorine, 0.54±0.01 mg/g) and LC-MS/MS (DHEA, 36.7±1.45 mg/g;
kavain 16.4±0.18, magnoflorine, 0.46±0.01 mg/g). These
Fig. 2. LC-MS/MS chromatograms of the 11 illicit compounds (0.01 µg/mL).
results indicated that matrix effect may affect the concentration of three compounds in dietary supplements using LC-MS/MS. Further research is required for the comparison with the concentrations of illicit compounds in large samples for dietary supplements. Additionally, continuous surveillance is needed to monitor the new analogues of illegal substances in dietary supplements. The
results of study can provide useful information to customers purchasing dietary supplements.
Acknowledgement
This study was supported by the Ministry of Food and Drug Safety in Korea (17161MFDS062 and 20161MFDS052).
Table 3. LOQ, accuracy, and precision for the detection of the 11 target analytes in dietary supplements at three testing levels using LC- MS/MS
Compound LOQ
( µg/mL )
Spiked ( µg/mL )
Accuracy (% Recovery) Precision (% RSD)
Intra-day Inter-day Intra-day Inter-day
7-Keto-DHEA 0.002
0.01 86.9 103 2.26 3.13
0.05 108 100 2.17 3.45
0.10 107 99.8 0.81 3.27
Asarone 0.004
0.01 89.8 94.6 6.59 5.02
0.05 92.0 102 6.95 3.85
0.10 88.1 99.4 6.17 3.68
Buformin 0.006
0.01 87.4 86.4 1.58 4.94
0.05 111 103 2.20 2.57
0.10 114 97.9 1.29 2.76
DHEA 0.005
0.01 95.2 99.3 6.90 5.86
0.05 101 97.1 6.12 3.88
0.10 89.1 98.1 2.57 5.75
Kavain 0.003
0.01 84.1 85.0 2.15 3.02
0.05 104 103 2.07 1.32
0.10 99.5 100 1.32 1.09
Magnoflorine 0.008
0.01 99.3 94.4 5.97 6.03
0.05 106 107 2.81 2.92
0.10 101 102 1.77 2.61
Metformin 0.006
0.01 83.1 85.6 2.47 3.98
0.05 106 100 1.19 1.40
0.10 90.3 89.9 1.50 1.43
Phenformin 0.004
0.01 88.6 83.0 7.17 7.18
0.05 110 98.1 5.41 3.52
0.10 106 101 3.57 3.52
Picamilon 0.004
0.01 98.9 85.5 1.99 4.03
0.05 102 97.5 1.23 2.55
0.10 103 97.5 0.78 1.84
Salbutamol 0.006
0.01 87.3 85.5 1.97 3.18
0.05 107 100 2.42 2.61
0.10 109 100 1.05 1.25
Tolbutamide 0.004
0.01 92.3 94.1 2.90 2.23
0.05 103 100 2.30 1.83
0.10 103 100 1.92 1.49
국문요약