Jung, Hui-Cheul··Jeon, Seong-Woo··Lee, Dong-Kun*··Matsuoka, Yuzuru**
Korea Environment Institute, Dept. of Landscape Architecture, Seoul National University*
Graduate School of Global Environmental Studies, Kyoto University**
(Manuscript received 15 November 2003; accepted 15 December 2003)
삼림의 이동속도를 고려한 한반도 자연 식생의 기후변화 적응성 평가
鄭輝喆·全性禹· 東根*·松岡 讓**
韓國環境政策·評價硏究院, 서울大學校 造景學科*, 京都大學校 地球環境大學院**
(2003년 11월 15일 접수, 2003년 12월 15일 승인)
요 약
IPCC(Intergovernmental Panel on Climate Change)는 향후 100년 동안 지구의 평균기온이 1℃
에서 3.5℃상승할 경우, 각 기후대가 극방향으로 약 150∼550km 이동할 것으로 예측하고 있으 나, 과거 기후변동 연구결과들은 삼림의 이동속도를 100년간 4∼200km로 추정하고 있어 식생이 기후대의 이동을 따라가지 못하여 사멸되는 지역이 발생할 것으로 예측되고 있다. 약 960km의 남북으로 긴 지형적 특성을 가진 한반도 역시 이러한 영향을 벗어나지 못할 것으로 예측되고 있어 기존의 기후변화 시나리오와 함께 삼림의 이동성을 고려한 영향연구가 요구된다. 본 연구 는 IPCC의 새로운 기후변화 시나리오인 SRES 시나리오의 대기대순환모형(Global Climate Model, GCM) 결과와 AIM(Asia Integrated Model)/Impact[Korea] 모형을 이용하여 제작된 Holdridge 생물기후분류의 연구성과를 이용하여, CO2농도 배증시의 한반도지역의 자연식생 영 향과 적응 가능성을 삼림의 이동성을 고려하여 평가하였다. 삼림의 이동속도를 0.25, 0.5, 1.0, 2.0(km/yr)로 변화시키며 2100년 한반도 자연식생의 기후 변화 영향을 평가한 결과, (1) 목본식 물의 이동속도가 년간 1km 이상일 경우 삼림 피해가 미미하게 나타났으나 (2) 이동이 느린 0.25km/yr의 경우, 생육위험지역을 포함한 시나리오별 전체 피해규모는 A2(17.47%), A1(9.97%), B1(6.21%), B2(5.08%) 순으로 나타났으며, 삼림소멸의 경우는 A2, B2 시나리오에서 발생하며 A2 시나리오에서 한반도의 약 2.1%로 가장 크게 발생하였다. (3) 전반적인 생육위험
Corresponding Author: Huicheul Jung, Korea Environment Institute, 613-2 Bulgwang-dong, Eunpyeong-gu, Seoul,122-706, Korea Tel: 82-2-380-7780 Fax: 82-2-380-7766 E-mail: [email protected]
I. Introduction
Forest resources, a treasure house for a gene and bio-diversity, play an important role in stabi- lizing the global climate system as well as offer- ing various economic benefits to humankind.
Climate changes such as global warming will have positive or negative impacts on such a glob- al system and cause changes in natural environ- ment. Climatologists observed that global mean temperature has increased by 0.5˚C in the past century and also predicted that the additional temperature increase will be 0.6˚C to 5.6˚C by 2100 (IPCC, 2001). Such predictions on future cli- mate change contain relatively high uncertainties, but it is important to evaluate its impact on vege- tation, ecosystems and certain tree species in order to secure a scientific base for establishment of actions to address adaptation and mitigation of climate change (Box et al., 1999; Yates et al., 2000).
In order to evaluate the vulnerability of vege- tation to climate change, potential vegetation dis- tribution and migration of forest must be simul- taneously considered (IGBP, 1997; Kirilenko and Solomon, 1998). Potential vegetation distribution will be estimated by bio-climatic classification method such as Holdridge life zone model using the GCM(General Climate Model) runs in double CO2concentration condition. (Holdridge, 1947;
AIM, 1996, 1997). As for the future vegetation adaptation, the distribution of well shifted or extinct area caused by climate change can be simulated by considering forest moving velocity
and the changed growing conditions. Currently, the simulation results of vegetation adaptability considering migration of forests such as MOVE model and DGVM model show wide range of variations. In order to reduce such uncertainties in the future, model refinement is requested (IGBP, 1997; Kirilenko and Solomon, 1998).
In this study, the future impact of forest distri- bution and regional adaptability to climate change on the Korean peninsula was evaluated by the Holdridge classification outputs of AIM(Asian-pacific Integrated Model)/Impact model and forest moving velocity from 0.25km/yr to 2.0km/yr under doubled CO2con- centration with 10 different GCMs of IPCC (Intergovernmental Panel on Climate Change) SRES A1, A2, B1 and B2 scenarios.
II. Study Scope and Data
1. Study Area
The target study area including the Korean Peninsula covers 120 - 135 at longitude and 30 - 45 at latitude. In order to evaluate vulnerability, the Korean Peninsula was divided into four regions. Region A is southern area including Kyungsang province and Cholla province and Region B is central western coast area including Choongchong province, Kyonggi province, and Hwanghae province. Region C is central eastern coast area covering Gangwon province and south Hamkyung province and Region D is the north- 지역의 분포는 함흥만, 영흥만의 동해안지역에 집중되었으며, A2 시나리오의 극단적 소멸예상지 역은 금오산, 가야산, 팔공산을 연결하는 지역에서 발생하는 것으로 나타났다.
주요어 : AIM/Impact-model, climate change, SRES, forest vegetation impact, Holdridge life zone
ern area including Pyongan province and north Hamkyung province (Fig. 1). Korean peninsula was divided into 4 zones for the policy making convenience considering the boundaries of administrative districts and previous study(Jeon et al., 2002).
2. Data preparation
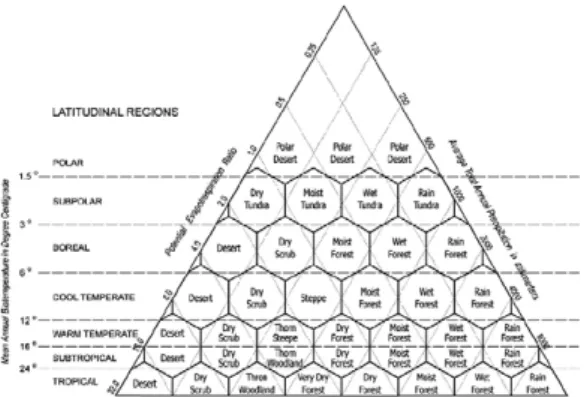
The Holdridge model has 39 bio-climatic zones and requires three parameters - biotemperature (Bt), mean annual precipitation (P), and potential evapo-transpiration rate (PER) - as its input data (Holdridge et al., 1971). Biotemperature is the sum of mean monthly temperature above 0˚C.
Potential evapo-transpiration rate can be expressed in a ratio of biotemperature and mean annual precipitation (PER=58.93Bt/P). When any two parameters of three are determined, the remaining parameter can be calculated. Using zonation in Fig. 2, relevant climatic zones can be determined. Therefore, input data required in the Holdridge model are mean monthly temperature and precipitation totals. Accordingly, the current climate observed value (base year) and future cli- mate simulation results based on a climate model
are necessary.
As for the current climate data, IPCC recom- mends to use the mean of at least over 30 years of climate data in order to represent the current climate. However, since data observed for over 30 years are scarce among on-going observation data of Korea Meterological Administration (KMA, 2003). This research used 80 climate sites in South Korea from 1960 through 1999 considering the distribution of sites and observation periods and 197 temperature sites and 119 precipitation sites from Global Historical Climatology Network Data observation stations over 10 years were used (UNEP, 2003). Finally, these climate data were used to produce mean monthly temperature and monthly precipitation grids with every interval of 0.1˚longitude/latitude. Regarding spatial interpola- tion of observation data, Inverse Distance Squared Weighting (IDSW) method considering tempera- ture lapse rate was used, given that Korea has a lot of mountainous areas (Yun et al., 2001). As for DEM used in temperature interpolation, GLOBE (Global Land One-km Base Elevator) 30 second DEM (Digital Elevation Model) of NOAA’s National Geophysical Data Center was aggregated to every 0.1˚interval (NOAA, 2003) .
Figure 1. Study Area Figure 2. Holdridge Life Zone Model
As for the future climate simulation data, the mean monthly temperature and precipitation changes in the results of A-O GCMs (the fully coupled Global Climate Model of Atmosphere and Ocean) under four types of SRES scenarios provided by IPCC were transformed into future climate data required in the study. The SRES sce- narios described in Table 1 refine the shortcom- ings of existing IPCC IS92 scenarios and are
defined by hypothesis describing developments in various social, economic, technical, environ- mental and political aspects. They are simply grouped into A1, A2, B1 and B2 (IPCC TGCIA, 1999). The A-O GCMs simulation results of SRES scenarios used in this study are summarized in Table 2 and Scenarios A1 and B1 used the GCM of CSRIO model only.
Table 1. The Emissions Scenarios of the Special Report on Emissions Scenarios (SRES)
A1
A future world of very rapid economic growth, global population that peaks in mid-century and declines thereafter, and the rapid introduction of new and more efficient technologies. Major underlying themes are convergence among regions, capacity building and increased cultural and social interactions, with a substantial reduction in regional differences in per capita income. The three A1 groups are distinguished by their technological emphasis: fossil intensive (A1FI), non-fossil energy sources (A1T), or a balance across all sources (A1B)
A2
A very heterogeneous world, The underlying theme is self-reliance and preservation of local identities. Fertility patterns across regions converge very slowly, which results in continuously increasing population. Economic development is primarily regionally oriented and per capita economic growth and technological change are more fragmented and slower than in other storylines.
B1
A convergent world with the same global population, that peaks in mid-century and declines thereafter, as in the A1 storyline, but with rapid change in economic structures toward a service and information economy, with reductions in material intensity and the introduction of clean and resource-efficient technologies. The emphasis is on global solutions to economic, social and environmental sustainability, including improved equity, but without additional climate initiatives.
B2
A world in which the emphasis is on local solutions to economic, social and environmental sustainability. It is a world with continuously increasing global population, at a rate lower than A2, intermediate levels of economic development, and less rapid and more diverse technological change than in the B1 and A1 storylines. While the scenario is also oriented towards environmental protection and social equity, it focuses on local and regional levels.
Source: Summary for policymakers in the Third Assessment Report of Working Group I of IPCC, 2001
Table 2. IPCC SRES scenario runs used in this study
Organization Acronym Model Scenarios Runs Period
Max Planck Institute for Meteorology
MPIfM ECHAM4/
- A2 - B2 1990-2100
(http://www.mpimet.mpg.de/en/web) OPYC3
Hadley Centre for Climate Prediction and Research
HCCPR HadCM3 - A2 - B2 1950-2099
(http://www.met-office.gov.uk/research/hadleycentre/) Australia’s Commonwealth Scientific and Industrial
CSIRO CSIRO-Mk2 A1 A2 B1 B2 1961-2100
Research Organization (http://www.csiro.au) Canadian Center for Climate Modelling and Analysis
CCCma CGCM2 - A2 - B2 1900-2100
(http://www.cccma.bc.ec.gc.ca)
Organization Acronym Model Scenarios Runs Period
III. Methods
1. Study Structure
Using GCM results of SRES scenarios, this study analyzes impact on the vegetation and its environmental adaptability by 2100 when the greenhouse effect is expected to reach an equilibri- um. Sensitivity analysis was conducted by chang- ing forest moving velocity in GCM results of each scenario and expected damaged areas were visual- ly displayed using the GIS system (Fig. 3).
From climate data of double CO2 obtained from GCM results, distribution of the Holdridge life zones in 2100 was predicted for each scenario using the AIM/Impact[Korea] model (Jeon et al., 2002) and its outcome was feed into impact pre- diction model to calculate the size and location of each damaged area.
2. Development of Impact Assessment model
According to the second assessment report by IPCC(1996), it is predicted that if the global mean temperature rises by 1˚C to 3.5˚C in the next 100
years, each climatic zone will migrate toward the poles by about 150∼ 550km (IPCC, 1996).
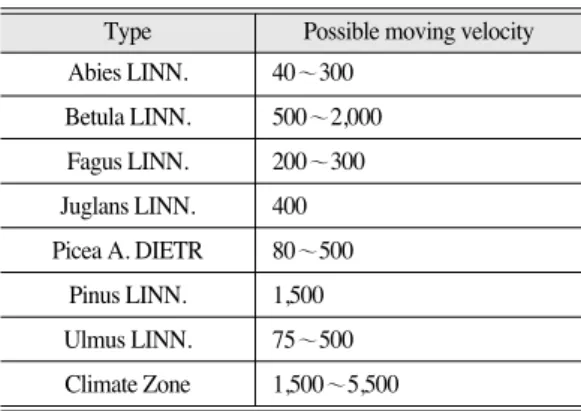
Meanwhile, a study on historical climate change period showed that woody plants migrate along with climatic zones, but its moving velocity is estimated to be 4∼200km per 100 years as shown in Table 3. Therefore, except for tree species with a high velocity, they will not be able to catch up with migration of climatic zones and have a high risk of being extinct due to climate change. Also, studies on climate changes in the Holocene Epoch showed that a forest moving velocity varies greatly between mountainous areas and lowlands and the dispersion of seeds by wind and animals increases the velocity. Due to such reasons, diffusion of forest is not disrupt- ed in areas such as lakes or ocean (Davis, 1989).
In this study, only vegetative growing condi- tions in inland where migration is possible in natural state were considered without incorporat- ing factors disturbing migration of seeds such as severance by borderlines. Therefore, based on the results of above-described study, the impact of climate change on vegetation was categorized
Figure 3. Structure of Study
Table 3. Tree moving velocity (unit:m/yr) Type Possible moving velocity
Abies LINN. 40∼300
Betula LINN. 500∼2,000
Fagus LINN. 200∼300
Juglans LINN. 400 Picea A. DIETR 80∼500
Pinus LINN. 1,500
Ulmus LINN. 75∼500
Climate Zone 1,500∼5,500
Source: Davis, M. B., 1989, "Lags in vegetation response to green house warming", Climate Change, 15, 75-82.
Type Possible moving velocity
into Table 4 based on two factors of viable cli- mate conditions and moving velocity of forest.
The impact of climate changes on vegetation was categorized into four change patterns of viable and non-viable in 1990 climatic zones and 2100 climatic zones. In case of climatic zones in 2100 where new forests can be created, it was catego- rized into a case that exotic tree species invade and a case that they do not invade concurrently with the creation of new climatic zones due to a gap between climatic zone velocity and forest moving velocity. Finally, by adding a case that climatic zones do not change, seven categories ranging from (a) to (g) were created. Because the migration of woody plants is slower than that of climatic zones, in case of Category (c) in Table 4 where invasion by exotic tree species does not occur, forests currently existing in the area sur-
vives at a minimum level or convert into other species. Also, in an extreme case, it is expected that vegetation in the area may wither due to heat stress, dryness, or fire and the area may be covered with shrub temporarily. In adaptability analysis result, Category (d) in Table 4 was marked as vegetation extinction area and Category (c) was described as vegetation declin- ing area.
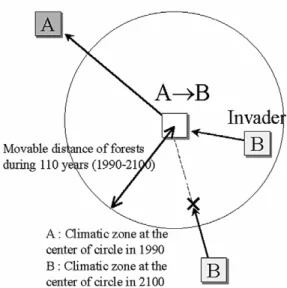
Figure 4 shows the possibility of invasion by exotic tree species due to climate change. The radius of the circle represents movable distance of forests during 110 years (1990∼2100). If a cli- matic zone at the center of the circle changed from A to B and climatic zone B exists within the movable distance of forests (i.e., within the circle) as of 1990, the area can migrate concurrently with climatic zones and tree species adapted to
Table 4. Categorization of adaptability of vegetation due to changes in climatic zones Climatic zone change pattern Impact on forest
19902100
Forest viable
a) No change in climatic zones, and forests existing in the area are protected and maintained.
(No change in climatic zones)
Forest viable
b) Create a forest where tree species not existing in the area (exotic species) as well as climatic zones can migrate. (Type B)
(Change in climatic zones)
c) If climate changes only and invasion by exotic species does not occur, the species mix of forest existing in the area changes. Species mix changes over time, but in some extreme cases, forests wither due to heat stress, dryness, or fire and the area is covered with shrub temporarily. (Type A)
Forest not viable d) Change into a climatic zone where forests are not viable; consequently, forests wither after all.
Forest viable
e) Create a forest where tree species not existing in the area (exotic species) as well as climatic zones can migrate. (Type B)
f) If climate changes only and invasion by exotic species does not occur, a forest is created by species currently existing in the area. (Type A)
Forest not viable g) Not used in this study.
* Type A: Existence of genes of species in the area changes due to climatic change, Type B: Geographical distribution of species changes due to climatic change.
Climatic zone change pattern
Impact on forest
1990 2100
Forest viable
Forest not viable
climatic zone B can invade into the central area (Munesue and Takahashi, 2000).
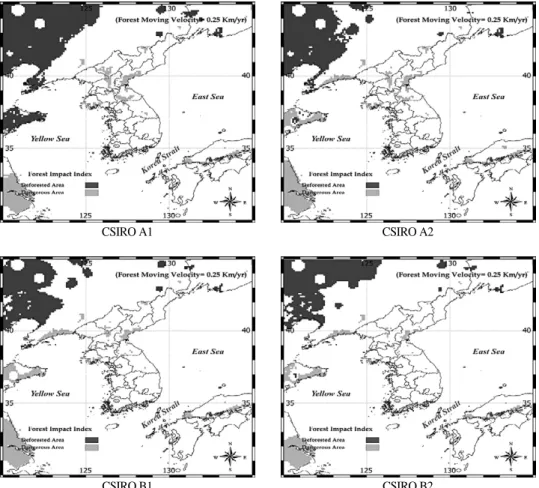
IV. Results
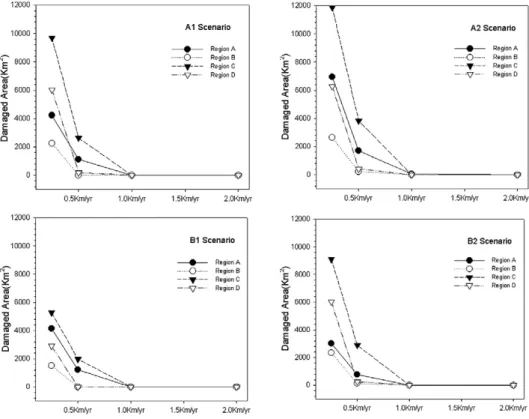
The extent of forest damage (Category (c)+(d) in Table 4) caused by climate change on the Korean Peninsula in 2100 are shown in Figures 5 - 7. The study used CSIRO GCM only in case of Scenarios A1 and B1. In Scenarios A2 and B2, the average of 4 GCM data including CCCma, CSIRO, EH4OPYC and HadCM3 was produced as the result. When damaged areas were analyzed by changing forest moving velocity(FMV) ranging from 0.25 to 2.0(km/yr), damage was greatest when velocity was slowest at 0.25km/yr. In case of 1.0km/yr or Figure 4. Possibility of invasion by exotic tree species
Source: Munesue Y. and Takahashi K., 2000, Evaluation of Climate Change Impact on Vegetation and its Economic Value, Japanese Environmental Science, 13(3), 329-337.
Figure 5. Expected total damaged area in 2100 (FMV=0.25km/yr)
higher, damage was steady at minimal (Fig. 6).
When the damage was greatest, forest extinction area (Category (d) in Table 4) did not occur in Scenarios A1 and B1. However, it occurred in case of Scenarios A2 and B2 when CCCma and EH4OPY GCM were used. The size of extinction area is 2.08% of the Korean Peninsula (222,562km2; MCT, 1999) in case of Scenario A2, which is high- er than 0.11% in Scenario B2. In both Scenarios A2 and B2, extinction area was concentrated in Daegu and north Kyungsan province area connecting Kum-O Mountain, Gaya mountain, and Palkong Mountain and Pyongyang vicinity forecasting grave impact.
When total damaged area (Categories (c)+(d) in Table 4) including cases where species mix
changes or vegetation declines (Category (c) in Table 4) is compared across Scenarios, damaged area in Scenario A2 where regional economic growth and high population growth are achieved was highest at 17.47% of the Korean Peninsula.
In Scenario A1 with high economic growth and low population growth, it was 9.97% and in Scenario B1 with economic activities based on clean technology and low population growth, it was 6.21%. In Scenario B2 with medium-level economic growth and modest population growth, it was 5.08% (Fig. 5). The location of declining areas were concentrated on southern coast, Hamheung Bay and Youngheung Bay in Kangwon province, and Hoechon and Dukchon in Pyongan province in all Scenarios (Fig. 7).
Figure 6. Forest damage change to FMV in 2100
These declining areas were independent from extinction area indicating that they need to be managed separately.
V. Conclusion and Suggestions
The evaluation of adaptability of vegetation to climate change on the Korean Peninsula in 2100 with considering of forest moving velocity showed that (1) forest damage was small if forest moving velocity was higher than 1km/year and (2) when the velocity was 0.25km/year, vegeta- tion extinction area was largest in Scenario A2
with 2.08% and total damaged area including vegetation declining area was in an order of A2(17.47%), A1(9.97%), B1(6.21%), and B2(5.08%).
(3) The distribution of vegetation declining area was concentrated on the northern Kangwon province and eastern coast of south Hamkyung province (Region C). Direct forest extinction expected area was concentrated on Daegu and borderline between south and north Kyungsang provinces (Region A).
In order to obtain a spatial climate change pat- tern, the result of Holdridge model, which is a simple vegetation model based on a climate
Figure 7. Climate change impact on the Korean peninsula in 2100 (GCM=CSIRO, FMV=0.25km/yr)
CSIRO A1 CSIRO A2
CSIRO B1 CSIRO B2
using 10 GCM outcomes, was used. The spatial resolution and climate deviation of these GCMs were shown as a wide range of fluctuations in impact assessment due to Holdridge model’s high dependency on climate. Therefore, in order to improve the credibility of climate change impact assessment, it is necessary to use the regional climate simulation results such as Regional Climate Model (RCM) where spatial resolution is improved and to develop the physi- cal & biological response process-based vegeta- tion model. Anyway, in spite of these fluctuation, the average value of damage estimates calculated in this study may serve as a representative indi- cator of the impact and a useful rationale for understanding and managing geographical distri- bution of damaged areas.
Acknowledgements
The authors acknowledge the contributions of Dr. Hideo Harasawa and Dr. Kiyoshi Takahashi in National Institute for Environmental Studies, Japan who provided meaningful comments for this research.
Reference
AIM Project Team, 1996, Technical Structure of AIM/Impact model, AIM Interim Paper, IP- 95-06, National Institute for Environmental Studies, Japan.
AIM Project Team, 1997, Asian-Pacific Integrated model, National Institute for Environmental Studies, Japan, 69.
Box, E.O., Crumpacker, D.W. and Hardin, E.D., 1999, Predicted effects of climatic change on
distribution of ecologically important native tree and shrub species in Florida, Climatic Change, 41, 213-248.
Davis, M. B., 1989, Lags in Vegetation Response to Greenhouse Warming, Climate Change, 15, 75- 82.
Holdridge, L.R., 1947, Determination of world plant formations from simple climate data, Science, 105, 367-368.
Holdridge, L.R., Grenke, W.C., Hatheway, W.H., Liang, T. and Tosi, J.A., 1971, Forest Environments in Tropical Life Zones, Pergamon Press, Oxford.
Houghton, J.T., Meria, F.L.G., Bruce, J., Lee, H., Callander, B.A., Haites, E., Harris, N. and Maskell, K., 1995, Climate Change 1994:
Radiative forcing of climate change and an evaluation of the IPCC IS92 emission scenarios.
Reports of Working Group I and III of the IPCC, Cambridge Univ. Press, Cambridge, UK.
IGBP, 1997, The terrestrial biosphere and global change: Implications for natural and managed ecosystem, IGBP SCIENCE, 1, 10-14.
IPCC, 1996, Climate Change 1995: Impacts, adaptations and mitigation of climate change:
scientific-technical analyses, Contribution of working group II to the second assessment report of the IPCC.
IPCC, 2001, Impacts, adaptations and mitigation of climate change: scientific-technical analyses, Contribution of working group to in the Third Assessment Report of the IPCC.
IPCC_TGCIA, 1999, Guidelines on the use of scenario data for climate impact and adaptation assessment, version 1, Intergovernmental Panel on Climate Change, Task Group on Scenarios for Climate Impact Assessment, 69.
Jeon, S.W., Park, Y.H., Jung, H.C., Lee, D.K., Matsuoka,
Y., Harasawa, H. and Takahashi, K., 2002, Impact Assessment of Ecosystem influenced by Changing Global Climate and its National Management Practices III , Korea Environment Institute, RE-08, 67-101. (in Korean)
Kirilenko, E.P. and Solomon, A.M., 1998, Modeling dynamic vegetation response to rapid climate change using bioclimatic classification, Climate Change, 38, 15-49.
Korea Meterological Administration, 2003, http://
www.kma.go.kr/kmas/kma/main_home.jsp Ministry of Construction & Transportation, 1999, http:
//www.moct.go.kr/DH/mct_hpg/mcthpg_gp /Data/tongae.htm
Munesue, Y. and Takahashi, K., 2000, Evaluation of Climate Change Impact on Vegetation and its
Economic Value, Japanese Environmental Science, 13 (3), 329-337. (in Japanese)
NOAA’s National Geophysical Data Center, 2003, http:
//www.ngdc.noaa.gov/seg/topo/gltiles.shtml UNEP, 2003, http://www.grid.unep.ch
Yates, D.N., Kittel, T.G. and Cannon, R.F., 2000, Comparing the correlative Holdridge model to mechanistic biogeographical models for assessing vegetation distribution response to climate change, Climatic Change, 44, 59- 87.
Yun, J.I., Choi, J.Y. and Ahn, J.H., 2001, Seasonal trend of elevation effect on daily air temperature in Korea, Korean Journal of Agriculture and Forest Meteorology, 3 (2), 96-104. (in Korean)
최종원고채택 03. 12. 16