http://crossmark.crossref.org/dialog/?doi=10.14474/ptrs.2020.9.2.120&domain=pdf&date_stamp=2020-6-25
Received: 28 May, 2020 Revised: 18 June, 2020 Accepted: 19 June, 2020
Corresponding author: Myung-Mo Lee (ORCID https://orcid.org/0000-0002-2192-1701)
Department of Physical Therapy, Daejeon University, 62 Daehak-ro, Dong-gu, Daejeon 34520, Republic of Korea Tel: 82-42-280-4295 Fax: 82-42-280-2295 E-mail: [email protected]
This is an Open-Access article distributed under the terms of the Creative Commons Attribution Non-Commercial License (http://creativecommons.org/licenses/
by-nc/4.0) which permits unrestricted non-commercial use, distribution, and reproduction in any medium, provided the original work is properly cited.
Copyright © 2020 Korean Academy of Physical Therapy Rehabilitation Science https://doi.org/10.14474/ptrs.2020.9.2.120
pISSN 2287-7576 eISSN 2287-7584
Phys Ther Rehabil Sci 2020, 9 (2), 120-130 www.jptrs.org
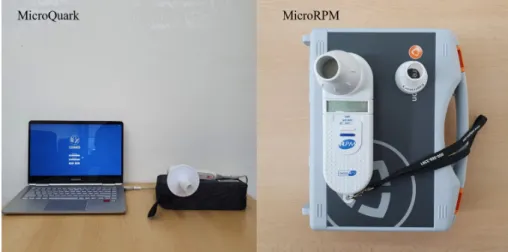
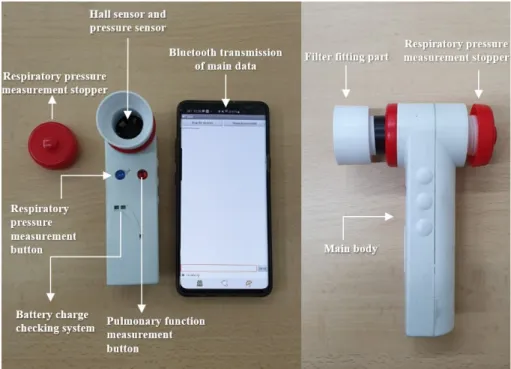
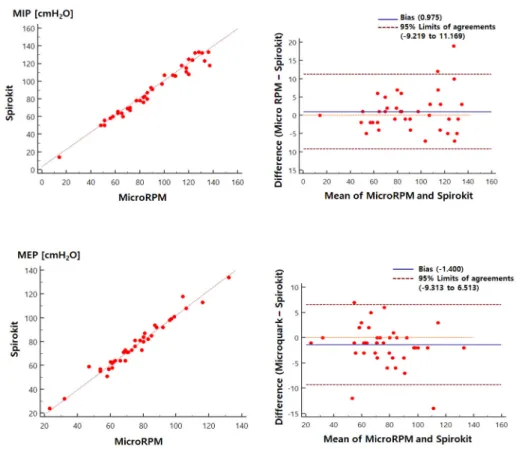
A study on the clinical usefulness, validity, and test-retest reliability of the Spirokit, a device that combines the
pulmonary function test and respiratory muscle strength test
Byeong-Soo Kim a , Myung-Mo Lee b
a
Department of Physical Therapy, Graduate School, Daejeon University, Daejeon, Republic of Korea
b