Introduction
Retinitis pigmentosa (RP) refers to a heterogeneous group
of inherited dystrophies that is characterized by progressive primary degeneration of rods and secondary but critical degeneration of cones. The visual impairment typically
망막색소변성 환자의 빛간섭단층혈관조영검사와 다국속망막전위도의 상관관계
Correlations between Optical Coherence Tomography Angiography Findings and Multifocal Electroretinogram Parameters in Retinitis Pigmentosa Patients
한정우, 우상언, 최은우, 온영훈
Jung Woo Han, Sang Earn Woo, Eun Woo Choi, Young-Hoon Ohn
순천향대학교 부천병원 안과
Department of Ophthalmology, Soonchunhyang University Bucheon Hospital, Bucheon, Korea
Address reprint requests to Young-Hoon Ohn, MD, PhD
Department of Ophthalmology, Soonchunhyang University Hospital Bucheon, #170 Jomaru-ro, Wonmi-gu, Bucheon 14584, Korea
Tel: 82-32-621-5053, Fax: 82-32-621-5435
Received: 2020. 2. 7.
Revised: 2020. 5. 21.
Accepted: 2020. 5. 28.
Purpose: We investigated the correlations between macular function recorded with a multifocal electroretinogram (mfERG) and macu-
lar structure evaluated by optical coherence tomography angiography (OCT-A) in patients with retinitis pigmentosa (RP).Methods: In total, 30 eyes of 15 RP patients and 40 eyes of 20 healthy subjects were enrolled in this study. OCT-A and mfERG were
performed for all patients. The area and circularity of the foveal avascular zone (FAZ) were measured, and the vessel density (VD) and per- fusion density (PD) of the superficial capillary plexus and deep capillary plexus (SCP and DCP, respectively) were estimated. The average amplitude and implicit time of N1, P1, and N2 in rings 1 and 2 were obtained from the mfERG findings. Correlation between the OCT-A results and mfERG parameters were analyzed in RP patients and normal subjects.Results: The mean FAZ area in RP patients increased significantly compared with that in normal subjects (p < 0.001). Both the PD and
VD in the SCP and DCP were significantly reduced in RP patients compared with normal subjects (p < 0.001 and p < 0.001, respectively).The mean amplitude of N1, P1, and N2 from rings 1 and 2 were significantly reduced in RP patients compared with normal subjects. The superficial FAZ and deep FAZ area were significantly correlated with P1 amplitude (r = -0.682, p = 0.000 and r = -0.612, p = 0.000, respec- tively). Both the VD and PD of the superficial plexus were correlated with P1 amplitude on mfERG (r = 0.188, p = 0.021; r = 0.215, p = 0.013;
r = 0.323, p = 0.002; and r = 0.362, p = 0.001, respectively).
Conclusions: The P1 amplitude from mfERG was significantly correlated with FAZ area and the PD and VD of the SCP and DCP in RP pa-
tients. Together, these results suggest that OCT-A together with mfERG is a useful modality for evaluating macular structure and function in RP patients.Keywords: Multifocal electroretinogram; Optical coherence tomography angiography; Retinitis pigmentosa
involves night vision and midperipheral vision, with grad- ual deterioration of central visual acuity (VA) [1-3]. The pathogenesis of RP is complex, with loss of rods and cones accompanied by changes in the retinal pigment epithelium and retinal glia. Ultimately, the inner retinal neurons, blood vessels, and optic nerve head are affected by the disease.
The severity of RP can be evaluated using different ex- amination and imaging modalities, including VA testing, visual field (VF) testing, electroretinography, optical coher- ence tomography (OCT), and multifocal electroretinograms (mfERGs) [4]. The mfERG is a valuable test for detecting outer retinal disorders [5], and it has been used to quantify the remaining cone-mediated function in RP patients [6-8].
It is especially useful in advanced stages of the disease [9].
Study of retinal and choroidal vasculatures has become more feasible with the advent of OCT angiography (OCT-A).
OCT-A is a noninvasive and ideal alternative to fluorescein angiography because it produces results more quickly and avoids the potential side effects of fluorescein angiography, including vomiting and hypersensitivity reactions. OCT-A detects streaming blood flow and constructs an image of the retinal vasculature, facilitating visualization of the super- ficial capillary plexus and deep capillary plexus [10]. The choriocapillaris also can be visualized, but the small size and intersinusoidal spacing of its blood vessels cause it to appear homogenous with bright areas that represent blood flow [11]. The technology of OCT-A has been applied broad- ly to study vasculature changes in inherited retinal dystro- phies, including RP, Stargardt disease, and choroideremia [12-16].
However, it is unclear how these microcirculatory changes correlate with morphological and functional changes. Our study investigated the correlations between macular function recorded with mfERG and macular structure that was deter- mined using OCT-A in RP patients.
Materials and Methods
Ethics statement
This study was approved by the Institutional Review Board of our institute (2020-01-010). Informed consent was waived due to the retrospective nature of the study. The research and data collection were conducted in accordance with the tenets of the Declaration of Helsinki from the World Medical Association.
Participants
The present study included 15 consecutive RP patients who visited the Department of Ophthalmology at our institution from September 1, 2017, to December 31, 2019. Clinical di- agnosis of RP was based on ocular history, family history, funduscopic findings, VF testing, and International Society for Clinical Electrophysiology of Vision standard full-field electroretinograms (ffERGs). The exclusion criteria were as follows: significant media opacity, presence of maculopathy involving cystoid macular edema, glaucoma, nystagmus, myopia greater than -6.0 diopters, or any systemic or neuro- logical disease that could affect the tests. In total, 40 eyes of 40 age-matched subjects without any history of chronic or systemic disease or pathological features identified after a complete ophthalmic examination were enrolled as controls.
All patients and controls underwent a complete ophthalmic examination, including best-corrected visual acuity (BCVA) using the logarithm of the minimum angle of resolution (log- MAR), intraocular pressure, refraction, slit lamp biomicros- copy, dilated stereoscopic fundus examination, OCT-A, and mfERG. FAG was not performed on all patients.
OCT-A image analysis
OCT-A was performed using a Zeiss Cirrus 5000 with Angioplex (Carl Zeiss Meditec, Dublin, CA, USA). The Angioplex used optical microangiography, a recently de- veloped imaging technique that produces 3D images of the dynamic blood flow within the microcirculatory tissue beds.
A scanned area of 3 × 3 mm centered on the fovea was used.
All acquisitions were performed using FastTracTM (Carl Zeiss Meditec) retinal tracking technology to reduce motion artifacts. Segmentation of the retinal layers was automatical- ly performed by the embedded software. In addition to the non-segmented en-face images (whole retina), en-face im- ages of the superficial retinal capillary layer plexus and the deep retinal capillary layer plexus were analyzed. The su- perficial foveal avascular zone (FAZ) area, superficial vessel density (VD), superficial perfusion density (PD), deep FAZ area, deep VD, and deep PD were also evaluated. We did not analyze the choriocapillaris vessels in this study.
mfERGs
mfERGs (VERIS 6.4.4; EDI, Redwood City, CA, USA)
were performed with Burian-Allen bipolar electrodes using
standard protocols. Pupils were fully dilated with topical
application of 1% tropicamide and 2.5% phenylephrine hy- drochloride. The stimulation matrix consisted of a 103-cell hexagonal element pattern array displayed on a cathode ray tube monitor at a frame rate of 75 Hz at 32 cm from the par- ticipants’ eyes. Each hexagon was modulated between black (<10 cd/m
2) and white (200 cd/m
2) according to a binary m-sequence. The duration of data acquisition was 4 min- utes and was divided into eight sessions of 30 seconds. The waveforms were recorded, amplified (×200,000), and band pass-filtered (5-100 Hz). The responses were analyzed ac- cording to ring averages. The average amplitude and implicit time of N1 and P1 in rings 1 and 2 were measured (Fig. 1).
Early experience with the method has shown no detectable multifocal responses in a small proportion of patients with retinitis pigmentosa. Therefore, we maximized the fixation target and performed the tests by guiding the patients to gaze
as far forward as possible, for a more accurate examination.
Statistical analyses
Data are presented as mean ± standard deviation. The BCVA values were converted to logMAR for statistical analysis.
The Mann-Whitney U test and Bonferroni correction were used to compare data sets, as appropriate. The degree of correlation between two variables was expressed as linear regression analysis. A value of p < 0.05 was considered sta- tistically significant.
Figure 1. Spatial correlation between optical coherence tomog-
raphy angiography and hexagonal elements of multifocal electro- retinogram (mfERG).Table 1. Study group characteristics
Characteristic RP patients(n = 15)
Control group
(n = 20)
p-value
* Age (years) 42.34 ± 11.19 43.11 ± 13.83 0.314Sex (male:female) 5:10 10:10 -
Spherical equivalent (D) -1.54 ± 2.45 -0.95 ± 2.56 0.175 BCVA (logMAR) 0.56 ± 0.16 0.00 ± 0.18 0.001† Values are mean ± standard deviation unless otherwise indicated.
RP = retinitis pigmentosa; D = diopters; BCVA = best corrected visual acuity; logMAR = logarithm of minimal angle of resolution.
*Mann-Whitney U tests with Bonferroni correction; †The signifi- cance level cutoff of p ≤ 0.05.
Table 2. Quantitative analysis of macular vascular density and FAZ
between retinitis pigmentosa patients and controlsRP patients Control group p-value* SFAZ area (mm2) 0.39 ± 0.12 0.27 ± 0.12 <0.001† DFAZ area (mm2) 0.41 ± 0.11 0.29 ± 0.13 <0.001† FAZ circularity 0.66 ± 0.11 0.66 ± 0.15 0.280
SPD 0.38 ± 0.05 0.44 ± 0.04 <0.001†
DPD 0.35 ± 0.08 0.42 ± 0.03 <0.001†
SVD (mm-1) 16.88 ± 1.93 19.46 ± 0.70 <0.001† DVD (mm-1) 13.51 ± 2.91 17.23 ± 1.41 <0.001† Values are mean ± standard deviation.
FAZ = foveal avascular zone; SFAZ = superficial FAZ; DFAZ = deep FAZ; SPD = superficial perfusion density; DPD = deep perfusion density; SVD = superficial vessel density; DVD = deep vessel den- sity.
*Mann-Whitney U tests with Bonferroni correction; †The signifi- cance level cutoff of p ≤ 0.05.
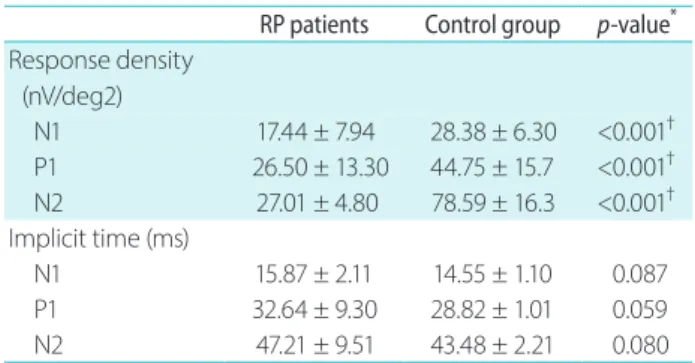
Table 3. mfERG parameters in rings 1 and 2 in retinitis pigmentosa
patients and controlsRP patients Control group
p-value
* R esponse density(nV/deg2)
N1 17.44 ± 7.94 28.38 ± 6.30 <0.001† P1 26.50 ± 13.30 44.75 ± 15.7 <0.001†
N2 27.01 ± 4.80 78.59 ± 16.3 <0.001†
Implicit time (ms)
N1 15.87 ± 2.11 14.55 ± 1.10 0.087
P1 32.64 ± 9.30 28.82 ± 1.01 0.059
N2 47.21 ± 9.51 43.48 ± 2.21 0.080
Values are mean ± standard deviation.
mfERG = multifocal electroretinogram; RP = retinitis pigmentosa.
*Mann-Whitney U tests with Bonferroni correction; †The signifi- cance level cutoff of p ≤ 0.05.
Results
In total, 25 eyes of 15 patients (5 males and 10 females) who met the inclusion criteria and 40 eyes of 20 normal subjects (10 males and 10 females) were enrolled. The mean age was 42.34 ± 11.19 years in the affected patients and 43.11 ± 13.83 years in normal subjects (p = 0.314). The average logMAR BCVA was 0.56 ± 0.16 for the affected patients and 0.00 ± 0.18 for the normal subjects (Table 1).
The macular VD and FAZ in the healthy subjects and RP patients are shown in Table 2. There were significant dif-
ferences in FAZ between normal subjects and RP patients.
However, there was no significant difference in FAZ circu- larity between normal subjects and RP patients. There were significant differences in PD and VD of the superficial and deep layers between normal subjects and RP patients.
The mean amplitudes of N1, P1, and N2 in rings 1 and 2 were reduced significantly in RP patients compared with normal subjects (p < 0.001, p < 0.001, and p < 0.001, respec- tively). The mean implicit times of N1, P1, and N2 were also reduced in RP patients compared with normal subjects, but the difference was not significant (p = 0.087, p = 0.059, and
Table 4. Correlations between multifocal electroretinogram and OCT angiography
SFAZ area DFAZ area FAZ circularity SPD DPD
SVD
DVDResponse densities (nV/deg2)
N1 0.045* 0.079
0.770 0.277 0.432 0.600 0.141
P1
0.000* 0.000* 0.606 0.002* 0.001* 0.021* 0.013*N2
0.174 0.470 0.851 0.414 0.505 0.995 0.453
Implicit times (ms)
N1
0.072 0.090 0.403 0.091 0.136 0.058
0.034*P1
0.789 0.624 0.633 0.156 0.378 0.937 0.316
N2 0.650 0.652 0.851 0.141 0.414 0.995 0.453
OCT = optical coherence tomography; SFAZ = superficial FAZ; DFAZ = deep FAZ; FAZ = foveal avascular zone; SPD = superficial perfusion density; DPD = deep perfusion density; SVD = superficial vessel density; DVD = deep vessel density.
*Linear regression analysis.
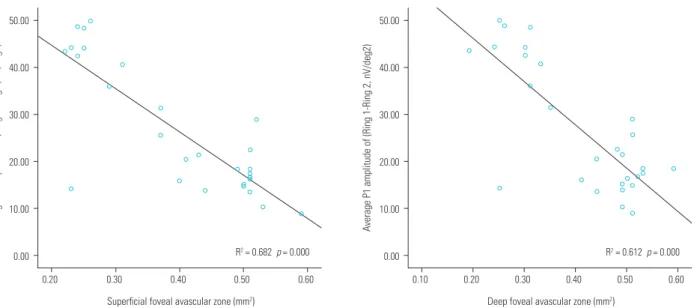
Figure 2. Relationship between foveal avascular zone (FAZ) and average P1 amplitude of multifocal electroretinogram (mfERG) (Ring 1
-Ring 2). FAZ in the superficial and deep capillary plexuses correlated significantly with average P1 amplitude of mfERG.50.00
40.00
30.00
20.00
10.00
0.00
0.20 0.30 0.40 0.50 0.60
Superficial foveal avascular zone (mm2)
Average P1 amplitude of (Ring 1-Ring 2, nV/deg2)
R2 = 0.682 p = 0.000
50.00
40.00
30.00
20.00
10.00
0.00
0.10 0.20 0.30 0.40 0.50 0.60
Deep foveal avascular zone (mm2)
Average P1 amplitude of (Ring 1-Ring 2, nV/deg2)
R2 = 0.612 p = 0.000
p = 0.080, respectively) (Table 3).
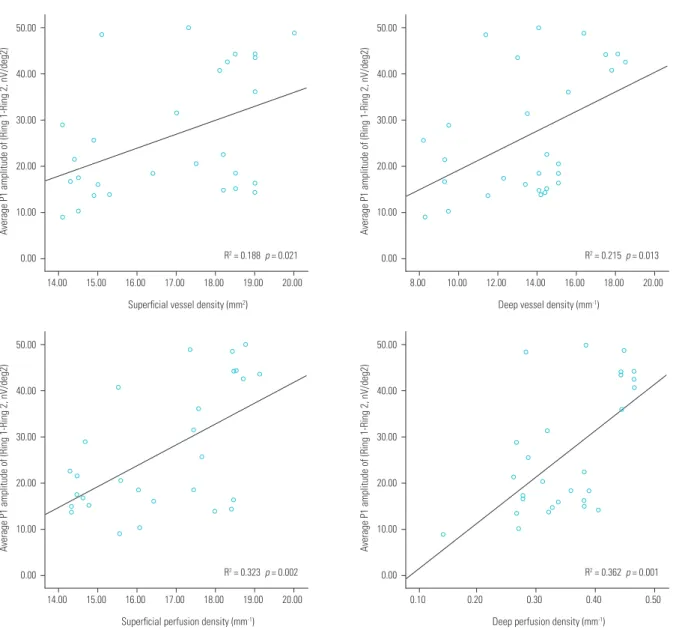
Both VD and PD of the superficial plexus and deep plexus were correlated with P1 amplitude on mfERG (r = 0.188, p = 0.021; r = 0.215, p = 0.013; r = 0.323, p = 0.02; and r = 0.362, p = 0.001, respectively). The FAZ area showed significant correlation with P1 amplitude in the superficial and deep plexuses (r = -0.682, p = 0.000 and r = 0.612, p = 0.000, re- spectively) (Table 4, Fig. 2, 3). The strongest correlation with P1 amplitude on mfERG was found in the FAZ area. Rep- resentative cases of patients with retinitis pigmentosa and normal subjects are shown in Fig. 4.
Discussion
OCT-A is a novel imaging technique that enables visualiza- tion of blood flow in retinal and choroidal vessels and vessels of the optic nerve head without recourse to an intravenously injected dye. An interesting feature of OCT-A is its ability to quantitate blood flow. Its application has been described in normal subjects and in patients with ocular and systemic dis- eases [17-21]. Several studies have recently reported abnor- malities in OCT-A images of eyes of RP patients, indicating a reduction in retinal blood flow and an increase in FAZ size
50.00
40.00
30.00
20.00
10.00
0.00
14.00 15.00 16.00 17.00 18.00 19.00 20.00 Superficial vessel density (mm2)
Average P1 amplitude of (Ring 1-Ring 2, nV/deg2)
R2 = 0.188 p = 0.021
50.00
40.00
30.00
20.00
10.00
0.00
8.00 10.00 12.00 14.00 16.00 18.00 20.00 Deep vessel density (mm-1)
Average P1 amplitude of (Ring 1-Ring 2, nV/deg2)
R2 = 0.215 p = 0.013
50.00
40.00
30.00
20.00
10.00
0.00
14.00 15.00 16.00 17.00 18.00 19.00 20.00 Superficial perfusion density (mm-1)
Average P1 amplitude of (Ring 1-Ring 2, nV/deg2)
R2 = 0.323 p = 0.002
50.00
40.00
30.00
20.00
10.00
0.00
0.10 0.20 0.30 0.40 0.50
Deep perfusion density (mm-1)
Average P1 amplitude of (Ring 1-Ring 2, nV/deg2)
R2 = 0.362 p = 0.001
Figure 3. Relationship between vessel density (VD), perfusion density (PD) and Average P1 amplitude of multifocal electroretinogram (mfERG)
(Ring 1-Ring 2). VD and PD in the superficial and deep capillary plexuses correlated significantly with Average P1 amplitude of mfERG.[12,14,22,23]. Our results using OCT-A showed an enlarged FAZ and reduced macular perfusion in RP patients com- pared with normal subjects. These findings are consistent with previously published results that used different meth- ods and imaging technologies. OCT-A has the advantage of being a noninvasive imaging technique and is available in an increasing number of hospitals and medical centers. It is suitable for routine clinical examinations and can be per- formed quickly and easily.
Standardized ffERG is a mass response that reflects total retinal area. It is possible to estimate small residual respons- es in advanced RP patients in combination with computer averaging and use of analog or digital filters [24], but with- out this technique, a recordable response cannot be obtained from advanced RP patients. In contrast to ffERG, multi- focal electroretinography tests local retinal function and is sensitive enough to quantitate cone-mediated local retinal function, even in advanced RP patients who have severely
constricted VF with non-recordable ffERG [6,8,9]. There- fore, mfERG might be a more useful modality than ffERG to evaluate retinal function in RP patients.
The present study examined retinal structure using OCT-A and retinal function using mfERGs in the foveal region (Rings 1 and 2) of RP patients, followed by determination of correlations between these measurements. mfERGs and OCT-A have previously been used to evaluate individual ret- inas in RP patients. However, to the best of our knowledge, no study has identified correlations between OCT-A param- eters and mfERGs. In the present study, we identified cor- relations between mfERG and macular structure as revealed by OCT-A in RP patients. The results show a significant cor- relation between FAZ, PD, VD, and mfERG. The strongest correlation was found between FAZ in the superficial and deep plexuses and P1 amplitude on mfERG. The PD and VD were also correlated with P1 amplitude on mfERG. Overall, the results demonstrated a possibility for evaluating the mac- Figure 4. Vascular network differences between retinitis pigmentosa (RP) patient and healthy control at the superficial and deep capillary level. (A,
B) 3 × 3 optical coherence tomography (OCT) of the superficial and deep capillary plexus of a healthy subject. (C) Trace arrays of multifocal elect- roretinogram (mfERG) of a healthy subject. (D, E) 3 × 3 OCT angiography of the superfical and deep capillary plexus of a patient with RP. (F) Trace arrays of mfERG of a patient with RP.500 nV
80 ms 0
Superficial Deep
500 nV
80 ms 0
A C
D F
B
E
ular function of RP patients using OCT-A.
Attenuation of retinal blood vessels is a funduscopic hall- mark of RP. Using different types of OCT-A instruments, it has been reported that there is a reduction in retinal blood flow in the eyes of RP patients [12]. Our results also show that the PD and VD of the superficial and deep layers in the macular region were reduced in RP patients compared with normal controls.
The mechanism underlying the vascular changes in RP patients is unclear, and studies have discussed possible mechanisms of pathogenesis [12,25]. Studies have indicat- ed that blood flow is altered in patients with RP, and this process was not localized to the eye but generalized across the body [26,27]. In RP patients, even in the early stages of disease, plasma level of endothelin-1, a strong endogenous vasoconstrictor, is increased and has been correlated with a decrease of blood flow in the ophthalmic and posterior ciliary arteries [26]. The decrease in retinal blood flow in RP may be aggravated by metabolic alteration of retinal endothelial cells and by an increase in oxygen level that also determine an increase in retinal production of endothelin-1.
The observed differences in our study could be explained by vascular changes in RP patients and by reduced blood flow in the damaged retina.
In this context, it has also been noted that FAZ area in RP patients is significantly greater than that in normal con- trols. This has to be considered when analyzing our results because flow density measurements of the fovea could be affected by an enlarged FAZ in RP patients. In the present study, the superficial and deep layers in the FAZ were in- creased in RP patients compared with normal controls.
Our study is limited by its small sample size and lack of genetic characterization. Additional studies addressing these limitations with a longer follow-up period are needed to better evaluate the usefulness of OCT-A in diagnosis and follow-up of patients with RP.
In conclusion, RP patients displayed decreased macular perfusion compared with normal subjects. The flow density measured using OCT-A correlated with functional parame- ters recorded on mfERGs. These results suggest that OCT-A performed with multifocal electroretinography is a useful modality for evaluating both macular structure and function in RP patients.
Conflicts of Interest
The authors declare no conflicts of interest relevant to this article.
References
1. Hartong DT, Berson EL, Dryja TP. Retinitis pigmentosa. Lancet 2006;368:1795-809.
2. Grover S, Fishman GA, Anderson RJ, et al. Visual acuity impair- ment in patients with retinitis pigmentosa at age 45 years or older. Ophthalmology 1999;106:1780-5.
3. Berson EL, Sandberg MA, Rosner B, et al. Natural course of ret- initis pigmentosa over a three-year interval. Am J Ophthalmol 1985;99:240-51.
4. Sujirakul T, Lin MK, Duong J, et al. Multimodal imaging of central retinal disease progression in a 2-year mean follow-up of retinitis pigmentosa. Am J Ophthalmol 2015;160:786-98.e4.
5. Hood DC, Odel JG, Chen CS, Winn BJ. The multifocal electro- retinogram. J Neuroophthalmol 2003;23:225-35.
6. Hood DC, Holopigian K, Greenstein V, et al. Assessment of local retinal function in patients with retinitis pigmentosa using the multi-focal ERG technique. Vision Res 1998;38:163-79.
7. Seeliger M, Kretschmann U, Apfelstedt-Sylla E, et al. Multifocal electroretinography in retinitis pigmentosa. Am J Ophthalmol 1998;125:214-26.
8. Gränse L, Ponjavic V, Andréasson S. Full-field ERG, multifocal ERG and multifocal VEP in patients with retinitis pigmentosa and re- sidual central visual fields. Acta Ophthalmol Scand 2004;82:701- 6.
9. Nagy D, Schönfisch B, Zrenner E, Jägle H. Long-term follow-up of retinitis pigmentosa patients with multifocal electroretinog- raphy. Invest Ophthalmol Vis Sci 2008;49:4664-71.
10. Munk MR, Giannakaki-Zimmermann H, Berger L, et al. OCT-angi- ography: a qualitative and quantitative comparison of 4 OCT-A devices. PLoS One 2017;12:e0177059.
11. Al-Sheikh M, Falavarjani KG, Pfau M, et al. Quantitative features of the choriocapillaris in healthy individuals using swept-source optical coherence tomography angiography. Ophthalmic Surg Lasers Imaging Retina 2017;48:623-31.
12. Battaglia Parodi M, Cicinelli MV, Rabiolo A, et al. Vessel densi- ty analysis in patients with retinitis pigmentosa by means of optical coherence tomography angiography. Br J Ophthalmol 2017;101:428-32.
13. Battaglia Parodi M, Cicinelli MV, Rabiolo A, et al. Vascular ab-
normalities in patients with Stargardt disease assessed with optical coherence tomography angiography. Br J Ophthalmol 2017;101:780-5.
14. Sugahara M, Miyata M, Ishihara K, et al. Optical coherence to- mography angiography to estimate retinal blood flow in eyes with retinitis pigmentosa. Sci Rep 2017;7:46396.
15. Iafe NA, Phasukkijwatana N, Chen X, Sarraf D. Retinal capillary density and foveal avascular zone area are age-dependent:
quantitative analysis using optical coherence tomography angi- ography. Invest Ophthalmol Vis Sci 2016;57:5780-7.
16. Samara WA, Say EA, Khoo CT, et al. Correlation of foveal avascu- lar zone size with foveal morphology in normal eyes using op- tical coherence tomography angiography. Retina 2015;35:2188- 95.
17. Wang X, Jia Y, Spain R, et al. Optical coherence tomography an- giography of optic nerve head and parafovea in multiple sclero- sis. Br J Ophthalmol 2014;98:1368-73.
18. Al-Sheikh M, Tepelus TC, Nazikyan T, Sadda SR. Repeatability of automated vessel density measurements using optical coher- ence tomography angiography. Br J Ophthalmol 2017;101:449- 52.
19. Alnawaiseh M, Lahme L, Treder M, et al. Short-term effects of exercise on optic nerve and macular perfusion measured by op- tical coherence tomography angiography. Retina 2017;37:1642- 6.
20. Liu L, Jia Y, Takusagawa HL, et al. Optical coherence tomography angiography of the peripapillary retina in glaucoma. JAMA Oph- thalmol 2015;133:1045-52.
21. Wang X, Kong X, Jiang C, et al. Is the peripapillary retinal perfu- sion related to myopia in healthy eyes? A prospective compara- tive study. BMJ Open 2016;6:e010791.
22. Toto L, Borrelli E, Mastropasqua R, et al. Macular features in ret- initis pigmentosa: correlations among ganglion cell complex thickness, capillary density, and macular function. Invest Oph- thalmol Vis Sci 2016;57:6360-6.
23. Koyanagi Y, Murakami Y, Funatsu J, et al. Optical coherence tomography angiography of the macular microvasculature changes in retinitis pigmentosa. Acta Ophthalmol 2018;96:e59- 67.
24. Andréasson SO, Sandberg MA, Berson EL. Narrow-band filtering for monitoring low-amplitude cone electroretinograms in reti- nitis pigmentosa. Am J Ophthalmol 1988;105:500-3.
25. Nakagawa S, Oishi A, Ogino K, et al. Association of retinal vessel attenuation with visual function in eyes with retinitis pigmento- sa. Clin Ophthalmol 2014;8:1487-93.
26. Cellini M, Strobbe E, Gizzi C, Campos EC. ET-1 plasma levels and ocular blood flow in retinitis pigmentosa. Can J Physiol Pharma- col 2010;88:630-5.
27. Konieczka K, Flammer AJ, Todorova M, et al. Retinitis pigmento- sa and ocular blood flow. EPMA J 2012;3:17.