pISSN: 0378-6471⋅eISSN: 2092-9374
http://dx.doi.org/10.3341/jkos.2014.55.6.860
Original Article
빛간섭단층촬영기로 측정한 국소지점별 망막두께 정상치를 활용한 녹내장성 시야감도저하 진단능력
Diagnostic Abilities to Detect Glaucomatous Abnormality Using Normal Retinal Thickness Measured by Optical Coherence Tomography
배은진⋅김경래⋅유영철
Eun Jin Bae, MD, Kyoung Lae Kim, MD, Young Cheol Yoo, MD
한림대학교 의과대학 강동성심병원 안과학교실
Department of Ophthalmology, Kangdong Sacred Heart Hospital, Hallym University College of Medicine, Seoul, Korea
Purpose: Recently, the introduction of spectral-domain optical coherence tomography (SD-OCT) has enabled measurement of retinal thickness in the posterior pole in 64 sectors. SD-OCT was used to evaluate the diagnostic effectiveness in detecting glau- comatous abnormality of visual field sensitivity. A normal value for retinal thickness was determined and then compared in corre- sponding local sectors.
Methods: Thirty healthy controls and 30 glaucoma subjects were evaluated. Macular thickness values from the 4 adjacent square cells in an 8 x 8 posterior pole retinal thickness map were averaged for a mean retinal thickness (MRT) value. A norma- tive database was prepared using the data from the healthy eyes of this study to determine the diagnostic criteria for MRT. If the MRT value was <5% (Criteria A) or <1% (Criteria B) of the normative database, it was considered to be abnormal. The abnormal- ities of the MRT value for each diagnostic criteria were compared with the visual field sensitivity results in the corresponding positions.
Results: The concordance of abnormalities between MRT and visual field sensitivity at 16 measured points was low in both cri- teria A (Kappa value; -0.418~0.429) and B (Kappa value; -0.363~0.444). Based on the results of the visual field at each focal point, the sensitivities and specificities of MRT values using the 2 criteria ranged from 0% to 100%.
Conclusions: In this study, MRT values showed low correlation and diagnostic ability to detect decreased sensitivity of the visual field in corresponding points, when customized criteria derived from a normative database were applied.
J Korean Ophthalmol Soc 2014;55(6):860-867
Key Words: Glaucoma, Retinal thickness, Spectral domain optical coherence tomography, Standard automated perimetry, Visual field sensitivity
■Received: 2013. 8. 16. ■ Revised: 2014. 1. 15.
■Accepted: 2014. 5. 15.
■Address reprint requests to Young Cheol Yoo, MD
Department of Ophthalmology, Kangdong Sacred Heart Hospital,
#150 Seongan-ro, Gangdong-gu, Seoul 134-701, Korea Tel: 82-2-2224-2274, Fax: 82-2-470-2088
E-mail: [email protected]
ⓒ2014 The Korean Ophthalmological Society
This is an Open Access article distributed under the terms of the Creative Commons Attribution Non-Commercial License (http://creativecommons.org/licenses/by-nc/3.0/) which permits unrestricted non-commercial use, distribution, and reproduction in any medium, provided the original work is properly cited.
녹내장은 망막신경절세포와 그 축삭의 손상에 의해 망막 신경섬유층과 시신경유두테의 두께 감소를 유발하는 진행
성 시신경병증으로, 시야검사로 측정되는 기능적 손상보다 구조적 손상 즉, 시신경유두와 망막신경섬유층의 변화가 선 행되는 질환으로 알려졌다.1-3 이전 연구를 통해 망막신경절 세포의 축삭이 40% 가량 소실되기 전까지는 녹내장성 시야 변화가 시야검사에서 나타나지 않는다고 보고되었다.4-7
빛간섭단층촬영기(optical coherence tomography)를 이용 한 시신경유두주위 망막신경섬유층 두께의 정량적 측정은 시신경에서 이어지는 무수섬유층의 두께를 측정하는 것으
로 녹내장진단에 있어서 높은 진단력을 보이는 것으로 알 려졌다.8-13 또한, 이전 연구를 통해 녹내장 환자에서 후극부 망막의 두께 감소와 시기능 사이에 유의한 상관관계가 있 음이 보고되었다.5 황반은 망막에서 망막신경절세포가 가장 높은 밀도로 존재하는 부위로, 중심와 주위 4.5 mm 내에 전체 망막신경절세포의 약 50%가 위치한다고 알려졌고, 황 반부 망막두께의 구성에 망막신경절세포는 약 30-35% 정 도 기여하는 것으로 보고되었다.6,7,14 광수용체층은 녹내장 안에서 그 두께의 변화가 없다고 알려져 있어,7 망막신경절 세포층의 손상이 녹내장안에서 망막두께 감소를 유발하는 가장 중요한 역할을 하게 되며, 망막 내 그 분포 차이로 인 하여 녹내장성 변화로 일어나는 망막신경절세포의 손상은 특별히 황반부 망막의 두께 변화를 유발한다. 이러한 이유 로 빛간섭단층촬영기를 이용한 황반부의 망막두께측정치 와 자동시야검사 결과의 시야감도 측정치를 이용하여 후극 부 망막의 구조-기능 관계를 살펴보았던 연구들이 수차례 보고되었으며, 그 결과는 다양하였다.15-19
망막의 국소위치에 따라 시야감도의 정상범위에 차이가 있어 중심망막은 높은 시야감도를 보이고 주변부 망막은 상대적으로 낮은 감도를 가지므로 기존 연구들처럼 단순히 황반부 전체 혹은 절반 부분의 평균두께와 시야검사결과의 mean deviation을 비교하는 것보다는 황반을 여러 개의 국 소지점으로 구분하여 각 지점의 망막두께와 상응하는 시야 감도를 비교해보는 것이 보다 정확한 구조-기능관계를 살 펴볼 수 있는 방법이 될 것이다.
최근 소개된 스펙트럼영역 빛간섭단층촬영기(spectral-do- main optical coherence tomography, SD-OCT)는 황반부를 64개의 지점으로 세밀하게 나누어 각 지점의 망막두께를 측정할 수 있게 되었다.20,21 이를 이용하여 정상 대조군의 국소지점별 정상 망막두께측정치를 알아보고 이 정상치를 기준으로 녹내장안의 국소지점별 망막두께측정치의 이상 여부를 판정한 결과가 자동시야검사 결과에서 상응하는 측 정지점의 시야감도의 이상여부와 얼마나 잘 일치하는지 비 교하였다. 이러한 방법을 통해 후극부망막에서 국소지점별 구조-기능 관계를 살펴보고, 이와 같은 진단방법이 녹내장 진단에서 임상적으로 유용한지 알아보고자 하였다.
대상과 방법
연구대상
본 연구는 2012년 6월부터 7월까지 한림대학교 강동성심 병원 안과에 내원한 정상인 40명과 초, 중기의 개방각녹내 장 환자 63명, 총 103명 중 나이가 40세에서 69세 사이인 피험자를 대상으로 하여 두 군에서 각각 30명을 선정하였
고, 각 피험자에서 한 쪽 눈만을 연구에 포함하였다.
모든 피험자들에서 교정시력검사, 자동굴절검사기를 이 용한 굴절검사(KR-8000; Topcon, Tokyo, Japan), 골드만압 평안압계를 이용한 안압측정, 세극등현미경검사, 칼라안저 사진촬영(VX-10 & KD-211C, KowaOptimed, Japan), 안구 길이측정, 전방각경검사, 자동시야검사 및 빛간섭단층촬영 을 시행하였다. 눈의 길이는 A스캔(A2500; Sonomed, New York, USA)을 이용해 5회 측정치의 평균값을 사용하였으 며, 5회 측정값의 표준편차가 0.1을 넘지 않는 평균치만을 취하여 사용하였다. 망막신경섬유층 사진은 산동 후에 디지 털 안저카메라와 내장된 녹색필터(TRC-50IA, Topcon Inc., Tokyo, Japan)를 이용하여 50도 촬영각도로 유두주위 망막 혈관에 초점을 맞추어 촬영하였다.
정상안은 안압상승의 병력이 없고, 안압 21 mmHg 이하 이며, 시신경유두와 망막신경섬유층에서 녹내장성 변화가 없고, 세극등현미경, 칼라안저사진 및 자동시야검사에서 비 정상소견이 없는 경우로 정의하였다. 녹내장안의 경우 특 징적인 녹내장성 시신경유두 소견과 망막신경섬유층 결손 을 보이며 2회 이상의 신뢰할 만한 시야검사에서 녹내장성 시야결손이 있는 경우로 정의하였다. 연구대상은 최대 교 정시력 20/30 이상, 구면렌즈 대응치 ±5.0디옵터 이내, 난시 3디옵터 이내이며 정상적인 전안부와 개방각 소견을 보이 는 경우, 시야검사 및 빛간섭단층촬영 결과에 영향을 미칠 수 있는 다른 안질환 및 신경학적 질환이 없는 경우만을 포 함하였다.
자동시야검사
자동시야검사는 Humphrey field analyzer II model 750 (Carl Zeiss Meditec, Dublin, CA, USA)을 이용하여 Swedish in- teractive threshold algorithm (SITA) standard의 central 24-2 pattern으로 검사하였다. 학습효과를 최소화하기 위하여, 가 장 최근에 시행한 자동시야검사 결과를 사용하였다. 주시 상실이 20% 미만이고 위양성 반응이 15% 미만인 경우에 신뢰할 만한 검사결과로 판정하였고, glaucoma hemifield test가 within normal limit일 때를 정상으로 판정하였다. 녹 내장성 시야결손은 최소 2회 이상의 신뢰할 만한 시야검사 에서 glaucoma hemifield test가 outside normal limit를 보이 거나 pattern standard deviation이 정상의 5% 미만으로 편위 된 경우이거나 pattern deviation plot에서 가장자리를 제외 한 부위에서 인접한 3개 이상 점의 역치가 정상의 5% 미만 으로 나타나고 그중 한 개 이상은 1% 미만인 경우로 정의 하였다.
자동시야검사의 52개 측정지점 중 중심 4x4 지점(16개) 을 분석하였고, 측정된 시야감도가 pattern deviation plot에
A B C
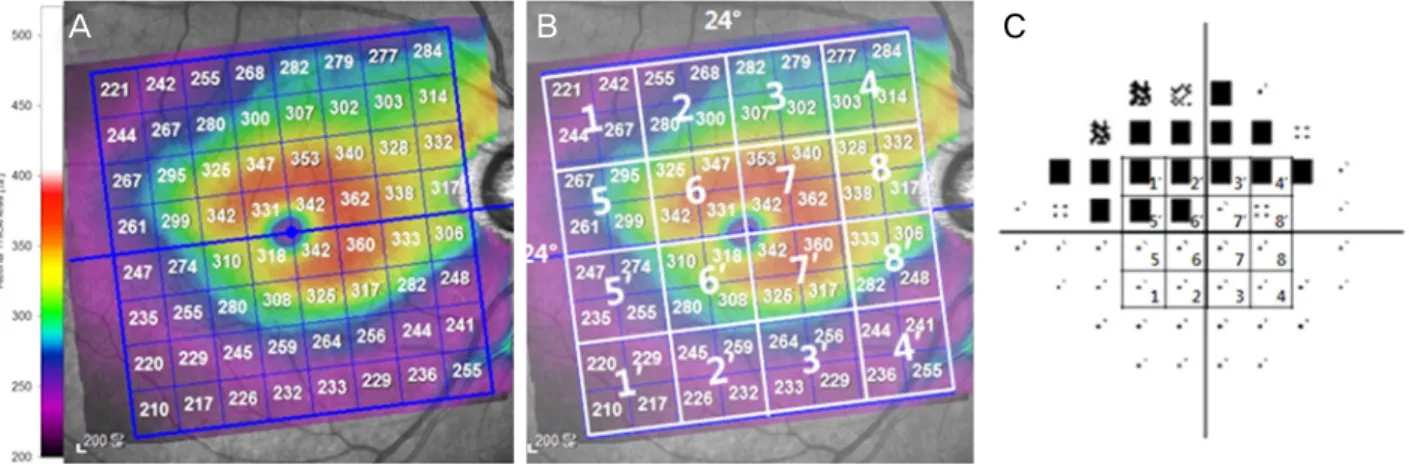
Figure 1. The mean retinal thickness mapping corresponding to the visual field sensitivity. (A) A macular thickness map yielded by
posterior pole asymmetry analysis of spectral domain optical coherence tomography is divided into 64 squares centered on the fovea. (B) We divided both the superior and inferior hemifields into 8 sectorsparts based on the horizontal raphe. Retinal thickness values of 4 ad- jacent square cells in the 8 × 8 grid of the posterior pole thickness map were averaged on the mean retinal thickness value. (C) Among the 52 test points of the central 24-2 pattern, the central 4 × 4 points corresponding to the 24° × 24° posterior pole thickness map of the SPECTRALIS spectral-domain optical coherence tomography (SD-OCT) were considered. Same number between (B) and (C) indicated a pair of sector to undergo statistical analysis.서 정상의 1% 미만일 경우 비정상으로 정의하여, 16개 각 지점별로 비정상 여부를 조사하였다(Fig. 1).
스펙트럼영역 빛간섭단층촬영
빛간섭단층촬영은 소프트웨어버전5.4.6인 SPECTRALIS SD-OCT (Heidelberg Retinal Engineering, Dossenheim, Germany)를 이용하여 중심망막의 30°×25° 범위를 촬영하 는 posterior pole asymmetry analysis volume scans 방식을 이용해 후극부망막 전체를 촬영하였다. 검사는 숙련된 한 명의 검사자에 의해 자동시야검사와 동일한 날짜에 시행되 었고, 격자의 중심이 황반 중심에 잘 위치하고 망막에 이미 지의 초점이 잘 맞으며 신호강도가 16 이상을 보이는 경우 만을 결과 분석에 포함하였다.
SPECTRALIS SD-OCT의 후극부 망막두께측정결과는 30°×25°의 촬영 범위 중 24°×24° 범위가 분석되어, 황반과 시신경을 중심축으로 하는 8×8개 사각형으로 표시하고, 각 사각형에는 3°×3° 범위의 망막두께평균값이 표시된다. 이러 한 빛간섭단층촬영 결과의 연속되는 4개 지점은 6°×6° 범위 이며, 이는 자동시야검사의 하나의 측정지점과 동일한 범 위를 가진다. 이와 같이 두 검사 간에 망막 내 동일한 위치 의 측정지점을 대응시킬 수 있음을 이용하여, 빛간섭단층 촬영 결과의 연속되는 4개의 사각형을 하나의 구역으로 설 정하여, 황반과 시신경을 있는 선을 축으로 상, 하측 별로 각 8개 구역을 지정하였다(Fig. 1).
정상 대조군의 후극부 망막두께측정치의 평균값을 16개 구역별로 계산하여, 녹내장군의 각 측점지점 별 망막두께 의 비정상여부 판정기준을 설정하였다. 즉, 정상안에서 측
정된 망막두께 측정치의 하위 5% (진단기준 A)와 하위 1%
(진단기준 B) 미만에 포함되는 경우를 비정상으로 정의하 여, 녹내장 환자에서 SD-OCT 결과 판정에 이용하였다.
통계분석
대조군과 녹내장군의 연구대상의 특성을 비교하기 위하 여 카이제곱분석과 독립표본 t 검정을 이용하였으며, 국소 지점별 두 군사이의 후극부 망막두께 평균값의 비교를 위 해 독립표본 t 검정을 이용하였다. 녹내장군의 비정상 판별 기준 설정을 위해 정상안의 망막두께측정치의 하위 5% (진 단기준 A)와 하위 1% (진단기준 B) 값을 구하였다. 16개 국소지점에서 자동시야검사의 시야감도와 빛간섭단층촬영 기의 후극부 망막두께측정치의 비정상여부 판정결과의 일 치도 비교를 위해서 코헨카파값을 이용한 교차분석을 시행 하였다. 또한, 16개 국소지점에서 자동시야검사결과를 기준 으로 하여 녹내장 진단에서 후극부 망막두께 측정의 민감 도와 특이도를 계산하였다. 통계학적 분석은 SPSS 19.0 doctor’s pack (SPSS Inc., Chicago, IL)을 이용하였고, p-value 가 0.05 미만인 경우를 통계적으로 유의한 것으로 간주하였다.
결 과
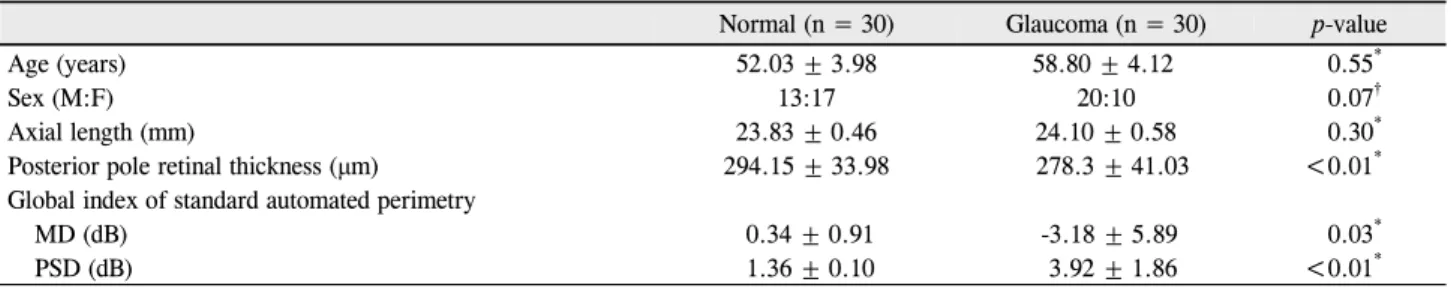
본 연구결과의 최종 분석에는 정상군과 녹내장군에 각각 30명(30안)이 포함되었다. 나이, 성별 및 안구길이는 두 군 사이에 통계적으로 유의한 차이가 없었으나 자동시야검사 결과 및 후극부의 평균 망막두께는 유의한 차이가 있었으 며(Table 1), 녹내장군의 시신경유두주위 평균 망막신경섬
Table 1. Demographic characteristics of study participants
Normal (n = 30) Glaucoma (n = 30) p-value
Age (years) 52.03 ± 3.98 58.80 ± 4.12 0.55*
Sex (M:F) 13:17 20:10 0.07†
Axial length (mm) 23.83 ± 0.46 24.10 ± 0.58 0.30*
Posterior pole retinal thickness (μm) 294.15 ± 33.98 278.3 ± 41.03 <0.01*
Global index of standard automated perimetry
MD (dB) 0.34 ± 0.91 -3.18 ± 5.89 0.03*
PSD (dB) 1.36 ± 0.10 3.92 ± 1.86 <0.01*
Values are presented as mean ± SD.
MD = median deviation; PSD = pattern standard deviation.
*Independent t-test; †Chi-square test.
Table 2. Mean retinal thickness of normal and glaucomatous eyes and cut off values in 16 sectors as well as average determined by
SD-OCTSector Control Glaucoma
Mean ± SD (μm) Range (μm) <5% (μm) <1% (μm) Mean ± SD (μm) p-value*
Superior 1 242.61 ± 8.57 230.25-254.50 224.08 217.25 231.76 ± 11.90 <0.01
2 273.20 ± 9.99 259.50-288.75 251.66 248.75 258.14 ± 15.43 <0.01
3 292.49 ± 10.23 277.75-311.00 277.79 269.00 273.30 ± 18.02 <0.01
4 307.06 ± 12.75 287.25-334.00 287.25 284.50 274.10 ± 22.34 <0.01
5 268.84 ± 12.55 244.50-288.25 242.36 237.00 256.62 ± 13.43 <0.01
6 322.70 ± 13.50 294.50-338.00 293.55 291.75 306.86 ± 15.70 <0.01
7 336.46 ± 13.72 305.75-344.25 309.03 308.25 323.58 ± 18.77 0.04
8 314.27 ± 13.20 289.75-333.25 289.90 282.00 299.94 ± 35.23 0.04
Inferior 1’ 268.50 ± 9.89 227.50-321.25 249.15 245.00 224.07 ± 15.32 <0.01
2’ 269.24 ± 11.09 255.00-305.25 250.49 243.75 246.82 ± 14.75 <0.01
3’ 287.96 ± 12.54 268.25-314.75 265.64 261.75 261.62 ± 19.69 <0.01
4’ 304.00 ± 15.00 251.50-324.75 279.30 251.50 272.17 ± 27.47 <0.01
5’ 269.78 ± 16.58 249.50-336.25 244.51 234.75 254.58 ± 13.72 <0.01
6’ 324.26 ± 14.19 295.00-344.50 293.81 290.00 304.43 ± 19.28 <0.01
7’ 331.91 ± 14.12 302.00-352.00 305.36 302.00 319.86 ± 21.19 <0.01
8’ 313.50 ± 15.75 287.75-346.50 287.80 283.50 292.54 ± 20.52 <0.01
Values are presented as mean ± SD.
SD-OCT = spectral-domain optical coherence tomography; SD = standard deviation.
*Independent t-test to compare mean retinal thickness between healthy control eyes and glaucomatous eye.
유층두께는 80.57 ± 10.42 μm였다.
후극부의 16개 국소지점별 망막의 평균두께는 모든 지점 에서 녹내장군이 얇았고 그 차이는 통계적으로 유의하였다.
두 군 모두에서 시신경과 황반 사이의 측정지점(지점 6, 7, 8, 6’, 7’, 8’)에서 다른 지점들에 비해 상대적으로 더 두꺼 운 망막두께를 보였다(Table 2). 16개 국소지점에서 녹내장 군의 망막두께측정치의 비정상여부 판별 기준이 되는 정상 군의 국소지점별 망막두께측정치의 하위 5% (진단기준 A) 및 하위 1% (진단기준 B)에 해당하는 망막두께는 Table 2 와 같았다.
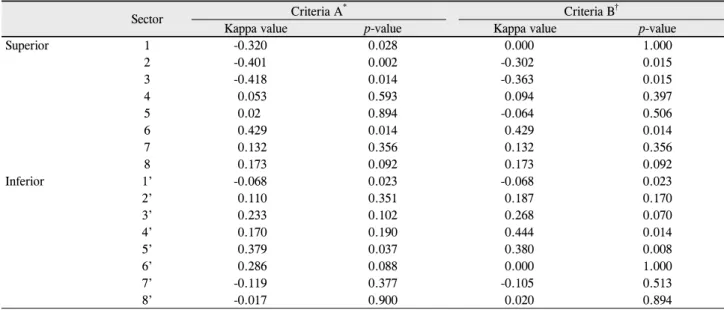
Table 3은 16개 측정지점에서 파악한 자동시야검사 및 SD-OCT 비정상 판정결과의 일치도를 코헨카파값을 이용 하여 분석한 결과이다. 진단기준 A를 이용하였을 때 카파 값은 -0.418~0.429였고, 진단기준 B을 이용한 경우 카파값 은 -0.363~0.444로, 두 진단기준 모두에서 자동시야검사와
SD-OCT 결과의 비정상 판정여부는 낮은 일치도를 보였다.
Table 4는 16개 국소지점에서 자동시야검사결과를 기준으 로 하여 녹내장 진단에서 후극부 망막두께 측정의 민감도 와 특이도를 계산하였다. 각 지점에서 민감도와 특이도는 0.0-100.0%로 다양한 범위를 보여주었다.
고 찰
녹내장성 변화로 망막신경절세포와 축삭이 손상되며 기 능적으로 망막신경절세포의 시야감도가 감소되는 것으로 나타나게 된다. 후극부 망막은 녹내장에서 손상되는 망막 신경절세포가 높은 밀도로 분포하는 부위로, 녹내장의 구 조적 진단에 유용하게 이용될 수 있을 것으로 고려되고 있
다.6,7,14 황반부의 두께 감소와 녹내장 사이에 연관성이 있
음이 보고되었고,22,23 빛간섭단층촬영기의 시신경유두주위
Table 3. Agreements of abnormal judgment between visual field sensitivity and mean retinal thickness, measurement in 16 tested sectors
Sector Criteria A* Criteria B†
Kappa value p-value Kappa value p-value
Superior 1 -0.320 0.028 0.000 1.000
2 -0.401 0.002 -0.302 0.015
3 -0.418 0.014 -0.363 0.015
4 0.053 0.593 0.094 0.397
5 0.02 0.894 -0.064 0.506
6 0.429 0.014 0.429 0.014
7 0.132 0.356 0.132 0.356
8 0.173 0.092 0.173 0.092
Inferior 1’ -0.068 0.023 -0.068 0.023
2’ 0.110 0.351 0.187 0.170
3’ 0.233 0.102 0.268 0.070
4’ 0.170 0.190 0.444 0.014
5’ 0.379 0.037 0.380 0.008
6’ 0.286 0.088 0.000 1.000
7’ -0.119 0.377 -0.105 0.513
8’ -0.017 0.900 0.020 0.894
*If the average macular thickness value was <5% of that in the normative database, it was considered to be abnormal; †If the average macular thickness value was <1% of that in the normative database, it was considered to be abnormal.
Table 4. The sensitivity and specificity of diagnostic criteria A and B of retinal thickness measurements to detect abnormal visual
field sensitivity in 16 tested sectorsSector Criteria A Criteria B
Sensitivity (%) Specificity (%) Sensitivity (%) Specificity (%)
Superior 1 40.00 20.00 90.00 10.00
2 14.29 21.74 28.57 21.74
3 0.00 47.83 14.29 30.43
4 80.00 32.00 80.00 40.00
5 11.11 90.48 0.00 95.23
6 66.67 88.89 66.67 88.89
7 50.00 78.57 50.00 78.57
8 100.00 75.86 100.00 75.86
Inferior 1’ 80.00 0.00 80.00 0.00
2’ 75.00 50.00 75.00 61.54
3’ 80.00 60.00 80.00 64.00
4’ 80.00 52.00 60.00 88.00
5’ 57.14 82.61 28.57 100.00
6’ 66.67 70.83 66.67 75.00
7’ 0.00 71.43 0.00 82.14
8’ 33.33 62.96 33.33 70.37
망막신경섬유층 두께 분석의 대안으로 황반부 망막의 두께 분석이 녹내장 진단에 이용될 수 있는 가능성도 보고되었 다.24 녹내장 진단 시 단순한 구조-기능 상관관계의 여부를 조사하는 것보다는 본 연구처럼 망막을 작은 국소지점으로 세분하여 시야감도가 비정상인 상응하는 망막부위의 두께 가 특이적으로 감소되었는지 여부를 확인해보는 것이 좀 더 임상적인 의미가 있을 것으로 생각한다.
SD-OCT로 측정한 황반부 망막두께는 예상했던 대로 16 개의 측정지점 모두에서 녹내장군과 정상군에서 유의한 차 이가 있었다. 그러나, 녹내장군과 유사한 연령대의 정상대
조군에서 측정된 각 국소지점의 정상망막두께측정치를 분 석하여 설정한 진단기준 A와 B를 이용한 녹내장군의 각 국 소지점별 망막신경섬유층의 비정상여부 판정이 상응하는 지점의 자동시야검사결과의 비정상여부 판정과 상대적으 로 낮은 일치도를 보였다. 이는 정상치를 이용한 후극부 망 막전체층 두께판정이 녹내장진단에서 임상적인 유용성이 낮을 수 있다는 점을 시사한다.
이와 같이 낮은 일치도를 보인 원인을 다음과 같이 여러 측면에서 고려해 볼 수 있겠다. 우선 자동시야검사는 피험 자가 검사결과에 상당한 영향을 미치는 주관적인 검사로
이러한 특성에 의해 측정오차가 발생할 수 있다. 또한 자동 시야검사와 빛간섭단층촬영 결과를 비교하기 위해 망막 내 동일위치에 상응하는 16개의 지점이 같은 각도를 갖도록 설정했으나, 망막상의 확대효과나 검사 시 환자자세 등에 의해 정확히 동일 위치의 지점을 비교하지 못 하였을 수 있 다. 또한 시야감도의 비정상 여부 판정을 정상인의 1% 미 만에 해당하는 경우로 고정하여 분석한 점, SD-OCT가 녹 내장성 변화를 보이는 망막신경섬유층 부분만이 아니라 전 층 망막두께를 측정한다는 점 역시 두 검사 간에 낮은 일치 도를 보이는 요인으로 작용할 수 있다. 이전 연구를 통해 시신경유두주위 망막신경섬유층 두께측정치가 황반 두께 측정치보다 우월한 진단력을 나타내고, 황반부의 두께는 전층 망막의 두께이므로 망막신경섬유층의 두께보다 녹내 장의 구조적 손상을 반영함에 있어 민감도가 떨어진다는 것이 보고된 바 있다.25-27 정상 대조군과 녹내장군의 특성차 이도 연구결과에 영향을 미칠 수 있다. 두 군의 평균나이에 통계적으로 유의한 차이는 없었으나(p=0.55), 정상치 분석 을 위한 대조군의 나이 범위가 20년으로 상당히 넓은 편이 었다. 이는 연령에 따른 망막두께의 변화가 정확히 반영되 지 않았을 가능성도 시사하나, 연령에 따른 망막두께의 감 소량이 각 측정지점에서 매 10년마다 2.3-5.2 μm로 표준편 차 내에 포함되는 결과를 보여 나이 차이에 의한 영향은 그 리 크지 않을 것으로 생각한다. 마지막으로 통계적으로는 유의하지 않지만(p=0.07) 두 군의 남녀비 차이도 고려해 볼 요소이다. 녹내장 군은 여자에 비해 남자의 비율이 2배이 나, 대조군에서는 여자의 비율이 높다. 남자가 여자에 비해 더 두꺼운 황반두께를 가진다고 보고되었기에28-30 본 연구 에서 여자의 비율이 높은 대조군을 활용해 평균 망막두께 비정상 판정기준을 설정했음을 고려할 때, 판정기준이 좀 더 엄격하게 설정되었을 가능성이 있다.
황반부 망막두께를 활용한 녹내장의 구조적 손상의 진단 시 망막앞막, 황반부종, 황반변성 등 기저망막질환이 동반 되는 경우에는 망막두께 측정치의 임상적 이용에 제한이
있다.11-13 그러나 시신경주위의 위축이나 기울어짐이 심할
경우, 혹은 시신경유두가 매우 크거나 작은 경우 등 시신경 유두주위 망막신경섬유층 두께의 변이가 심한 경우는 시신 경유두주위 망막신경층 두께를 이용한 초기 녹내장의 진단 에 제한이 있고, 이러한 경우 스펙트럼영역 빛간섭단층촬 영기를 이용한 후극부 망막두께 측정치가 시신경 유두주위 망막신경층 분석과 함께 녹내장의 구조적 손상을 진단하는 데 유용하게 사용될 수 있겠다. 또한 이전 보고에 따르면 SPECTRALIS SD-OCT의 망막두께측정은 높은 재현성을 보인다는 점도31,32 이를 통해 녹내장의 진행여부에 대한 좀 더 객관적인 판정이 가능할 수 있다는 것을 시사한다. 말기
녹내장에서 심한 시야결손으로 시야검사를 통한 경과 관찰 이 어려운 경우에도 후극부 망막두께 촬영이 녹내장 진행 여부 파악에 도움이 될 수 있다.
SPECTRALIS SD-OCT의 posterior pole asymmetry anal- ysis를 이용한 Kim et al31의 연구에 따르면 자동시야검사 결과 후극부 망막두께 측정치 사이에 높은 연관성을 보였 다. 그러나 이전 연구는 측정수치를 이용하여 임상적인 응 용은 어려운 실정으로 본 연구에서는 정상데이터베이스를 만들어 임의 진단기준으로 설정하고, 이것에 따라 비정상 여부를 판단하여 연구를 진행하였으나, 정상치의 설정에 여러 한계점이 있어, 임상적 유용성을 밝히는 데에는 실패 하였다. 그러나, 본 연구의 방법론에 여러 가지 제한점이 있으므로 이와 같은 결과를 일반화하기에는 한계가 있겠다.
후극부 망막두께 측정치의 녹내장 진단에서의 임상적 이용 을 위해서는 나이, 성별, 인종 등 망막두께 측정에 영향을 미칠 수 있는 요소들이 고려된 세분화된 정상데이터베이스 가 필요하고, 이를 이용한 추가적인 임상연구가 진행되어 야 한다.
REFERENCES
1) Quigley HA, Katz J, Derick RJ, et al. An evaluation of optic disc and nerve fiber layer examinations in monitoring progression of early glaucoma damage. Ophthalmology 1992;99:19-28.
2) Sommer A, Katz J, Quigley HA, et al. Clinically detectable nerve fiber atrophy precedes the onset of glaucomatous field loss. Arch Ophthalmol 1991;109:77-83.
3) Zeyen TG, Caprioli J. Progression of disc and field damage in early glaucoma. Arch Ophthalmol 1993;111:62-5.
4) Sihota R, Sony P, Gupta V, et al. Comparing glaucomatous optic neuropathy in primary open angle and chronic primary angle clo- sure glaucoma eyes by optical coherence tomography. Ophthalmic Physiol Opt 2005;25:408-15.
5) Quigley HA, Dunkelberger GR, Green WR. Retinal ganglion cell atrophy correlated with automated perimetry in human eyes with glaucoma. Am J Ophthalmol 1989;107:453-64.
6) Curcio CA, Allen KA. Topography of ganglion cells in human retina. J Comp Neurol 1990;300:5-25.
7) Zeimer R, Asrani S, Zou S, et al. Quantitative detection of glau- comatous damage at the posterior pole by retinal thickness mapping. A pilot study. Ophthalmology 1998;105:224-31.
8) Burgansky-Eliash Z, Wollstein G, Chu T, et al. Optical coherence tomography machine learning classifiers for glaucoma detection:
A preliminary study. Invest Ophthalmol Vis Sci 2005;46:4147-52.
9) Huang ML, Chen HY. Development and comparison of automated classifiers for glaucoma diagnosis using Stratus optical coherence tomography. Invest Ophthalmol Vis Sci 2005;46:4121-9.
10) Manassakorn A, Nouri-Mahdavi K, Caprioli J. Comparison of reti- nal nerve fiber layer thickness and optic disk algorithms with opti- cal coherence tomography to detect glaucoma. Am J Ophthalmol 2006;141:105-15.
11) Medeiros FA, Zangwill LM, Bowd C, et al. Evaluation of retinal nerve fiber layer, optic nerve head, and macular thickness measure- ments for glaucoma detection using optical coherence tomography.
Am J Ophthalmol 2005;139:44-55.
12) Parikh RS, Parikh S, Sekhar GC, et al. Diagnostic capability of op- tical coherence tomography (stratus OCT 3) in early glaucoma.
Ophthalmology 2007;114:2238-43.
13) Lalezary M, Medeiros FA, Weinreb RN, et al. Baseline optical co- herence tomography predicts the development of glaucomatous change in glaucoma suspects. Am J Ophthalmol 2006;142:576-82.
14) Garway-Heath DF, Caprioli J, Fitzke FW, Hitchings RA. Scaling the hill of vision: the physiological relationship between light sen- sitivity and ganglion cell numbers. Invest Ophthalmol Vis Sci 2000;41:1774-82.
15) Parikh RS, Parikh SR, Thomas R. Diagnostic capability of macular parameters of Stratus OCT 3 in detection of early glaucoma. Br J Ophthalmol 2010;94:197-201.
16) Wollstein G, Ishikawa H, Wang J, et al. Comparison of three opti- cal coherence tomography scanning areas for detection of glau- comatous damage. Am J Ophthalmol 2005;139:39-43.
17) Nakatani Y, Higashide T, Ohkubo S, et al. Evaluation of macular thickness and peripapillary retinal nerve fiber layer thickness for detection of early glaucoma using spectral domain optical coher- ence tomography. J Glaucoma 2011;20:252-9.
18) Na JH, Sung KR, Baek S, et al. Macular and retinal nerve fiber lay- er thickness: which is more helpful in the diagnosis of glaucoma?
Invest Ophthalmol Vis Sci 2011;52:8094-101.
19) Leung CK, Chan WM, Yung WH, et al. Comparison of macular and peripapillary measurements for the detection of glaucoma: an optical coherence tomography study. Ophthalmology 2005;112:
391-400.
20) Wolf-Schnurrbusch UE, Ceklic L, Brinkmann CK, et al. Macular thickness measurements in healthy eyes using six different optical coherence tomography instruments. Invest Ophthalmol Vis Sci 2009;50:3432-7.
21) Han IC, Jaffe GJ. Evaluation of artifacts associated with macular spectral-domain optical coherence tomography. Ophthalmology
2010;117:1177-1189.e4.
22) Asrani S, Challa P, Herndon L, et al. Correlation among retinal thickness, optic disc, and visual field in glaucoma patients and sus- pects: a pilot study. J Glaucoma 2003;12:119-28.
23) Greenfield DS, Bagga H, Knighton RW. Macular thickness changes in glaucomatous optic neuropathy detected using optical coherence tomography. Arch Ophthalmol 2003;121:41-6.
24) Asrani S, Rosdahl JA, Allingham RR. Novel software strategy for glaucoma diagnosis: asymmetry analysis of retinal thickness. Arch Ophthalmol 2011;129:1205-11.
25) Ojima T, Tanabe T, Hangai M, et al. Measurement of retinal nerve fiber layer thickness and macular volume for glaucoma detection using optical coherence tomography. Jpn J Ophthalmol 2007;51:
197-203.
26) Tan O, Li G, Lu AT, et al. Mapping of macular substructures with optical coherence tomography for glaucoma diagnosis. Ophthalmology 2008;115:949-56.
27) Ishikawa H, Stein DM, Wollstein G, et al. Macular segmentation with optical coherence tomography. Invest Ophthalmol Vis Sci 2005;46:2012-7.
28) Wagner-Schuman M, Dubis AM, Nordgren RN, et al. Race- and sex-related differences in retinal thickness and foveal pit morphology.
Invest Ophthalmol Vis Sci 2011;52:625-34.
29) Kashani AH, Zimmer-Galler IE, Shah SM, et al. Retinal thickness analysis by race, gender, and age using Stratus OCT. Am J Ophthalmol 2010;149:496-502.
30) Ooto S, Hangai M, Sakamoto A, et al. Three-dimensional profile of macular retinal thickness in normal Japanese eyes. Invest Ophthalmol Vis Sci 2010;51:465-73.
31) Kim JM, Sung KR, Yoo YC, Kim CY. Point-wise relationships be- tween visual field sensitivity and macular thickness determined by spectral-domain optical coherence tomography. Curr Eye Res 2013;38:894-901.
32) Pierro L, Giatsidis SM, Mantovani E, Gagliardi M. Macular thick- ness interoperator and intraoperator reproducibility in healthy eyes using 7 optical coherence tomography instruments. Am J Ophthalmol 2010;150:199-204.
= 국문초록 =
빛간섭단층촬영기로 측정한 국소지점별 망막두께 정상치를 활용한 녹내장성 시야감도저하 진단능력
목적: 최근 SD-OCT는 황반부의 64개 지점에서 전층 망막두께를 측정할 수 있게 되었다. 이를 이용해, SD-OCT로 측정한 국소지점별 망막두께 측정치를 활용하여 자동시야검사의 녹내장성 시야감도저하의 진단능력을 평가해보고자 한다.
대상과 방법: 정상 피험자 30명과 개방각녹내장 환자 30명을 대상으로 하였다. 후극부 망막 8x8 측정지점의 인접한 4개 사각형의 망막 두께 평균값을 계산하였다. 녹내장군의 망막두께측정치의 비정상 판별을 위한 진단기준은 본 연구의 대조군을 이용하여 측정한 정상 망막두께를 정상데이터베이스로 활용하여 국소지점별 망막두께측정치의 하위 5% (진단기준 A) 및 1% (진단기준 B)로 설정하였다.
각 진단기준을 이용한 국소지점별 망막두께측정치의 이상여부를 대응하는 위치의 자동시야검사 결과의 비정상 여부와 비교하였다.
결과: 16개 측정지점에서 계산한 시야감도와 평균 망막두께의 비정상 판정결과의 일치도는 진단기준 A (카파값, -0.418~0.429)와 B (카파값, -0.363~0.444) 모두 낮았다. 각 국소지점에서의 자동시야검사 결과를 기준으로 하였을 때 두 가지 진단기준을 이용한 평균 망막두께 측정치의 민감도와 특이도는 0.0%에서 100%로 다양한 범위를 보였다.
결론: 본 연구에서 SD-OCT를 이용하여 측정한 전층 망막두께측정치는 정상인의 측정치를 활용한 임의 진단기준을 적용하였을 때 대응하는 국소지점의 녹내장성 시야감도 저하를 발견하는 데 상대적으로 낮은 일치도와 진단력을 보여주었다.
<대한안과학회지 2014;55(6):860-867>