INTRODUCTION
Hypertension is a major underlying cause of cardio-cerebro-
vascular diseases, such as myocardial infarction, congestive heart failure, peripheral vascular disease, and stroke.1,2 The American Heart Association has estimated that about 32.6%
of American adults over 20 years of age are hypertensive;2 the Korean Ministry of Health and Welfare determined the recent prevalence of hypertension in Korean adults to be 25.5%.3 Ele- vated blood pressure (BP) was the leading single risk factor of worldwide economic burden of disease.4 According to a mas- sive-scale observational study in Korean male adults, the pop- ulation-attributable fraction of hypertension for the risks of cerebrovascular diseases and ischemic cardiovascular diseases were 35% and 21%, respectively.5
Therefore, it is important to recognize BP trends and demo- graphic factors in the general population to promote public Received: September 28, 2017 Revised: January 31, 2018
Accepted: February 14, 2018
Corresponding author: Dr. Hee-Taik Kang, Department of Family Medicine, Chungbuk National University College of Medicine, 1 Chungdae-ro, Seowon-gu, Cheongju 28644, Korea.
Tel: 82-43-269-6301, Fax: 82-43-269-6675, E-mail: [email protected]
*Tae-Jong Kim and Jae-woo Lee contributed equally to this work.
•The authors have no financial conflicts of interest.
© Copyright: Yonsei University College of Medicine 2018
This is an Open Access article distributed under the terms of the Creative Com- mons Attribution Non-Commercial License (http://creativecommons.org/licenses/
by-nc/4.0) which permits unrestricted non-commercial use, distribution, and repro- duction in any medium, provided the original work is properly cited.
Trends in Blood Pressure and Prevalence of Hypertension in Korean Adults Based on the 1998–2014 KNHANES
Tae-Jong Kim
1,2*, Jae-woo Lee
1*, Hee-Taik Kang
3,4,5, Myeong-Chan Cho
6, Hyoung-Ji Lim
1, Jin-Young Kim
1, Jang-Whan Bae
6, Yong-Jae Lee
7, Sang-Hyun Lee
8, John A. Linton
9, and Yeseul Kim
11Department of Family Medicine, Chungbuk National University Hospital, Cheongju;
2Department of Epidemiology and Health Promotion, Graduate School of Public Health, Yonsei University, Seoul;
3Department of Family Medicine, Chungbuk National University College of Medicine, Cheongju;
4Department of Medicine, Graduate School of Yonsei University, Seoul;
5Graduate School, College of Medicine, Yonsei University, Seoul;
6Division of Cardiology, Department of Internal Medicine, Chungbuk National University College of Medicine, Cheongju;
7Departement of Family Medicine, Gangnam Severance Hospital, Yonsei University College of Medicine, Seoul;
8Department of Family Medicine, National Health Insurance Service Ilsan Hospital, Goyang;
9International Health Care Center, Severance Hospital, Yonsei University College of Medicine, Seoul, Korea.
Purpose: To investigate trends in blood pressure (BP) and hypertension prevalence in Korea.
Materials and Methods: Based on the Korean National Health and Nutrition Examination Survey (KNHANES) I (1998), II (2001), III (2005), IV (2007−2009), V (2010−2012), and VI (2013−2014), 56077 participants (23974 men and 32103 women) were included.
Results: Mean systolic BP (SBP) and diastolic BP (DBP) decreased in both sexes (male SBP: 128.1 to 120.2 mm Hg, male DBP:
82.0 to 78.5 mm Hg; female SBP: 125.7 to 116.0 mm Hg and female DBP: 77.4 to 73.2 mm Hg from the KNHANES I–VI). The age- standardized prevalence of hypertension was significantly decreased in both sexes (male; 33.3% to 30.3%, female; 28.7% to 22.7%, all p for trend <0.001). Regardless of taking anti-hypertensive medication or not, SBP and DBP declined universally in both sexes.
Compared to the KNHANES I, the odds ratios (95% confidence intervals) of the KNHANES II to VI for less-than-normotensive and less-than-hypertensive BP increased in both sexes.
Conclusion: Mean BP levels in both sexes and hypertension prevalence showed downward trends during the 16-year period.
Key Words: Trend, blood pressure, hypertension, prevalence, epidemiology
pISSN: 0513-5796 · eISSN: 1976-2437 Yonsei Med J 2018 May;59(3):356-365
https://doi.org/10.3349/ymj.2018.59.3.356
health and create health policies. According to a recent study,6 the age-adjusted prevalence of hypertension in US adults was 29.0% in 1999–2000 and 30.5% in 2007–2008; this was not a statistically significant increase. Although the prevalence of hy- pertension varies widely among different ethnic populations,7 there have been only a few investigations of hypertension prevalence,8,9 and few have addressed recent trends in BP or hypertension in Korea based on representative data.
The purpose of this study was to investigate the long-term diachronic trends of BP and hypertension prevalence among Korean adults using data from the Korean National Health and Nutrition Examination Survey (KNHANES) I–VI. We examined the same results after stratifying the participants according to anti-hypertensive medication to exclude the treatment effect on the trends in BP.
MATERIALS AND METHODS
Subjects
The KNHANES is a nationally representative, cross-sectional survey that is conducted by the Korean Ministry of Health and Welfare every three or four years: the KNHANES Phase I (1998), II (2001), III (2005), IV (2007−2009), V (2010−2012), and VI (2013−2015) studies. Data from 1998−2014 were included in this study. The KNHANES contains a Health Interview Survey, a Health Behavior Survey, a Health Examination Survey, and a Nutrition Survey. Using household registries, the KNHANES stratified and collected households as sampling units through a multistage, probability-based sampling design based on sex, age, and geographic area.10 To achieve an equal probability of being selected, statistical weights were assigned to each par- ticipant, which allows the results to represent the entire Kore- an population.10,11 When this survey was performed, written informed consent to use these data in further analyses was ob- tained. All participants had the right to refuse to take part in the study, in accordance with the National Health Enhancement Act.
Of the 177056 participants of the KNHANES I−VI, we exclud- ed those who were younger than 30 years (n=69205) and those who did not have full information regarding BP (n=51774). Af- ter these exclusions, 56077 participants (23974 men and 32103 women) were included in the final analysis. This study protocol conformed to the ethical guidelines of the 1975 Declaration of Helsinki. The Institutional Review Board of the Korea Centers for Disease Control and Prevention (KCDC) approved this study.
Measurement and definitions of blood pressure and hypertension
In KNHANES, BP was measured by 135 nurses from the Korea Association of Health Promotion and Public Health Centers in phases I to III, and was performed by four nurses in charge of BP measurement in the special investigation department of KCDC starting in phase IV. The BP used in this study was not
measured by automatic sphygmomanometer, but by a special investigator using a standard mercury sphygmomanometer (Baumanometer; Baum Co., Inc., Copiague, NY, USA) with the participants in a sitting position after he or she had rested for at least 10 minutes. In all participants, the BP was measured on two separate occasions at 5-minute intervals in a quiet atmo- sphere. The mean of these two measurements was adopted for the data analysis. The KCDC has been strengthening the quali- ty control of BP measurement since 2011, introducing a certi- fication system and continuously standardizing BP measure- ment and the survey environment.
The definition of hypertension was based on the Seventh Re- port of the Joint National Committee (JNC VII) criteria12 as fol- lows: systolic blood pressure (SBP) ≥140 mm Hg, diastolic blood pressure (DBP) ≥90 mm Hg, or use of anti-hypertensive medications. The range of BP was stratified into three catego- ries: 1) less-than-normotensive BP, SBP <120 mm Hg and DBP
<80 mm Hg; 2) less-than-hypertensive BP, SBP <140 mm Hg and DBP <90 mm Hg; and 3) hypertensive BP, SBP ≥140 mm Hg or DBP ≥90 mm Hg. It should be noted that a less-than-normo- tensive BP and a less-than-hypertensive BP were not mutually exclusive.
Measurement of other anthropometric and laboratory data
Well-trained medical staff members obtained the anthropo- metric measurements following standard procedures that were consistent across every phase of the KNHANES. Participants’
body weight and height were measured to the nearest 0.1 kg and 0.1 cm, respectively, while the participants wore light in- door clothing without shoes. The body mass index (BMI) was calculated as the ratio of weight in kilograms to height in squared meters (kg/m2).
Blood samples were collected from the antecubital vein in the morning after an overnight fast. Fasting plasma glucose, total cholesterol, triglyceride (TG), and high-density lipopro- tein-cholesterol (HDL-C) levels from all participants were measured enzymatically using a Hitachi 747 chemistry analyzer (Hitachi, Tokyo, Japan) in the 1998 and 2001 studies, using an ADVIA 1650/2400 (Siemens, New York, NY, USA) in the 2005 and 2008, using a Hitachi Automatic Analyzer 7600 (Hitachi, Tokyo, Japan) in the 2008 and 2012, and using a COBAS 8000 C702 (Roche Diagnostics System, Rotkreuz, Switzerland) in the 2013 and 2014 reports.
Health-related lifestyles
Information on health-related lifestyles was obtained from data gathered using the self-reported questionnaire during the interview portion of the survey. Physical activity was assessed using the Korean version of the International Physical Activity Questionnaire (IPAQ).13 In this study, we classified the level of physical activity as “sufficient activity.” An individual who met at least one of the following two criteria was considered a part
of the sufficient activity group, and would have originally been categorized in the “moderate activity” group according to the official IPAQ protocol:14 1) three or more days per week of vigor- ous activity for at least 20 minutes per day or, 2) five or more days per week of moderate-intensity activity or walking for at least 30 minutes per day.
Because the design of the questionnaire was different from other survey periods and because there were no questions to assess walking activity, we used modified criteria that excluded the comment of walking activity on the KNHANES I. Individu- als who consumed over more than seven glasses for males and five glasses for females of any alcoholic beverage at least twice per week were categorized into the heavy alcohol-drinking group. Individuals who smoked cigarettes during the relevant survey period were placed into the current smoking group. In- dividuals who taking diabetes mellitus or lipid-lowering med- ication were categorized into anti-diabetic or anti-dyslipid- emic medication groups. Anti-dyslipidemic medication has only been investigated since 2005.
Measurement of daily total calorie intake and sodium intake
Nutrient intake levels, including the daily calorie and sodium intakes, were assessed using 24-hour dietary recall methods administered by trained interviewers. The dietary question- naire was conducted during face-to-face interviews, and in- cluded the type, amount, and frequency of foods or drinks con- sumed during the previous day. Data on food items were con- verted to the form of units of nutrients using the Food Com- position Table developed by the National Institute of Agricul- tural Sciences (7th revision) and the database of the Korea Health Industry Development Institute for instant foods and imported foods.15,16
Data management and statistical analysis
To achieve an equal probability of being selected, statistical weights were assigned to each participant, allowing the results of the KNHANES to represent the entire Korean population.
Sampling weights were applied to account for the complex sam- pling method, which included stratification by district in the first step and stratification by sex and age during the second step. Furthermore, to avoid bias from changes in age and sex distributions in each phase, age and sex adjustments were ap- plied to the Korean population distribution in the year 2005.
All data on continuous variables are presented as means±st- andard errors; one-way analysis of variance was used to com- pare the mean values of the continuous variables of BMI, SBP, DBP, fasting glucose, total cholesterol, TG, HDL-C level, and sodium intake across the KNHANES phases. Linear regres- sion analyses were adopted to calculate the p for trend. Linear regression analyses for the p for trends and logistic regression analyses for the odds ratios (ORs) were also used. All analyses were conducted using SAS statistical software (version 9.2;
SAS Institute Inc., Cary, NC, USA). We used SAS SURVEYREG and SAS SURVEYLOGSTIC to account for the survey design and the complex sampling weights. The ORs for less-than- normotensive or less-than-hypertensive BP of variable factors were determined by multiple logistic regression analyses. All statistical tests were two-sided, and statistical significance was set at a p-value <0.05.
RESULTS
The 56077 participants included in this study were distributed as follows: 6452, 5035, 4812, 14935, 15738, and 9105 from the KNHANES I to VI, respectively.
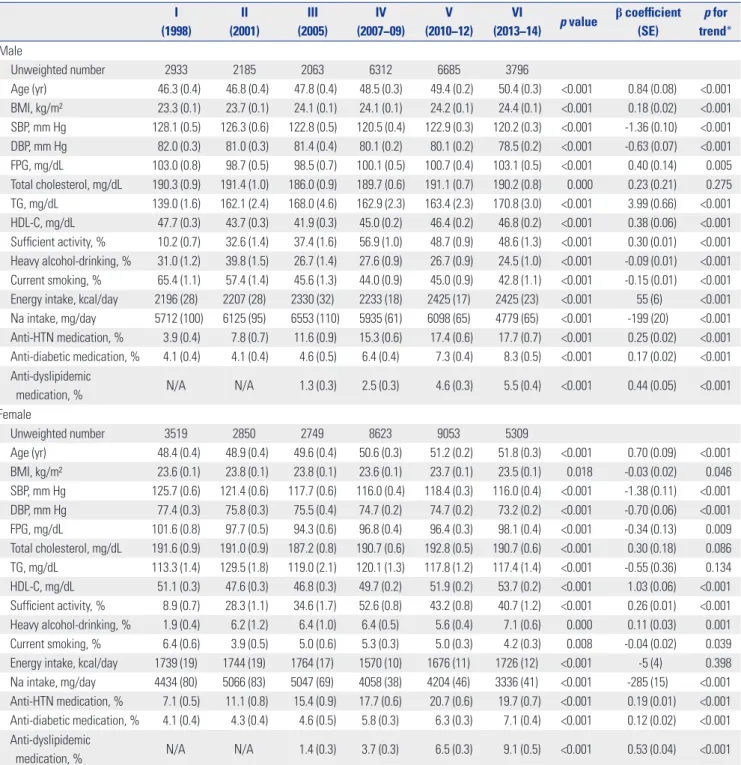
Table 1 shows the diachronic changes of participant charac- teristics according to KNHANES phase. In men, mean age and BMI increased over time in addition to fasting glucose, TG, and HDL-C levels. In contrast, in females, mean age and HDL-C increased whereas BMI and mean fasting glucose levels de- creased. However, in both sexes, the mean SBP and DBP val- ues showed a downward trend from the KNHANES I to VI (SBP in males: 128.1, 126.3, 122.8, 120.5, 122.9, and 120.2 mm Hg and DBP in males: 82.0, 81.0, 81.4, 80.1, 80.1, and 78.5 mm Hg; SBP in females: 125.7, 121.4, 117.7, 116.0, 118.4, and 116.0 mm Hg and DBP in females: 77.4, 75.8, 75.5, 74.7, 74.7, and 73.2 mm Hg from the KNHANES I to VI, respectively; all p-val- ues for trend <0.001). In both sexes, the average amount of daily sodium intake significantly decreased from the KNHANES I to VI (β-coefficient=-199, p for trend <0.001 for men; β-coef- ficient= -285, p for trend <0.001 for women).
Fig. 1 displays the age-standardized prevalences of hyper- tension and of anti-hypertensive medication use. In Fig. 1A, the male prevalence of hypertension changed decreased sig- nificantly (33.3, 32.4, 30.5, 31.2, 33.2, and 30.3%, β-coefficient=
-0.02, p for trend <0.001) and that in females tended to de- crease (28.7, 26.3, 25.0, 24.9, 26.7, and 22.7%, β-coefficient=
-0.04, p for trend <0.001) from the KNHANES I to VI. The per- centage of male participants with anti-hypertensive medica- tion significantly increased (β-coefficient=0.223, p for trend
<0.001) (Fig. 1B). The trend for the percentage of female par- ticipants with anti-hypertensive drugs was similar to the trend for male participants (β-coefficient=0.161, p for trend <0.001).
Fig. 2 displays the percentages of participants with less- than-normotensive BP (SBP <120 mm Hg and DBP <80 mm Hg) and less-than-hypertensive BP (SBP <140 mm Hg and DBP
<90 mm Hg) irrespective of anti-hypertensive medication ac- cording to KNHANES phase. The percentages of less-than- normotensive and less-than-hypertensive BP increased in both sexes: less-than-normotensive BP, 26.2, 30.3, 31.1, 36.8, 33.3, and 36.7% in men (β-coefficient=1.33, p for trend <0.001) and 42.7, 47.9, 52.1, 53.3, 49.3, and 53.6% in women (β-coef- ficient= 1.64, p for trend <0.001), as shown in Fig. 2A; less-than- hypertensive BP, 69.7, 70.8, 75.1, 77.2, 76.0, and 79.8% in men
(β-coefficient=1.94, p for trend <0.001) and 75.1, 79.1, 83.6, 85.1, 83.5, and 87.5% in women (β-coefficient=1.77, p for trend
<0.001), as shown in Fig. 2B.
We stratified all participants into two groups (participants taking anti-hypertensive medication and those who do not) to eliminate the effect of anti-hypertensive medication on trends in mean BP. Table 2 shows the diachronic trends of participant
characteristics in the population taking anti-hypertensive med- ication. In men, mean age, BMI, fasting glucose, TG, and HDL- C levels increased, while the mean values of SBP, DBP, and to- tal cholesterol level decreased. In addition, the percentage with sufficient activity also increased. In contrast, the average amount of daily sodium intake and the percentage of heavy alcohol drinkers and current smokers significantly decreased.
Table 1. Participant Characteristics according to KNHANES Phase I
(1998)
II (2001)
III (2005)
IV (2007−09)
V (2010−12)
VI
(2013−14) p value β coefficient (SE)
p for trend*
Male
Unweighted number 2933 2185 2063 6312 6685 3796
Age (yr) 46.3 (0.4) 46.8 (0.4) 47.8 (0.4) 48.5 (0.3) 49.4 (0.2) 50.4 (0.3) <0.001 0.84 (0.08) <0.001 BMI, kg/m² 23.3 (0.1) 23.7 (0.1) 24.1 (0.1) 24.1 (0.1) 24.2 (0.1) 24.4 (0.1) <0.001 0.18 (0.02) <0.001 SBP, mm Hg 128.1 (0.5) 126.3 (0.6) 122.8 (0.5) 120.5 (0.4) 122.9 (0.3) 120.2 (0.3) <0.001 -1.36 (0.10) <0.001 DBP, mm Hg 82.0 (0.3) 81.0 (0.3) 81.4 (0.4) 80.1 (0.2) 80.1 (0.2) 78.5 (0.2) <0.001 -0.63 (0.07) <0.001 FPG, mg/dL 103.0 (0.8) 98.7 (0.5) 98.5 (0.7) 100.1 (0.5) 100.7 (0.4) 103.1 (0.5) <0.001 0.40 (0.14) 0.005 Total cholesterol, mg/dL 190.3 (0.9) 191.4 (1.0) 186.0 (0.9) 189.7 (0.6) 191.1 (0.7) 190.2 (0.8) 0.000 0.23 (0.21) 0.275 TG, mg/dL 139.0 (1.6) 162.1 (2.4) 168.0 (4.6) 162.9 (2.3) 163.4 (2.3) 170.8 (3.0) <0.001 3.99 (0.66) <0.001 HDL-C, mg/dL 47.7 (0.3) 43.7 (0.3) 41.9 (0.3) 45.0 (0.2) 46.4 (0.2) 46.8 (0.2) <0.001 0.38 (0.06) <0.001 Sufficient activity, % 10.2 (0.7) 32.6 (1.4) 37.4 (1.6) 56.9 (1.0) 48.7 (0.9) 48.6 (1.3) <0.001 0.30 (0.01) <0.001 Heavy alcohol-drinking, % 31.0 (1.2) 39.8 (1.5) 26.7 (1.4) 27.6 (0.9) 26.7 (0.9) 24.5 (1.0) <0.001 -0.09 (0.01) <0.001 Current smoking, % 65.4 (1.1) 57.4 (1.4) 45.6 (1.3) 44.0 (0.9) 45.0 (0.9) 42.8 (1.1) <0.001 -0.15 (0.01) <0.001 Energy intake, kcal/day 2196 (28) 2207 (28) 2330 (32) 2233 (18) 2425 (17) 2425 (23) <0.001 55 (6) <0.001 Na intake, mg/day 5712 (100) 6125 (95) 6553 (110) 5935 (61) 6098 (65) 4779 (65) <0.001 -199 (20) <0.001 Anti-HTN medication, % 3.9 (0.4) 7.8 (0.7) 11.6 (0.9) 15.3 (0.6) 17.4 (0.6) 17.7 (0.7) <0.001 0.25 (0.02) <0.001 Anti-diabetic medication, % 4.1 (0.4) 4.1 (0.4) 4.6 (0.5) 6.4 (0.4) 7.3 (0.4) 8.3 (0.5) <0.001 0.17 (0.02) <0.001 Anti-dyslipidemic
medication, % N/A N/A 1.3 (0.3) 2.5 (0.3) 4.6 (0.3) 5.5 (0.4) <0.001 0.44 (0.05) <0.001 Female
Unweighted number 3519 2850 2749 8623 9053 5309
Age (yr) 48.4 (0.4) 48.9 (0.4) 49.6 (0.4) 50.6 (0.3) 51.2 (0.2) 51.8 (0.3) <0.001 0.70 (0.09) <0.001 BMI, kg/m² 23.6 (0.1) 23.8 (0.1) 23.8 (0.1) 23.6 (0.1) 23.7 (0.1) 23.5 (0.1) 0.018 -0.03 (0.02) 0.046 SBP, mm Hg 125.7 (0.6) 121.4 (0.6) 117.7 (0.6) 116.0 (0.4) 118.4 (0.3) 116.0 (0.4) <0.001 -1.38 (0.11) <0.001 DBP, mm Hg 77.4 (0.3) 75.8 (0.3) 75.5 (0.4) 74.7 (0.2) 74.7 (0.2) 73.2 (0.2) <0.001 -0.70 (0.06) <0.001 FPG, mg/dL 101.6 (0.8) 97.7 (0.5) 94.3 (0.6) 96.8 (0.4) 96.4 (0.3) 98.1 (0.4) <0.001 -0.34 (0.13) 0.009 Total cholesterol, mg/dL 191.6 (0.9) 191.0 (0.9) 187.2 (0.8) 190.7 (0.6) 192.8 (0.5) 190.7 (0.6) <0.001 0.30 (0.18) 0.086 TG, mg/dL 113.3 (1.4) 129.5 (1.8) 119.0 (2.1) 120.1 (1.3) 117.8 (1.2) 117.4 (1.4) <0.001 -0.55 (0.36) 0.134 HDL-C, mg/dL 51.1 (0.3) 47.6 (0.3) 46.8 (0.3) 49.7 (0.2) 51.9 (0.2) 53.7 (0.2) <0.001 1.03 (0.06) <0.001 Sufficient activity, % 8.9 (0.7) 28.3 (1.1) 34.6 (1.7) 52.6 (0.8) 43.2 (0.8) 40.7 (1.2) <0.001 0.26 (0.01) <0.001 Heavy alcohol-drinking, % 1.9 (0.4) 6.2 (1.2) 6.4 (1.0) 6.4 (0.5) 5.6 (0.4) 7.1 (0.6) 0.000 0.11 (0.03) 0.001 Current smoking, % 6.4 (0.6) 3.9 (0.5) 5.0 (0.6) 5.3 (0.3) 5.0 (0.3) 4.2 (0.3) 0.008 -0.04 (0.02) 0.039 Energy intake, kcal/day 1739 (19) 1744 (19) 1764 (17) 1570 (10) 1676 (11) 1726 (12) <0.001 -5 (4) 0.398 Na intake, mg/day 4434 (80) 5066 (83) 5047 (69) 4058 (38) 4204 (46) 3336 (41) <0.001 -285 (15) <0.001 Anti-HTN medication, % 7.1 (0.5) 11.1 (0.8) 15.4 (0.9) 17.7 (0.6) 20.7 (0.6) 19.7 (0.7) <0.001 0.19 (0.01) <0.001 Anti-diabetic medication, % 4.1 (0.4) 4.3 (0.4) 4.6 (0.5) 5.8 (0.3) 6.3 (0.3) 7.1 (0.4) <0.001 0.12 (0.02) <0.001 Anti-dyslipidemic
medication, % N/A N/A 1.4 (0.3) 3.7 (0.3) 6.5 (0.3) 9.1 (0.5) <0.001 0.53 (0.04) <0.001 KNHANES, Korean National Health and Nutrition Examination Survey; SE, standard error; BMI, body mass index; SBP, systolic blood pressure; DBP, diastolic blood pressure; FPG, fasting plasma glucose; TG, triglyceride; HDL-C, high-density lipoprotein cholesterol; Na, sodium; HTN, hypertension.
All data are presented as a mean (SE) or percentage.
*p for trend was determined by linear regression analysis with weighting of survey design.
In females, mean age increased, while mean BMI and fasting glucose did not reveal any significant trends. The mean values of SBP, DBP, total cholesterol, and TG levels were decreased;
however, the mean levels of HDL-C increased in females. The fraction with sufficient activity and heavy alcohol drinkers tended to increase, while the rate of current smokers decreased.
The average amount of daily sodium intake was also signifi- cantly reduced in females as well as in males.
Table 3 outlines diachronic trends of participant character- istics of individuals not taking anti-hypertensive medication.
In males, mean age, BMI, total cholesterol, TG, and HDL-C lev- els increased significantly according to KNHANES phase, while mean SBP and DBP decreased. The average amount of daily sodium intake showed a decrease during the study period. In females, mean age, total cholesterol, and HDL-C level increased according to KNHANES phase, while BMI, fasting glucose, and TG level significantly decreased. Like males, mean SBP and DBP had a tendency to decrease in females. In addition, the average daily sodium intake significantly decreased.
Fig. 3 displays the ORs for each BP category according to KNHANES phase: 1) less-than-normotensive BP and 2) less- than-hypertensive BP, after adjusting for age, BMI, fasting plas- ma glucose, total cholesterol, sufficient activity, heavy alcohol
drinking, smoking status, energy intake, and sodium intake.
Compared to the KNHANES I, the ORs (95% CIs) of the KNH- ANES II to VI for less-than-normotensive and less-than-hy- pertensive BP increased in both sexes.
Supplementary Table 1 (only online) shows the results of multivariate logistic regression analysis of factors associated with less-than-normotensive or less-than-hypertensive BP. In both sexes, less-than-normotensive or less-than-hypertensive BP were negatively associated with age, BMI, fasting glucose, total cholesterol, and heavy alcohol-drinking, except fasting glucose for women in less-than-hypertensive BP.
DISCUSSION
In this study, we found that the average BP levels in both sexes aged 30 years or older decreased regardless of current use of anti-hypertension medication over 16 years of the KNHANES study. Though the percentage of participants on anti-hyperten- sive medication increased, hypertension prevalence followed a marked downward trend in both sexes. From 1998 to 2014, the mean SBP and DBP in men decreased by 7.9 mm Hg and 3.5 mm Hg, while those in women decreased by 9.7 mm Hg and
A B
Fig. 2. Prevalence trends of less-than-normotensive BP or less-than-hypertensive BP according to KNHANES phase. (A) The prevalence of less- than-normotensive BP. (B) The prevalence of less-than-hypertensive BP. p for trend was determined by linear regression analysis with weighting of survey design. Less-than-normotensive BP, SBP <120 mm Hg and DBP <80 mm Hg; less-than-hypertensive BP, SBP <140 mm Hg and DBP <90 mm Hg.
KNHANES, Korean National Health and Nutrition Examination Survey; BP, blood pressure; SBP, systolic blood pressure; DBP, diastolic blood pressure.
60 50 40 30 20
90
80
70
60
−
−
−
−
−
−
−
−
−
(%) (%)
I II III IV V VI I II III IV V VI
KNHANES KNHANES
Men Women Men Women
75.1
79.1 83.6 85.1 83.5
β-coefficient 1.77 p for trend <0.001
β-coefficient 1.94 p for trend <0.001 69.7 70.8
75.1 77.2 76.0
79.8 87.5 42.7
47.9
52.1
53.3
49.3
β-coefficient 1.64 p for trend <0.001
β-coefficient 1.33 p for trend <0.001
26.2 30.3 31.1
36.8 33.3 36.7
53.6
A B
Fig. 1. Trends in the age-standardized prevalence of hypertension and the participants with anti-hypertensive medication. (A) The age-standardized prevalence of hypertension. (B) The age-standardized prevalence of the participants with anti-hypertensive medication. Standardized to the age structure of the 2005 Korean population. p for trend was determined by logistic regression after setting the KNHANES phase as the continuous vari- able. KNHANES, Korean National Health and Nutrition Examination Survey.
40 35 30 25 20
20 15 10 5 0
−
−
−
−
−
−
−
−
−
−
(%) (%)
I II III IV V VI I II III IV V VI
KNHANES KNHANES
Men Women Men Women
33.3 32.4
30.5 31.2 33.2
β-coefficient -0.02 p for trend <0.001
β-coefficient -0.04 p for trend <0.001 28.7
26.3 25.0 24.9 26.7
22.7 30.3
7.5
11.5
15.1 16.6
18.4
β-coefficient 0.223 p for trend <0.001
β-coefficient 0.161 p for trend <0.001 4.2
8.1
11.4
14.2 15.2 14.6
16.7
4.2 mm Hg, respectively. This lower pattern of BP was identi- cal after stratification according to use of anti-hypertensive medication in both sexes. Also, less-than-normotensive and less-than-hypertensive BP in both sexes showed increasing trends according to KNHANES phase, regardless of various covariates.
Hypertension is one of the chronic non-communicable dis- eases that are intricately interrelated with individual, socio- economic, and environmental factors, in addition to genetic
factors. Danaei, et al.17 investigated global trends in SBP with 786 country-years and 5.4 million participants. They reported that there were significant variations across regions and coun- tries: SBP was currently highest in low- and middle-income countries and lowest in high-income countries. At the individ- ual level, excessive fat and carbohydrate intake, obesity, emo- tional stress, and its biological reactants are well-known risk factors of hypertension.18-20 On the other hand, a higher quali- ty of public healthcare and growing interest in the self-man- Table 2. Characteristics of the Participants Taking Anti-Hypertensive Medication according to KNHANES Phase
I (1998)
II (2001)
III (2005)
IV (2007−09)
V (2010−12)
VI
(2013−14) p value β coefficient (SE)
p for trend*
Male
Unweighted number 119 193 291 1195 1540 874
Age (yr) 55.8 (1.4) 58.6 (0.8) 59.0 (0.8) 59.4 (0.5) 60.9 (0.4) 61.6 (0.5) <0.001 1.00 (0.08) <0.001 BMI, kg/m² 24.8 (0.3) 24.7 (0.3) 24.7 (0.2) 24.9 (0.1) 24.8 (0.1) 25.1 (0.1) <0.001 0.08 (0.02) 0.001 SBP, mm Hg 146.2 (2.4) 145.7 (1.6) 136.4 (1.4) 130.9 (0.8) 129.8 (0.5) 126.9 (0.6) <0.001 -3.55 (0.15) <0.001 DBP, mm Hg 90.8 (1.4) 88.3 (1.1) 85.9 (0.9) 82.9 (0.6) 79.8 (0.4) 77.2 (0.5) <0.001 -2.82 (0.09) <0.001 FPG, mg/dL 104.0 (2.6) 107.5 (1.9) 107.3 (1.7) 109.1 (1.1) 109.7 (0.9) 110.8 (1.1) 0.001 1.04 (0.17) <0.001 Total cholesterol, mg/dL 196.1 (3.5) 199.9 (2.5) 183.1 (2.4) 183.3 (1.3) 183.3 (1.2) 180.0 (1.6) <0.001 -2.71 (0.24) <0.001 TG, mg/dL 142.3 (5.5) 195.6 (8.7) 178.5 (9.9) 171.8 (6.3) 177.1 (4.7) 177.3 (7.1) <0.001 1.24 (0.56) 0.027 HDL-C, mg/dL 48.2 (1.7) 41.6 (0.8) 40.7 (0.7) 43.4 (0.4) 44.8 (0.4) 45.5 (0.5) <0.001 0.75 (0.11) <0.001 Sufficient activity, % 16.4 (4.2) 37.2 (4.6) 35.7 (3.8) 62.4 (2.0) 47.9 (1.7) 49.6 (3.0) <0.001 0.11 (0.04) 0.004 Heavy alcohol-drinking, % 43.2 (6.7) 38.7 (5.5) 26.7 (4.0) 25.2 (2.1) 23.3 (1.9) 25.6 (2.4) 0.031 -0.11 (0.05) 0.030 Current smoking, % 54.7 (5.0) 41.4 (3.7) 34.9 (3.3) 29.6 (1.8) 31.9 (1.6) 30.2 (2.2) 0.001 -0.11 (0.04) 0.003 Energy intake, kcal/day 2057 (89) 2092 (78) 2111 (61) 2039 (40) 2169 (31) 2183 (39) <0.001 38 (15) <0.001 Na intake, mg/day 5468 (408) 5981 (259) 5871 (216) 5544 (150) 5444 (119) 4392 (148) <0.001 -350 (28) <0.001 Anti-diabetic medication, % 13.3 (3.5) 14.7 (2.5) 18.0 (2.5) 20.4 (1.6) 21.2 (1.3) 23.5 (1.7) 0.083 0.12 (0.04) 0.003 Anti-dyslipidemic
medication, % N/A N/A 7.7 (2.2) 12.3 (1.4) 18.7 (1.3) 20.2 (1.8) <0.001 0.33 (0.07) <0.001 Female
Unweighted number 264 318 444 1813 2218 1251
Age (yr) 61.5 (0.8) 63.6 (0.7) 63.4 (0.7) 64.3 (0.4) 65.6 (0.3) 65.6 (0.4) <0.001 0.76 (0.14) <0.001 BMI, kg/m² 25.3 (0.2) 25.7 (0.2) 25.0 (0.2) 25.5 (0.1) 25.2 (0.1) 25.3 (0.1) 0.092 -0.03 (0.04) 0.548 SBP, mm Hg 154.4 (1.9) 144.0 (1.3) 135.7 (1.3) 131.9 (0.6) 133.3 (0.5) 129.7 (0.7) <0.001 -3.22 (0.27) <0.001 DBP, mm Hg 87.3 (0.8) 84.4 (0.9) 81.1 (0.7) 79.9 (0.4) 77.5 (0.3) 75.1 (0.4) <0.001 -2.29 (0.15) <0.001 FPG, mg/dL 113.2 (3.3) 106.4 (1.5) 105.6 (1.6) 108.4 (1.0) 105.0 (0.8) 108.4 (1.1) 0.012 -0.39 (0.40) 0.331 Total cholesterol, mg/dL 214.1 (2.8) 209.2 (2.2) 201.8 (1.9) 200.0 (1.5) 194.2 (1.0) 191.0 (1.4) <0.001 -4.49 (0.46) <0.001 TG, mg/dL 144.4 (3.7) 172.6 (6.1) 160.4 (7.8) 159.0 (3.5) 146.2 (2.5) 146.3 (3.3) <0.001 -4.22 (1.17) 0.000 HDL-C, mg/dL 47.7 (0.7) 44.1 (0.7) 43.5 (0.5) 46.3 (0.5) 47.9 (0.3) 49.9 (0.4) <0.001 1.22 (0.14) <0.001 Sufficient activity, % 8.3 (1.9) 21.9 (2.8) 27.2 (3.2) 52.5 (1.6) 39.3 (1.4) 36.0 (2.4) <0.001 0.15 (0.03) <0.001 Heavy alcohol-drinking, % 1.1 (1.1) 0.0 (0.0) 2.9 (1.2) 5.0 (1.0) 2.9 (0.8) 4.5 (1.1) <0.001 0.08 (0.11) 0.045 Current smoking, % 7.2 (1.8) 6.5 (1.6) 5.7 (1.2) 5.0 (0.9) 3.4 (0.5) 2.6 (0.5) 0.003 -0.23 (0.05) <0.001 Energy intake, kcal/day 1555 (48) 1515 (44) 1639 (38) 1409 (44) 1543 (18) 1548 (20) <0.001 8.90 (7.95) 0.263 Na intake, mg/day 3864 (209) 4702 (206) 4823 (167) 3497 (73) 3664 (70) 2817 (69) <0.001 -368 (32) <0.001 Anti-diabetic medication, % 14.0 (2.7) 13.6 (2.2) 17.1 (2.3) 18.9 (1.3) 19.3 (1.1) 22.0 (1.4) 0.043 0.11 (0.03) 0.001 Anti-dyslipidemic
medication, % N/A N/A 5.5 (1.4) 14.6 (1.1) 21.0 (1.2) 28.4 (1.7) <0.001 0.49 (0.05) <0.001 KNHANES, Korean National Health and Nutrition Examination Survey; SE, standard error; BMI, body mass index; SBP, systolic blood pressure; DBP, diastolic blood pressure; FPG, fasting plasma glucose; TG, triglyceride; HDL-C, high-density lipoprotein cholesterol; Na, sodium.
All data are presented as a mean (SE) or percentage.
*p for trend was determined by linear regression analysis with weighting of survey design.
agement of personal health, such as a low-salt diet, regular physical activity, and smoking cessation, are known as pre- ventive factors of hypertension.21
Downward trends in SBP and DBP were present and hyper- tension prevalence significantly decreased in both sexes be- tween 1998 and 2014. The proportion of the adult population taking anti-hypertensives significantly increased during the same period. The proper use of anti-hypertensive drugs may contribute to decreasing the mean BP.
This study revealed positive changes in individual lifestyle factors and anti-hypertensive medication. According to a pre- vious study22 on trends of sodium intake in Korea, mean sodi- um intake did not change significantly between 1998 and 2009 (4.6 vs. 4.7 g per day). In contrast, Tables 1, 2, and 3 in our study using more recent data showed that daily sodium intake significantly decreased in both sexes between 1998 and 2014 (All p for trend <0.001). A low-sodium diet could lower BP not only in hypertensive, but also in normotensive individuals.23 Table 3. Characteristics of the Participants Not Taking Anti-Hypertensive Medication According to KNHANES Phase
I (1998)
II (2001)
III (2005)
IV (2007−09)
V (2010−12)
VI
(2013−14) p value β coefficient (SE)
p for trend*
Male
Unweighted number 2814 1992 1772 5117 5145 2922
Age (yr) 45.9 (0.4) 45.8 (0.4) 46.4 (0.4) 46.6 (0.3) 47.0 (0.3) 48.0 (0.3) <0.001 0.42 (0.08) <0.001 BMI, kg/m² 23.3 (0.1) 23.6 (0.1) 24.0 (0.1) 24.0 (0.1) 24.0 (0.1) 24.3 (0.1) <0.001 0.16 (0.02) <0.001 SBP, mm Hg 127.4 (0.5) 124.6 (0.5) 121.1 (0.5) 118.6 (0.4) 120.3 (0.3) 118.7 (0.4) <0.001 -1.47 (0.10) <0.001 DBP, mm Hg 81.7 (0.3) 80.4 (0.3) 80.8 (0.4) 79.6 (0.2) 80.2 (0.2) 78.7 (0.3) <0.001 -0.44 (0.07) <0.001 FPG, mg/dL 103.0 (0.8) 97.9 (0.5) 97.3 (0.8) 98.5 (0.5) 98.8 (0.4) 101.6 (0.5) <0.001 0.05 (0.15) 0.758 Total cholesterol, mg/dL 190.0 (1.0) 190.8 (1.1) 186.4 (1.0) 190.8 (0.7) 192.7 (0.7) 192.3 (0.8) <0.001 0.75 (0.22) 0.001 TG, mg/dL 138.9 (1.6) 159.3 (2.5) 166.6 (5.0) 161.3 (2.4) 160.6 (2.4) 169.5 (3.3) <0.001 3.88 (0.69) <0.001 HDL-C, mg/dL 47.7 (0.3) 43.9 (0.3) 42.1 (0.3) 45.3 (0.2) 46.7 (0.2) 47.1 (0.2) <0.001 0.40 (0.07) <0.001 Sufficient activity, % 10.0 (0.7) 32.2 (1.4) 37.6 (1.7) 55.9 (1.0) 48.8 (0.9) 48.4 (1.4) <0.001 0.31 (0.01) <0.001 Heavy alcohol-drinking, % 30.6 (1.2) 39.9 (1.6) 26.7 (1.5) 28.0 (1.0) 27.4 (1.0) 24.3 (1.1) <0.001 -0.08 (0.01) <0.001 Current smoking, % 65.8 (1.1) 58.7 (1.5) 47.0 (1.4) 46.6 (1.0) 47.7 (1.0) 45.4 (1.3) <0.001 -0.14 (0.01) <0.001 Energy intake, kcal/day 2312 (28) 2217 (28) 2359 (34) 2268 (20) 2479 (20) 2477 (26) <0.001 64 (6) <0.001 Na intake, mg/day 5722 (102) 6137 (100) 6643 (116) 6005 (65) 6235 (74) 4861 (70) <0.001 -168 (21) <0.001 Anti-diabetic medication, % 3.7 (0.4) 3.2 (0.4) 2.9 (0.4) 3.9 (0.4) 4.4 (0.3) 5.1 (0.5) 0.009 0.10 (0.03) 0.001 Anti-dyslipidemic
medication, % N/A N/A 0.5 (0.2) 0.8 (0.1) 1.6 (0.2) 2.4 (0.3) <0.001 0.55 (0.09) <0.001 Female
Unweighted number 3255 2532 2305 6810 6835 4058
Age (yr) 47.4 (0.4) 47.1 (0.4) 47.1 (0.4) 47.6 (0.3) 47.5 (0.2) 48.4 (0.3) 0.061 0.19 (0.08) 0.018 BMI, kg/m² 23.5 (0.1) 23.5 (0.1) 23.5 (0.1) 23.2 (0.1) 23.3 (0.1) 23.0 (0.1) <0.001 -0.10 (0.02) <0.001 SBP, mm Hg 123.5 (0.6) 118.6 (0.5) 114.4 (0.6) 112.6 (0.3) 114.5 (0.3) 112.6 (0.3) <0.001 -1.68 (0.11) <0.001 DBP, mm Hg 76.6 (0.3) 74.8 (0.3) 74.5 (0.4) 73.6 (0.2) 74.0 (0.2) 72.7 (0.2) <0.001 -0.61 (0.06) <0.001 FPG, mg/dL 100.7 (0.8) 96.6 (0.5) 92.3 (0.6) 94.4 (0.3) 94.3 (0.3) 95.8 (0.4) <0.001 -0.66 (0.13) <0.001 Total cholesterol, mg/dL 189.8 (0.9) 188.8 (0.9) 184.6 (0.9) 188.7 (0.7) 192.5 (0.6) 190.7 (0.7) <0.001 0.78 (0.18) <0.001 TG, mg/dL 110.9 (1.4) 124.1 (1.8) 111.5 (1.9) 111.9 (1.2) 110.9 (1.3) 111.0 (1.5) <0.001 -1.07 (0.37) 0.003 HDL-C, mg/dL 51.3 (0.3) 48.1 (0.3) 47.4 (0.3) 50.5 (0.2) 52.8 (0.2) 54.5 (0.2) <0.001 1.12 (0.06) <0.001 Sufficient activity, % 9.0 (0.7) 29.1 (1.1) 35.9 (1.7) 52.7 (0.8) 44.2 (0.9) 41.9 (1.4) <0.001 0.28 (0.01) <0.001 Heavy alcohol-drinking, % 1.9 (0.4) 6.5 (1.3) 6.8 (1.1) 6.6 (0.5) 6.0 (0.5) 7.5 (0.7) 0.000 0.12 (0.03) 0.000 Current smoking, % 6.4 (0.6) 3.5 (0.5) 4.9 (0.7) 5.4 (0.4) 5.5 (0.4) 4.6 (0.4) 0.021 -0.01 (0.02) 0.537 Energy intake, kcal/day 1752 (20) 1772 (20) 1786 (20) 1604 (11) 1711 (12) 1769 (14) <0.001 -2 (4) 0.694 Na intake, mg/day 4474 (84) 5111 (87) 5088 (77) 4179 (43) 4345 (52) 3463 (45) <0.001 -256 (16) <0.001 Anti-diabetic medication, % 3.4 (0.4) 3.1 (0.4) 2.4 (0.4) 3.0 (0.3) 2.9 (0.2) 3.5 (0.3) 0.334 0.01 (0.03) 0.674 Anti-dyslipidemic
medication, % N/A N/A 0.6 (0.2) 1.3 (0.2) 2.7 (0.2) 4.4 (0.3) <0.001 0.62 (0.06) <0.001 KNHANES, Korean National Health and Nutrition Examination Survey; SE, standard error; BMI, body mass index; SBP, systolic blood pressure; DBP, diastolic blood pressure; FPG, fasting plasma glucose; TG, triglyceride; HDL-C, high-density lipoprotein cholesterol; Na, sodium.
All data are presented as a mean (SE) or percentage.
*p for trend was determined by linear regression analysis with weighting of survey design.
Because the average amount of daily sodium intake by Koreans has reached more than two times the amount recommended by the World Health Organization,24 decreasing sodium con- sumption in Korean is more important. We noted a pattern of high sodium intake; however, these decreasing trends would have affected decreasing BP trends, despite the non-significant relationship shown in Supplementary Table 1 (only online) of this cross-sectional study. Alcohol-drinking and cigarette-smok- ing habits in this study were improved in the all male subgroup of participants. The Korean government has made many ef- forts to reduce alcohol- and cigarette-related conditions by en- acting the “National Health Promotion Act” and the “Health Plan 2020.”25 A recent report from the KCDC stated that the numbers of male high-risk drinkers and current smokers have been decreasing annually since 2008.26 However, in the female population, heavy alcohol drinking seemed to increase gradu- ally, and the trend of current smoking rates among partici- pants without anti-hypertensive medication was not signifi- cantly changed. A possible explanation for this discrepancy might be that, unlike males, the numbers of female drinkers and smokers remain small in Korea.27 In addition, the increas- ing trends of female heavy drinkers and current smokers seem to be caused by underestimation in the KNHANES I and II.
This study included relatively younger participants who com- prise more current smokers and heavy alcohol drinkers, com- pared to older women. However, young women tend to natu- rally maintain their BP within the normal range despite un- healthier lifestyles. For these reasons, the increasing patterns in smoking and drinking in women would not significantly af- fect BP trends, unlike in men. Our results also revealed long- term upward trends in the amount of physical activity in both sexes. This increase in sufficient physical activity might have positively influenced the mean BP. The above-mentioned he- althy lifestyle changes might have affected decreasing BP trends in Korean adults.
Some potential limitations should be considered when inter- preting these findings. First, our study was a cross-sectional
analysis; therefore, the diachronic causal relationships between the trends in this study cannot be guaranteed. Second, many participants (n=50730) were excluded due to missing BP mea- surement or anthropometric data. As a result, we could not fully exclude the possibility of selection bias. Third, in this study, there may be some errors in BP measurements. The BP values used in this study were not measured by an automatic sphyg- momanometer, but by a special investigator using a mercury sphygmomanometer. The KCDC has been strengthening the quality control of BP measurement since 2011, introducing a certification system and continuously standardizing BP mea- surement and the survey environment. The KCDC plans to re- place the standard mercury sphygmomanometer used at the actual health check-up site with an automatic sphygmoma- nometer in 2020, according to the Minamata Convention on Mercury of United Nations Environment Program. Neverthe- less, changes in the screening environment and the BP mea- surement values may differ depending on the investigators. In addition, the BP readings were obtained on a single visit, so any variability in BP was not documented. BP measurements performed at a single visit usually overestimate the hyperten- sion prevalence and underestimate the control rate,6 so some individuals may have been incorrectly assigned to a hyperten- sion status. Fourth, we could not completely control all of the various factors that affect BP. We could analyze only the vari- ables investigated in KNHANES. In addition, sodium intake was estimated based on the 24-hour dietary recall method.
Although well-trained medical staff carefully checked the life- style data, such as sodium intake, there might be some errors.
Despite the effort to minimize mistakes or errors, measure- ment errors could affect these findings. Fifth, estimative errors may have occurred due to the nature of the self-reported in- formation in the KNHANES, especially information on the use of anti-hypertensive medication. For the same reasons, the use of a 24-hour recall method to assess dietary energy and sodium intake might not represent actual circumstances. To achieve an appropriate assessment of participants’ habitual
A B
Fig. 3. ORs for less-than-normotensive or less-than-hypertensive BP according to KNHANES phase. (A) ORs trends for less-than-normotensive and less-than-hypertensive BP in men. (B) ORs trends for less-than-normotensive and less-than-hypertensive BP in women. Less-than-normotensive BP, SBP <120 mm Hg and DBP <80 mm Hg; less-than-hypertensive BP, SBP <140 mm Hg and DBP <90 mm Hg. Adjusting for age, body mass index, fasting plasma glucose, total cholesterol, sufficient activity, heavy alcohol drinking, smoking status, energy intake, and sodium intake. ORs, odds ratios;
KNHANES, Korean National Health and Nutrition Examination Survey; BP, blood pressure; SBP, systolic blood pressure; DBP, diastolic blood pressure.
3.0 2.5 2.0 1.5 1.0 0.5
3.5 3.0 2.5 2.0 1.5 1.0 0.5
−
−
− –
−
−
−
− –
− –
−
−
(%) (%)
I II III IV V VI I II III IV V VI I II III IV V VI I II III IV V VI
Men Women
KNHANES KNHANES KNHANES KNHANES
ORs for less-than
normotensive BP ORs for less-than
normotensive BP ORs for less-than
hypertensive BP ORs for less-than
hypertensive BP
1.00 1.24 1.00 1.16 1.00 1.30 1.00 1.08
1.60 2.05 2.01
1.59 2.23
2.02 2.24
1.98 1.76
1.93 1.89
1.68
2.42 2.53 2.80
2.03
diets, Holmes, et al.28 recommended at least four repeat mea- surements of a 24-hour recall method. However, this method- ology was originally designed to estimate group mean dietary intakes, not for surveying individual habitual diets; therefore, it may likely be adequate for estimating long-term trends in diet and nutrition among large survey groups. Sixth, the pa- rameters of lifestyle-related factors, which include drinking, smoking, and physical activity, were not measured over the same relevant phase. For example, the KNHANES I and II as- sessed the habitual alcohol intake using the number of bottles for the amount and the monthly counts for the frequency, which was an entirely different system than the conventional scales presented as the number of glasses by week in the latter survey periods. Therefore, we adjusted the old data to match the current scales. Finally, because of the limitations of data from KNHANES, we were unable to conduct detailed sub- analysis of anti-hypertensive medications or anti-dyslipid- emic medications, such as statins, which likely contribute to BP trends.
Despite these limitations, the present study had several st- rengths. This is the first study to describe long-term trends in BP level and prevalence of hypertension among general Kore- an adults. In contrast with previous studies, we investigated the cross-sectional data of six consecutive nationwide qualified surveys conducted every three or four years during a 16-year period using a similar methodology. The general trends use representative data with time sequence-weighting and age standardization, which contribute to a greater understanding of the epidemiological situation and establishing effective in- terventions and public health policies on BP and hyperten- sion in Korea. Our research revealed an ameliorative trend in nationwide health status in Korea for recent years, which has become more similar with other developed countries, driven by improved health habits. This implies that the modified di- rection of public health policy of Korea toward more weight- ing individualized and personalized education and encour- agements for lifestyle changes, rather than just enhancing medical accessibility.
In summary, the average BP in both sexes and the prevalence of hypertension showed marked downward trends during the 16-year period. Also, less-than-normotensive and less-than- hypertensive BP in both sexes had increasing trends accord- ing to KNHANES phase. Constant declines in the mean BP re- gardless of anti-hypertensive medication along with improve- ments in several lifestyle factors in both sexes were also noted.
A national preventive approach based on lifestyle modifica- tions may also be needed to reduce hypertension in Koreans.
ORCID
Tae-Jong Kim https://orcid.org/0000-0002-5458-4684 Jae-woo Lee https://orcid.org/0000-0003-1784-6494 Hee-Taik Kang https://orcid.org/0000-0001-8048-6247
REFERENCES
1. James PA, Oparil S, Carter BL, Cushman WC, Dennison-Himmel- farb C, Handler J, et al. 2014 evidence-based guideline for the management of high blood pressure in adults: report from the panel members appointed to the Eighth Joint National Committee (JNC 8). JAMA 2014;311:507-20.
2. Writing Group Members, Mozaffarian D, Benjamin EJ, Go AS, Ar- nett DK, Blaha MJ, Cushman M, et al. Executive summary: heart disease and stroke statistics--2016 update: a report from the Ameri- can Heart Association. Circulation 2016;133:447-54.
3. Korea Centers for Disease Control and Prevention. Korea Health Statistics 2014: Korea National Health and Nutrition Examination Survey (KNHANES VI-2). Ministry of Health and Welfare, 2015.
4. Kearney PM, Whelton M, Reynolds K, Muntner P, Whelton PK, He J. Global burden of hypertension: analysis of worldwide data. Lan- cet 2005;365:217-23.
5. Kim HC, Nam CM, Jee SH, Suh I. Comparison of blood pressure- associated risk of intracerebral hemorrhage and subarachnoid hemorrhage: Korea Medical Insurance Corporation study. Hy- pertension 2005;46:393-7
6. Egan BM, Zhao Y, Axon RN. US trends in prevalence, awareness, treatment, and control of hypertension, 1988-2008. JAMA 2010;
303:2043-50.
7. Centers for Disease Control and Prevention (CDC). Racial/ethnic disparities in prevalence, treatment, and control of hypertension- -United States, 1999-2002. MMWR Morb Mortal Wkly Rep 2005;
54:7-9.
8. Lee JH, Yang DH, Park HS, Cho Y, Jun JE, Park WH, et al.; HYper- tension-Diabetes Daegu Initiative Study Investigators. Incidence of hypertension in Korea: 5-year follow-up study. J Korean Med Sci 2011;26:1286-92.
9. Lee HS, Lee SS, Hwang IY, Park YJ, Yoon SH, Han K, et al. Preva- lence, awareness, treatment and control of hypertension in adults with diagnosed diabetes: the Fourth Korea National Health and Nutrition Examination Survey (KNHANES IV). J Hum Hypertens 2013;27:381-7.
10. Kim Y. The Korea National Health and Nutrition Examination Sur- vey (KNHANES): current status and challenges. Epidemiol Health 2014;36:e2014002.
11. Lee WJ, Kim HC, Oh SM, Choi DP, Cho J, Suh I. Factors associated with a low-sodium diet: the fourth Korean National Health and Nutrition Examination Survey. Epidemiol Health 2013;35:
e2013005.
12. Chobanian AV, Bakris GL, Black HR, Cushman WC, Green LA, Izzo JL Jr, et al.; National Heart, Lung, and Blood Institute Joint Nation- al Committee on Prevention, Detection, Evaluation, and Treat- ment of High Blood Pressure; National High Blood Pressure Edu- cation Program Coordinating Committee. The seventh report of the Joint National Committee on Prevention, Detection, Evalua- tion, and Treatment of High Blood Pressure: the JNC 7 report.
JAMA 2003;289:2560-72.
13. Craig CL, Marshall AL, Sjöström M, Bauman AE, Booth ML, Ain- sworth BE, et al. International physical activity questionnaire:
12-country reliability and validity. Med Sci Sports Exerc 2003;35:
1381-95.
14. International Physical Activity Questionnaire Research Committee.
Guidelines for data processing and analysis of the International Physical Activity Questionnaire (IPAQ) [accessed on 2017 March 26]. Available at: http://www.ipaq.ki.se.
15. National Institute of Agricultural Sciences. Korean Food Compo- sition Table. 7th rev. Rural Development Administration; 2006.
p.277-380.
16. Korea Centers for Disease Control & Prevention. Development of recipe database for Korea health and nutrition examination. Korea Ministry of Health and Welfare; 1998.
17. Danaei G, Finucane MM, Lin JK, Singh GM, Paciorek CJ, Cowan MJ, et al.; Global Burden of Metabolic Risk Factors of Chronic Dis- eases Collaborating Group (Blood Pressure). National, regional, and global trends in systolic blood pressure since 1980: systematic analysis of health examination surveys and epidemiological stud- ies with 786 country-years and 5·4 million participants. Lancet 2011;377:568-77.
18. Sacks FM, Katan M. Randomized clinical trials on the effects of di- etary fat and carbohydrate on plasma lipoproteins and cardiovas- cular disease. Am J Med 2002;113 Suppl 9B:13S-24S.
19. Hall JE. Pathophysiology of obesity hypertension. Curr Hypertens Rep 2000;2:139-47.
20. Matthews KA, Woodall KL, Stoney CM. Changes in and stability of cardiovascular responses to behavioral stress: results from a four- year longitudinal study of children. Child Dev 1990;61:1134-44.
21. Whelton PK, He J, Appel LJ, Cutler JA, Havas S, Kotchen TA, et al.;
National High Blood Pressure Education Program Coordinating Committee. Primary prevention of hypertension: clinical and pub-
lic health advisory from The National High Blood Pressure Educa- tion Program. JAMA 2002;288:1882-8.
22. Lee HS, Duffey KJ, Popkin BM. Sodium and potassium intake pat- terns and trends in South Korea. J Hum Hypertens 2013;27:298- 303.
23. He FJ, MacGregor GA. Effect of modest salt reduction on blood pressure: a meta-analysis of randomized trials. Implications for public health. J Hum Hypertens 2002;16:761-70.
24. World Health Organization. Diet, nutrition, and the prevention of chronic diseases: report of a joint WHO/FAO expert consultation.
Geneva: World Health Organization; 2003.
25. Korea Ministry of Health and Welfare. The 3rd national health plan (2011-2020). Korea Ministry of Health and Welfare; 2011 26. Korea Centers for Disease Control and Prevention. Korea health
statistics 2015: Korea national health and nutrition examination survey (KNHANES VI). Ministry of Health and Welfare; 2016.
27. Kim W, Kim S. Women’s alcohol use and alcoholism in Korea.
Subst Use Misuse 2008;43:1078-87.
28. Holmes B, Dick K, Nelson M. A comparison of four dietary as- sessment methods in materially deprived households in England.
Public Health Nutr 2008;11:444-56.