Evaluation of the health status of preschool children stratified based on the weight-length index (WLI)
Kyung-Ok Shin
1, Keun-Hee Chung
1and Hyun-Suh Park
2§1
Department of Food & Nutrition, Sahmyook University, Seoul 130-650, Korea
2
Department of Food & Nutrition, Kyunghee University, Hoegi-dong, Dongdaemun-gu, Seoul 130-701, Korea
Abstract
This study was conducted to prepare basic materials and offer advice regarding dietary habits to prevent and cure childhood obesity by comparing and analyzing dietary habit, nutritional status, blood factors, and mineral contents of hair. All subjects were stratified by their weight-length index (WLI). According to the standard WLI values, 64.9% of children were within the normal value, 13.5% of children were underweight, and 21.6%
of children were overweight and obese (WLI ≥ 110%). Overall, the score assessed dietary habit for all children was 21.32 ± 2.55 point (921 subjects), with 5.1% of children having excellent dietary habits and 3.1% having poor dietary habits. Additionally, 37.9% of underweight children, 37.6%
of normal weight children, and 43.2% of overweight and obese children consumed higher amounts of protein than underweight children did (meat, fish, eggs, and soy products) (P < 0.05). Overweight and obese children consumed more fried foods than underweight or normal weight children (P < 0.05). Moreover, 38.0% of the children had hemoglobin levels of 12 g/dl, while 7.6% were anemic (11.1 g/dl). When a hematocrit level of 33% was taken as the standard, 11.0% of children were anemic. The plasma transferrin content was 263.76 ± 54.52 mg/dl in overweight and obese children. The mean values of Fe, Cu, Ca, Cr, Mn, Se, Na, K, Li, V, Co, and Mo were within the reference values, but the Zn concentrations of underweight, normal weight, and overweight and obese children were 67.97 ± 28.51 ppm, 70.09 ± 30.81 ppm, and 73.99 ± 30.36 ppm, respectively.
The Zn concentration of overweight and obese children (73.99 ± 30.36 ppm) was lower than that of the standard value (180~220 ppm). Therefore, a nutritional education program and new guidance for dietary pattern should be developed to reduce the number of underweight and overweight and obese children.
Key Words: WLI, nutrient intakes, blood parameters, hair mineral
Introduction
6)Childhood, a fundamental period for physical development, is a stage in which intelligence and physical power are developing rapidly and active metabolism occurs [1]. Brich [2] reported that preferences for food during childhood affect food preferences and dietary habits during adulthood. Additionally, nutrient intake is critical for health and physical development; therefore, parents should be concerned with the dietary habits of their children [3].
Bad eating habits such as overeating, unbalanced diet, and frequent eating out can result in the intake of excessive amounts of salt and carbohydrates, which leads to childhood obesity, tooth decay, and iron-related anemia [4]. The induction of obesity in preschool children leads to adult obesity, which results in overweight, hypertension, diabetes, and hyperlipidemia [5-8].
Obese preschool children often suffer from growth disorders, mental disorders, and emotional disorders; all of which lead to other adverse effects such as the development of undesirable personality traits [9]. In previous studies [10-12], the energy
intake of obese children was found to be higher than the average requirements, and the amounts of body lipids, triacylglycerol, serum LDL-cholesterol, and cholesterol have been found increased as the level of obesity increased, while the HDL- cholesterol levels were decreased with increasing levels of obesity. Robertson et al. [13] reported that a reduction in fat intake between the ages of three and seven led to the effective prevention of obesity.
In advanced countries, including the United States, obesity appears to be a large social problem and has already been thoroughly studied. Conversely, in the Republic of Korea, there was little interest in obesity until the mid 1990s. Nevertheless, many studies on obesity have been conducted, but few such studies have been conducted on preschool children [14-19]. Few detailed studies of obese and underweight individuals have been conducted [20-22], and these have only included partial concentrated areas.
Therefore, this study was conducted to generate basic and comparative data regarding the physical characteristics, dietary
The present study was supported by a grant of the Ministry of Health & Welfare, Korea in 2001-2005 (number 01-PJ1-pG1-01CH15-009).
§Corresponding Author: Hyun-Suh Park, Tel. 82-2-961-0260, Fax. 82-2-961-0261, Email. [email protected] Received February 17, 2010, Revised September 9, 2010, Accepted October 1, 2010
ⓒ2010 The Korean Nutrition Society and the Korean Society of Community Nutrition
This is an Open Access article distributed under the terms of the Creative Commons Attribution Non-Commercial License (http://creativecommons.org/licenses/by-nc/3.0/) which permits unrestricted non-commercial use, distribution, and reproduction in any medium, provided the original work is properly cited.
habits, nutrient intake, blood profiles, and mineral contents of preschool children to enable the prevention and cure of obesity.
To accomplish this, preschool children (aged three to five years) were divided into underweight, normal, and overweight groups and the average values for the aforementioned parameters were then compared among groups.
Subjects and Methods
Subjects and study period
For this study, 921 children (age 3~5 y) were randomly selected from child education facilities such as kindergartens (10 sites) with consideration of their social economic level. The children were chosen in Seoul and Gyeonggi areas from September, 2001 to February, 2004. The experimental period was about 3 years long to get as many as subjects.
Anthropometric measurements
Height (Sam Hwa Co., Seoul, Korea) and weight (Model TBF-1, Tanita Co, Ltd, Tokyo, Japan) were evaluated by one well-trained person. Body fat was analyzed using a Tanita BIA UM018 (Bioelectrical impedance analysis). The triceps skinfold was measured using a caliper. Head, chest, hip circumference, and waist circumference were measured using a measuring tape.
The head/chest ratio and waist/hip ratio were then calculated based on the measured values.
WLI (weight-length index) was used as the criterion of obesity and was determined based on the subjects' height and weight.
WLI (%) = A/B × 100
A : actual weight (kg)/actual height (cm)
B : 50th percentile expected weight (kg) for age/50th percentile expected height (cm)
Underweight : WLI < 90%, normal weight : WLI = 90-109.9%, overweight and obese : WLI ≥ 110%
Mini dietary assessment and types of snacks
Eating habits were assessed to judge the dietary habits using mini dietary assessments [23] composed of ten questionnaires.
These questionnaires, which were filled out by parents, consisted of questions with a 3-point response scale (3: always agree~1:
generally agree). The types of snacks consumed were also evaluated.
Dietary assessment and measurement
Dietary intake information was collected using food-frequency questionnaires [24]. Detailed descriptions of a total of 100 types of foods, including 14 types of grains and grain products, 10 types of meat products, 18 types of marine products, 13 types
of fruits, 7 types of beverages, as well as information regarding snacks, dairy products, and others items, were collected.
Diet composition was analyzed according to each nutrient using the Computerized Nutrient Analysis Program 3.0 (CAN- PRO 3.0, 8th edition, 2005). The nutrient intake of each subject was assessed based on the estimated energy requirement (EER), estimated average requirement (EAR), and adequate intake (AI), which are commonly used to assess the standard intake of children aged 3~5 y in Korea [25].
Analysis of blood samples
The blood samples were collected and analyzed (ADVIA 120, Bayer, USA) for white blood cells (WBC), red blood cells (RBC), hematocrit levels, mean cell volume (MCV), mean cell hemoglobin level (MCH), mean corpuscular hemoglobin concentration (MCHC), and hemoglobin (Hb).
Serum samples were centrifuged at 3,000 rpm for 15min at 5℃ after being allowed to stand at 4℃ for 1 hour. For analysis of the ferritin, total iron binding capacity (TIBC), transferrin, transferrin Fe saturation, and iron, a 100 μl aliquot of the serum was placed into a microtube and stored at -70℃ until analysis.
The level of ferritin was determined spectrophotometrically using a ferritin kit (Bayer, U.S.A) as previously described [26]. The total iron binding capacity (TIBC) was analyzed using a TIBC kit (RM 176-K, Elken, Japan) [27]. The transferrin level was determined using a transferrin kit (Behring, Germany), and the transferring level was analyzed using a Nephelometer (Behring Nephelometer, Germany). The iron concentration was determined using an automatic analyzer (HITACHI 7150, Tokyo, Japan) as previously described [28]. The serum transferrin Fe saturation (%) was determined as follows.
Transferrin Fe saturation (%) = (Serum iron/TIBC) × 100 The total protein levels were determined using a TP (Boehringer Mannheim, Germany) kit as previously described [29]. Serum samples were centrifuged at 2,500~3,000 rpm for 15~20 min and then analyzed using automatic analyzer (HITACHI 747, Tokyo, Japan). The IgA, IgG, and C3 levels were determined using IgA, IgG, and C3 kits (Behring, Germany) in conjunction with a nephelometer (Behring, Germany). The cholesterol level was analyzed using a cholesterol-R kit according to the manufacturers' recommendations (Youngdong Diagnostics, Korea). The level of triacylglycerol was determined using a TG kit (Bohringer Mannheim, Germany). The HDL-cholesterol level was analyzed using a HDL-C kit (Bohringer Mannheim, Germany) and an automatic analyzer (HITACHI 747, Tokyo, Japan). The atherogenic index (AI) was determined as follows.
AI (Atherogenic index) = {(total cholesterol-HDL-cholesterol)/
HDL-cholesterol}
Table 1. Distribution of WLI by the relative percentage of standard value in Korean preschool children
% of standard WLI < 90 90~109.9 ≥ 110 χ2-test Children (N, %) 124 (13.5) 598 (64.9) 199 (21.6) P < 0.001*
Total number of children : 921
N (%) : number of children, the relative % of children
*Significant at P< 0.05 by χ2-test
WLI : Weight-length index (WLI < 90% : underweight, WLI = 90~109.9% : normal weight, WLI ≥ 110% : overweight and obese)
Table 2. Anthropometric characteristics of subjects by WLI
Variables Total
Weight-length index
P-value Underweight
(124)
Normal weight (598)
Overweight and obese (199)
Height (cm) 110.36 ± 7.011) 107.33 ± 6.24a 109.47 ± 6.53b 114.93 ± 6.78c 0.05*
Weight (kg) 19.49 ± 3.74 16.26 ± 1.86a 18.64 ± 2.30b 24.08 ± 4.12c 0.05*
WLI (%) 102.25 ± 13.26 85.97 ± 4.03a 99.21 ± 5.13b 121.51 ± 12.69c 0.05*
Body fat (%) 25.71 ± 16.02 24.34 ± 18.17a 24.39 ± 15.43a 30.54 ± 15.47b 0.05*
Triceps skinfold (mm) 24.61 ± 21.51 23.11 ± 21.74a 22.77 ± 20.58a 31.06 ± 22.92b 0.05*
Head circumference (cm) 52.01 ± 3.77 50.21 ± 2.18a 51.58 ± 3.39b 54.43 ± 4.48c 0.05*
Chest circumference (cm) 57.84 ± 5.51 54.47 ± 4.03a 56.85 ± 4.37b 62.89 ± 6.12c 0.05*
Head/chest ratio 0.90 ± 0.06 0.93 ± 0.06a 0.91 ± 0.06b 0.87 ± 0.05c 0.02*
Hip circumference (cm) 49.65 ± 19.83 45.30 ± 19.34a 49.92 ± 18.83b 51.53 ± 22.57b 0.05*
Waist circumference (cm) 42.26 ± 16.37 38.01 ± 15.70a 42.39 ± 15.45b 44.49 ± 18.87b 0.002*
Waist-hip ratio 0.86 ± 0.06 0.86 ± 0.07a 0.86 ± 0.06a 0.88 ± 0.05b 0.003*
1)Mean ± SD
*Significant at P< 0.05 by ANOVA-test
Values with different alphabet were significant different among groups at *P< 0.05 by Duncan's multiple range test.
WLI : Weight-length index (WLI < 90% : underweight, WLI = 90~109.9% : normal weight, WLI ≥ 110% : overweight and obese)
Mineral content in hair
The mineral content of the hair of 550 willing subjects who did not have hair dyeing was evaluated. Briefly, 2~5 g of hair were collected from each child and then analyzed for mineral contents using inductively coupled plasma mass spectrometry (ICP-MS).
Statistical analysis
Statistical analysis was performed using the SPSS by means of one-way ANOVA. Statistical significance among experimental groups was examined by Duncan's multiple range tests (version 13.0). Differences were considered significant at P < 0.05.
Frequency, percentage, and differences among factors were analyzed by χ
2-test (P < 0.05).
Results
Stratification of obesity based on WLI
Child obesity was stratified into three groups based on WLI (Table 1). 64.9% of children were found to be in the normal range (WLI, 90~109.9%), while 13.5% had a WLI of less than 90% and 21.6% had a WLI of greater than 110%. Anthropometric
characteristics of the subjects after stratification by WLI are shown in Table 2. The average height of the total subject population was 110.36 ± 7.01 cm, and the average weight was 19.49 ± 3.74 kg. The height of the underweight group, normal group, and overweight and obese group was 107.33 ± 6.24 cm, 109.47 ± 6.53 cm, and 114.93 ± 6.78 cm, respectively (P < 0.05).
The weight of the underweight group, normal group, and overweight and obese group was 16.26 ± 1.86 kg, 18.64 ± 2.30 kg, and 24.08 ± 4.12 kg, respectively (P < 0.05). Overall, the height and weight of the subjects were 8.36 cm higher and 3.19 kg higher than the standard values (height 102 cm, weight 16.3 kg), respectively. Additionally, the average amount of body fat was 25.71 ± 16.02%, while this value was 30.54 ± 15.47% in the overweight and obese group, which was significantly higher than those of other groups (P < 0.05). The average values of the triceps skinfold, head circumference, chest circumference, hip circumference, and waist circumference were 24.61 ± 21.51 mm, 52.01 ± 3.77 cm, 57.84 ± 5.51 cm, 49.65 ± 19.83 cm, and 42.26 ± 16.37 cm, respectively.
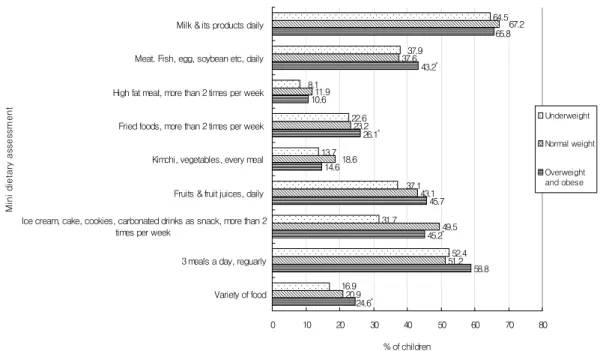
Assessment of eating dietary pattern of children
The serving of major food groups of the subjects are shown
in Fig. 1. The intake of milk and dairy products by the
underweight group, normal group, and overweight and obese
group was 64.5%, 67.2%, and 65.8%, respectively, which did
not differ significantly. In addition, the intake of kimchi,
vegetables, fruits, and three daily meals did not differ significantly
among the underweight, normal, and overweight and obese
groups. Furthermore, there were no differences in the intake of
ice cream, cake, cookies, and carbonated beverages more than
two times weekly as snacks among the three groups. However,
the intake of protein sources like meat, eggs, and beans for
underweight children was 37.9%, while this value was 37.6%
58.8 45.7 14.6
10.6
20.9
51.2 49.5 43.1 23.2
11.9
37.6
52.4 31.7
13.7 22.6
64.5 65.8
43.2*
24.6*
45.2* 26.1*
18.6
67.2
16.9
37.1 8.1
37.9
0 10 20 30 40 50 60 70 80
Variety of food 3 meals a day, reguarly Ice cream, cake, cookies, carbonated drinks as snack, more than 2
times per week
Fruits & fruit juices, daily Kimchi, vegetables, every meal Fried foods, more than 2 times per week High fat meat, more than 2 times per week Meat. Fish, egg, soybean etc, daily Milk & its products daily
Mini dietary assessment
% of children
Underweight Normal weight
Overweight and obese
Fig. 1. Comparison of dietary pattern among underweight, normal weight and overweight and obese children. *Significant at P< 0.05 by χ2-test Table 3. Distribution of children for their dietary quality graded by Mini dietary assessment score
Mini Dietary Assessment
Grade Score Frequency (%) Mean ± SD
Weight-length index Underweight
(n = 124)
Normal weight (n = 598)
Overweight and obese (n = 199)
Good 30-26 47 (5.1)
21.32 ± 2.55
2 (1.6) 20 (3.3) 7 (3.5)
Fair 25-18 845 (91.7) 116 (93.5) 544 (91.0) 186 (93.5)
6 (4.8) 34 (5.7) 6 (3.0)
Poor ≤ 17 29 (3.1)
Good = Answered 1-2 items as sometimes or seldom Fair = Answered 3-6 items as sometimes or seldom Poor = Answered more than 7 items as sometimes or seldom
for normal weight children and 43.2% for overweight and obese children, which represented a significant difference between underweight and overweight and obese children (P < 0.05).
Overweight and obese children also appeared to consume more fried and parched foods than underweight or normal weight children (P < 0.05). Moreover, only 16.9% of underweight children consumed three meals a day, while 24.6% of overweight and obese children ate three meals a day. Finally, overweight and obese children appeared to have the most evenly distributed meals among groups (P < 0.05).
As shown in Table 3, we graded the quality of the diets of the children as poor (= 17), fair (18~25), or good (26~30). The average score for the entire study group was 21.32 ± 2.55 point.
Among the subjects, 5.1% of the children had a dietary score of excellent (above 26), while 3.1% had a score of poor (below 17). Children whose dietary quality was poor consumed less kimchi and vegetables and used less salt and soy sauce during meals (data not shown).
The children (51.2%~58.8%) had regular three meals, but 35.6% of children reported that their diets contained unbalanced foods.
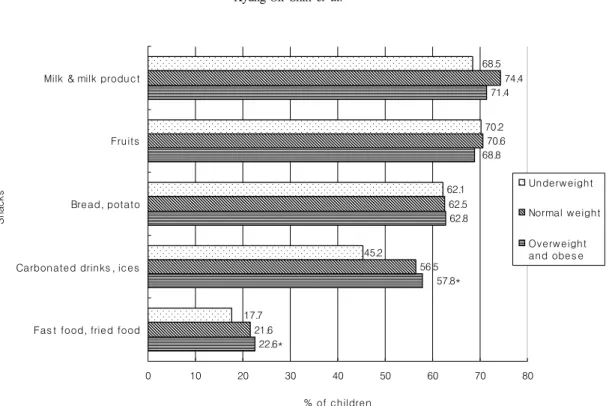
Snacking by children
As shown in Fig. 2, the subjects primarily consumed milk, dairy products, and fruits as snacks. However, the overweight and obese children consumed more carbonated beverages, ice cream (57.8%), and fast and fried foods (22.6%) than the other groups (P < 0.05).
Assessment of nutritional intake
The nutrient intake of the three groups is shown in Table 4.
The energy intake of the underweight group, normal group, and
overweight and obese group was 1,563.10 ± 675.16 kcal
(111.7%), 1,592.55 ± 720.79 kcal (113.8%), and 1,629.62 ±
556.22 kcal (116.4%), respectively. No differences in the intake
of carbohydrates, protein, or lipids were observed among the
three groups. The intake of vitamin A by all of the subjects was
734.70 ± 461.61 ugRE. The intake of vitamin B
1, B
2, B
6, niacin,
and vitamin C was slightly higher in the overweight group than
the other two groups, but no significant difference in the intake
of these compounds was observed among groups. Finally, no
62.8 71.4
21.6
56.5 62.5
70.6 74.4
62.1 70.2
22.6*
57.8*
68.8
17.7
45.2
68.5
0 10 20 30 40 50 60 70 80
Fas t food, fried food Carbonated drinks , ices Bread, potato Fruits Milk & milk product
Snacks
% of children
Underweight
Normal weight
Overw eight and obes e
Fig. 2. Preference for snacks in Korean preschool children. *Significant at P< 0.05 by χ2-test
Table 4. Nutrient intakes calculated by food frequency questionnaire
Nutrients1) Total Underweight Normal weight Overweight and obese P-
value Mean ± SD %EER3) %EAR4) %AI5) Mean ± SD %EER %EAR %AI Mean ± SD %EER %EAR %AI Energy (kcal) 1,596.56 ± 682.082) 1,563.10 ± 675.16 111.7 - - 1,592.55 ± 720.79 113.8 - - 1,629.62 ± 556.22 116.4 - - 0.676
Carbohydrate (g) 232.15 ± 98.63 225.77 ± 89.98 - - - 233.68 ± 102.79 - - - 231.67 ± 91.42 - - - 0.734
Protein (g) 60.22 ± 28.34 60.69 ± 29.17 - 404.6 - 59.51 ± 28.87 - 396.7 - 62.05 ± 26.17 - 413.7 - 0.538
Fat (g) 51.02 ± 27.03 51.27 ± 27.38 - - - 51.04 ± 28.09 - - - 51.15 ± 23.43 - - - 0.996
Vitamin A (μg RE) 734.70 ± 461.61 745.69 ± 435.03 - 355.1 - 718.93 ± 436.92 - 342.3 - 775.24 ± 542.62 - 369.2 - 0.316
Vitamin B1 (mg) 1.03 ± 0.49 1.02 ± 0.48 - 255.0 - 1.02 ± 0.50 - 255.0 - 1.07 ± 0.48 - 267.5 - 0.450
Vitamin B2 (mg) 1.32 ± 0.67 1.32 ± 0.64 - 220.0 - 1.35 ± 0.67 - 225.0 - 1.36 ± 0.67 - 226.7 - 0.564
Vitamin B6 (mg) 1.53 ± 0.82 1.54 ± 0.82 - 256.7 - 1.51 ± 0.82 - 251.7 - 1.58 ± 0.82 - 263.3 - 0.635
Niacin (mg) 13.49 ± 9.69 13.02 ± 9.50 - 260.4 - 13.40 ± 9.43 - 268.0 - 14.06 ± 10.54 - 281.2 - 0.594
Vitamin C (mg) 97.44 ± 77.39 96.85 ± 81.18 - 322.8 - 96.88 ± 77.74 - 322.9 - 99.50 ± 74.21 - 331.7 - 0.914
Vitamin E (mg) 9.07 ± 5.88 9.57 ± 6.38 - - 159.5 8.96 ± 5.89 - - 149.3 9.10 ± 5.54 - - 151.7 0.575
Folic acid (μg) 219.56 ± 139.99 215.56 ± 128.21 - 143.7 - 215.78 ± 136.60 - 143.9 - 235.25 ± 155.84 - 156.8 - 0.220 Calcium (mg) 727.18 ± 397.38 718.20 ± 372.72 - 179.6 - 720.23 ± 402.67 - 180.1 - 753.68 ± 397.03 - 188.4 - 0.569
Iron (mg) 10.47 ± 5.32 10.23 ± 4.93 - 204.6 - 10.34 ± 5.36 - 206.8 - 11.00 ± 5.44 - 220.0 - 0.272
Zinc (mg) 7.56 ± 3.44 7.55 ± 3.20 - 243.5 - 7.68 ± 3.55 - 247.7 - 8.11 ± 3.55 - 261.6 - 0.248
Phosphorus (mg) 966.80 ± 463.12 968.31 ± 458.78 - 248.4 - 955.07 ± 471.25 - 244.9 - 1001.10 ± 441.37 - 256.7 - 0.478 Sodium (mg) 2,358.10 ± 1,379.42 2,378.09 ± 1,352.50 - - 237.8 2,306.87 ± 1,342.30 - - 230.7 2,506.13 ± 1,509.49 - - 250.6 0.386
Fiber (g) 4.11 ± 2.56 4.02 ± 2.05 - - 23.6 4.04 ± 2.57 - - 23.8 4.39 ± 2.82 - - 25.8 0.406
1)KDRIs : Dietary Reference Intakes for Koreans, 2005
2)Mean ± SD
3)EER : estimated energy requirement
4)EAR : estimated average requirement
5)AI : adequate intake
significant differences in Ca, Fe, Zn, P, and sodium intake were observed among groups.
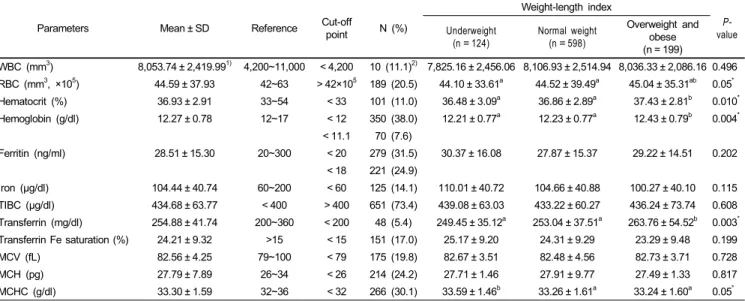
Blood profiles
The WBC and RBC counts of 80~99% of the study participants
were normal. However, 38.0% of children's Hb concentrations
were under 12 g/dl. But only 7.6% of these children were anemic
Table 5. Distribution of anemic children depending on hematologic data by weight-length index (WLI)
Parameters Mean ± SD Reference Cut-off
point N (%)
Weight-length index
P- value Underweight
(n = 124)
Normal weight (n = 598)
Overweight and obese (n = 199)
WBC (mm3) 8,053.74 ± 2,419.991) 4,200~11,000 < 4,200 10 (11.1)2) 7,825.16 ± 2,456.06 8,106.93 ± 2,514.94 8,036.33 ± 2,086.16 0.496 RBC (mm3, ×105) 44.59 ± 37.93 42~63 > 42×105 189 (20.5) 44.10 ± 33.61a 44.52 ± 39.49a 45.04 ± 35.31ab 0.05*
Hematocrit (%) 36.93 ± 2.91 33~54 < 33 101 (11.0) 36.48 ± 3.09a 36.86 ± 2.89a 37.43 ± 2.81b 0.010*
Hemoglobin (g/dl) 12.27 ± 0.78 12~17 < 12 350 (38.0) 12.21 ± 0.77a 12.23 ± 0.77a 12.43 ± 0.79b 0.004*
< 11.1 70 (7.6)
Ferritin (ng/ml) 28.51 ± 15.30 20~300 < 20 279 (31.5) 30.37 ± 16.08 27.87 ± 15.37 29.22 ± 14.51 0.202
< 18 221 (24.9)
Iron (µg/dl) 104.44 ± 40.74 60~200 < 60 125 (14.1) 110.01 ± 40.72 104.66 ± 40.88 100.27 ± 40.10 0.115
TIBC (µg/dl) 434.68 ± 63.77 < 400 > 400 651 (73.4) 439.08 ± 63.03 433.22 ± 60.27 436.24 ± 73.74 0.608 Transferrin (mg/dl) 254.88 ± 41.74 200~360 < 200 48 (5.4) 249.45 ± 35.12a 253.04 ± 37.51a 263.76 ± 54.52b 0.003* Transferrin Fe saturation (%) 24.21 ± 9.32 >15 < 15 151 (17.0) 25.17 ± 9.20 24.31 ± 9.29 23.29 ± 9.48 0.199
MCV (fL) 82.56 ± 4.25 79~100 < 79 175 (19.8) 82.67 ± 3.51 82.48 ± 4.56 82.73 ± 3.71 0.728
MCH (pg) 27.79 ± 7.89 26~34 < 26 214 (24.2) 27.71 ± 1.46 27.91 ± 9.77 27.49 ± 1.33 0.817
MCHC (g/dl) 33.30 ± 1.59 32~36 < 32 266 (30.1) 33.59 ± 1.46b 33.26 ± 1.61a 33.24 ± 1.60a 0.05*
Total number of children : 921
1)Mean ± SD
2)N (%) : number of children, the relative % of children
*Significant at P< 0.05 by ANOVA-test
Values with different alphabet were significant different among groups at *P< 0.05 by Duncan's multiple range test.
WBC : white blood cells, RBC : red blood cells, TIBC : total iron binding capacity, MCV : mean cell volume, MCH : mean cell hemoglobin, MCHC : mean cell hemoglobin concentration
Table 6. Plasma levels of protein and immune bodies by weight-length index (WLI) Parameters Total children Mean ± SD Reference Cut-off point N (%)
Weight-length index
P-value Underweight
(n=86)
Normal weight (n=426)
Overweight and obese (n=128)
Protein (g/dl) 888 7.06 ± 0.501) 6.6~8.5 < 6.6 128 (14.4)2) 7.11 ± 0.50 7.06 ± 0.49 7.01 ± 0.52 0.215
Albumin (g/dl) 888 4.34 ± 0.40 3.5~5 < 3.5 50 (5.6) 4.34 ± 0.41 4.35 ± 0.39 4.30 ± 0.44 0.393
Globulin (g/dl) 640 2.67 ± 0.30 1.1~5.0 < 1.1 - 2.75 ± 0.31b 2.66 ± 0.29a 2.64 ± 0.29a 0.023*
IgA (mg/dl) 640 99.93 ± 39.57 70~400 < 70 155 (24.2) 105.55 ± 41.71b 96.78 ± 38.71a 105.97 ± 40.13c 0.029*
C3 (mg/dl) 640 118.18 ± 18.91 90~180 < 90 24 (3.8) 113.13 ± 18.02a 117.47 ± 18.53a 123.93 ± 19.50b 0.05*
1)Mean ± SD
2)N (%) : number of children, the relative % of children
*Significant at P< 0.05 by ANOVA-test
Values with different alphabet were significant different among groups at *P< 0.05 by Duncan's multiple range test.
according to the standard level (11.1 g/dl) presented by the third National Health and Nutrition Examination Survey (NHANES
Ⅲ) [30]. Similarly, only 11.0% of children were found to be anemic based on the standard level of hematocrit (33%) specified in the NHANES Ⅲ [30]. The average values of Hb in the underweight group, normal group, and overweight and obese group were 12.21 ± 0.77 g/dl, 12.23 ± 0.77 g/dl, and 12.43 ± 0.79 g/dl, respectively. The average Hb value of the overweight and obese group (12.43 ± 0.79 g/dl) was significantly higher than that of the other groups (P < 0.05). The hematocrit mean value of the underweight group, normal group, and overweight and obese group were 36.48 ± 3.09%, 36.86 ± 2.89%, and 37.43 ± 2.81%, respectively (P < 0.05). Moreover, 31.5% of children with serum ferritin values less than 20 ng/ml were found to be anemic. And 14.1% of children whose iron concentration was less than 60 ug/dl were anemic, as were 17.0% of children proved to be anemic compared to transferrin Fe saturation percent (15%).
Although 7.6% to 17.0% of the children were anemic, a larger number of children (25%~32%) could easily become anemic due to a shortage of stored iron.
As shown in Table 6, 14.4% of children had serum protein concentrations below the recommended standard, and 5.6% of children had albumin serum concentrations below the normal level. However, all children had globulin levels that were within the normal range. Furthermore, the globulin serum concentration (2.75 ± 0.31 ml/dl) of the underweight group was greater than those of other groups (P < 0.05). 24.2% of children had below normal IgA concentrations, and children in the underweight and overweight and obese group had significantly higher IgA concentrations than children in the normal group. 3.8% of children had C3 in the shortage range, and this value was the highest in the overweight and obese group (123.93 ± 19.50 ml/dl) (P < 0.05).
As shown in Table 7, 89~99% of the children had normal
Table 7. Number of children with Plasma lipid greater than cut-off point by weight-length index (WLI)
Parameters Mean ± SD Reference Cut-off point N (%)
Weight-length index
P-value Underweight
(n = 75) Normal weight
(n = 368) Overweight and obese (n = 145)
Cholesterol (mg/dl) 167.05 ± 27.331) < 200 > 200 63 (10.7)2) 165.12 ± 29.13 167.15 ± 26.63 167.79 ± 28.28 0.785 Triacylglycerol (mg/dl) 77.60 ± 37.49 < 200 > 200 6 (1.0) 71.84 ± 33.95 76.97 ± 35.03 82.20 ± 44.39 0.131 HDL-cholesterol (mg/dl) 50.91 ± 10.59 30~75 < 30 4 (0.7) 50.55 ± 11.02 51.14 ± 10.39 50.52 ± 10.94 0.794
AI 2.37 ± 0.72 - - - 2.36 ± 0.72 2.36 ± 0.75 2.40 ± 0.62 0.839
Total number of children : 588
1)Mean ± SD
2)N (%) : number of children, the relative % of children
HDL-cholesterol : high density lipoprotein cholesterol, AI (Atherogenic index) = {(total cholesterol-HDL-cholesterol)/HDL-cholesterol}
Table 8. Average value of essential and harmful mineral contents in hair of Korean preschool children
Hair Minerals
Weight length index
P- value
Reference Value
(ppm)1) Mineral
Weight-length index
P- value
Reference Value (ppm) Underweight
(n = 75)
Normal weight (n = 370)
Overweight and obese
(n = 105)
Underweight (n = 75)
Normal weight (n = 370)
Overweight and obese (n = 105)
Essential minerals
Fe 12.50 ± 4.452) 12.75 ± 4.47 12.44 ± 4.04 0.771 11~24 Cr 0.47 ± 0.21 0.49 ± 0.22 0.50 ± 0.20 0.607 0.23~0.80 Zn 67.97 ± 28.51 70.09 ± 30.81 73.99 ± 30.36 0.374 180~220 Mn 0.26 ± 0.13 0.28 ± 0.15 0.31 ± 0.27 0.137 0.20~0.80 Cu 14.90 ± 7.56 14.84 ± 9.41 15.64 ± 8.61 0.721 3.9~23.3 Se 0.74 ± 0.13 0.74 ± 0.15 0.74 ± 0.13 0.842 0.50~2.00 Na 25.54 ± 16.87 26.56 ± 19.95 27.41 ± 18.29 0.814 18~85 Li 0.01 ± 0.005 0.01 ± 0.006 0.01 ± 0.005 0.147 0.01~0.20 Mg 11.41 ± 5.24 12.40 ± 16.70 11.71 ± 5.11 0.807 15~70 V 0.07 ± 0.03 0.08 ± 0.03 0.08 ± 0.03 0.213 0.02~0.10 P 121.70 ± 23.34 121.97 ± 18.39 124.40 ± 17.01 0.483 145~250 Co 0.01 ± 0.009 0.01 ± 0.01 0.01 ± 0.008 0.827 0.01~0.05 K 34.50 ± 13.28 34.08 ± 13.06 35.47 ± 15.75 0.655 5~40 Mo 0.07 ± 0.02 0.07 ± 0.04 0.08 ± 0.07 0.229 0.04~0.10
Ca 209.67 ± 65.72 218.38 ± 175.06 219.72 ± 77.55 0.887 190~738 - - - - -
Harmful minerals
Pb 1.66 ± 1.23 1.70 ± 1.16 1.78 ± 1.12 0.747 < 2 Ba 0.31 ± 0.29 0.33 ± 0.32 0.32 ± 0.18 0.857 < 0.6 Al 8.04 ± 3.43a 8.65 ± 4.15a 9.50 ± 3.78b 0.040* < 10 Hg 0.55 ± 0.32 0.50 ± 0.27 0.50 ± 0.22 0.282 < 1.5 As 0.11 ± 0.04 0.11 ± 0.06 0.10 ± 0.04 0.269 < 1 U 0.03 ± 0.04 0.04 ± 0.07 0.04 ± 0.08 0.373 < 1
Cd 0.07 ± 0.07 0.09 ± 0.15 0.08 ± 0.07 0.388 < 1.5 - - - - -
Total number of children : 550
1)WHO Reference value
2)Mean ± SD
*Significant at P< 0.05 by ANOVA-test
Values with different alphabet were significant different among groups at *P< 0.05 by Duncan's multiple range test.
cholesterol, triacylglycerol, and HDL-cholesterol levels. However, 10.7% of children had serum concentrations that were higher than normal. Nevertheless, the atherogenic index of all children was 2.37.
Mineral status in hair
As shown in Table 8, the concentrations of Fe, Cu, Ca, Cr, Mn, Se, Na, K, Li, V, Co, and Mo in hair were all in the normal ranges. The concentrations of Zn in the underweight group, normal group, and overweight and obese group were 67.97 ± 28.51 ppm, 70.09 ± 30.81 ppm, and 73.99 ± 30.36 ppm, respectively. The Zn level of the overweight and obese group (73.99 ± 30.36 ppm) was below the normal level (180~220 ppm) (WHO Reference value). Additionally, the Mg level of all children was lower than the normal level (15~70 ppm), as was the P content (121.70 ppm~124.40 ppm) of all children (normal
= 145~250 ppm).
The concentrations of the toxic elements Pb, Ba, Hg, Al, As, Cd, and U were all in the normal ranges. The Al contents of the underweight group, normal group, and overweight and obese
group differed significantly, as indicated by values of 8.04 ± 3.43 ppm, 8.65 ± 4.15 ppm, and 9.50 ± 3.78 ppm, respectively (P <
0.05).
Discussion
Westernization of the dietary pattern, the simplicity of the everyday lifestyle, excessive nutrient intake, and the preference of foods have resulted in an increase in childhood obesity.
Additionally, the obese portion of the population is increasing.
Indeed, recent reports of the nutritional management of obesity [9] have shown that, in 1984, the rate of obesity among male and female children was 9% and 7%, respectively, but that by 1994 this rate had reached 19% and 16% in male and female children, respectively. Furthermore, the rate of medium obesity has increased remarkably. In 1998 [31], the rate of obesity among male preschool children (2~6 y) in Seoul and its vicinity was 20.3%, while that of female preschool children was 12.0%.
According to a survey of national health conducted in 2005 [32],
8.8% of children (5~9 y) were obese (male 8.3% and female
9.5%). A similar tendency of increasing obesity was reported in Japan, where, from 1973 to 1994, the rate of individuals with a weight higher than 120% of the normal weight has increased from 5% to 10% and the rate of individuals with a weight higher than 140% of the normal weight has increased from 1% to 2%
[33]. Furthermore, according to a recent report in China [34,35], 14.1% of female children and 27.7% of male children were overweight or obese, which was double the number of overweight and obese children in China in 1989. Moreover, many recent studies have reported that morbid obesity is increasing in general.
It has also been reported that it is necessary to observe the environments of children who are in their rapid growing period to prevent obesity [36]. Indeed, childhood obesity has become more serious than underweight among children because it leads to various diseases and can occasionally cause death [37,38].
The children participated in this study were from the families (monthly income 3 millions to 5 millions), which likely had an effect on the results of the study. Nevertheless, 64.9% of the subjects were found to have a normal weight (WLI = 90~
109.9%), while 13.5% were underweight (WLI < 90%) and 21.6% were overweight and obese (WLI ≥ 110%) according to the WLI. These findings indicate that the physical development of children was delocalized into polarization.
The results of this study demonstrated that overweight and obese children consumed greater amounts of foods such as meat, fish, eggs, soy protein, fried foods, and deep friend foods than underweight or normal children (P < 0.05). The findings presented here also demonstrated that 24.6% of overweight and obese children have a better balanced diet than underweight or normal weight children (P < 0.05). Additionally, overweight and obese children were found to have a tendency to consume more carbonated soft drinks, ice cream, fast foods (57.8%), and fried foods as snacks (22.6%) than underweight or normal children (P < 0.05). Park et al. [39] reported that overweight children have a low preference for wild herbs, vegetables, and vegetable juice but have a high preference for bulgogi, ham, sausage, doughnuts, and cookies. In this study, average score of the dietary habit of the entire group of children was 21.32 ± 2.55 point, with 5.1%
of children having excellent dietary habits and 3.1% having poor dietary habits. Evaluation of the questionnaires revealed that children with poor dietary habits had decreased intake of kimchi, vegetables, and meat. In general, children appeared to eat regular meals, but 35.6% of children reported that they had an unbalanced diet. Kerrey et al. [40] reported that the preferences and dietary habits of children were factors that decided their lifetime dietary habits and assessment. Additionally, according to Gibson et al. [41], the nutritional knowledge of the child's mother is associated with his or her fruit intake and dietary quality and the mother's vegetable intake has a positive effect on the dietary intake of her child [42,43]. Because current dietary habits of adults that have been formed during childhood are not easily changed, early dietary education is necessary to ensure that children develop balanced dietary habits.
In the present study, it was found that all nutrient (energy, protein, vitamin A, B
1, B
2, B
6, niacin, vitamin C, E, folic acid, calcium, iron, zinc, phosphorus, and sodium) intake except fiber was excessive according to KDRI [25]. No differences were observed among groups, and the energy intake of the three groups was higher than the KDRIs values [25] for energy (1,400 kcal).
The intake of vitamin A by all of the subjects was greater than that reported in the KDRIs (300 ugRE) [25]. Half of the subjects consumed more vitamin C than recommended by the standard (40 mg). Additionally, the intake of folic acid was greater than the required intake in all subjects (180 ug). The results of this study indicate that children need to consume more fiber because the intake of fiber of all three groups (23.6%~25.8%) was below the level of the KDRIs (3~5 y, AI : 17 g) [25] for fiber. To accomplish this, the intake of fruits and vegetables should be increased. No significant differences were observed in the overall nutrient intake among the three groups.
The plasma RBC, hematocrit, Hb, and transferrin levels of overweight and obese children were higher than those of underweight and normal weight children (P < 0.05). However, no differences in the plasma cholesterol, triacylglycerol, and HDL-cholesterol levels were observed among the three groups.
The results of this study were different from those of a previous study [44], in which the plasma triacylglycerol, LDL-cholesterol, VLDL, and insulin levels were higher and the HDL-cholesterol was lower in overweight elementary school children than in underweight and normal weight children. In the present study, it is likely that no difference in plasma lipid profiles was observed because the subjects were aged 3~5 years, which is a basic period for physical development.
Among the total subjects, 7.6% were anemic according to the standard Hb level (Hb < 11.1 g/dl), 17.0% were anemic according to the standard %Sat level (%Sat < 15%), and 31.5% were anemic according to the standard ferritin level (ferritin < 20 ng/ml). In Canada, it was reported that 4~5% of children had a hemoglobin concentration of less than 100 g/L [45], while Winichagoon [46]
reported that anemic rates were reduced from 41% to 25% in Thailand. In Cameroon, it was reported that 42% of children under the age of three were anemic and 21% of children aged 3~5 y were anemic [47]. In Zaire, 43% of children under the age of five were found to be anemic [48] ; meanwhile, 74%
of children were reported to be anemic [49]. Although anemia occurs worldwide, it is concentrated in African countries and anemia among children is low in developed countries [50].
Additionally, intellectual instability has been found to affect the dietary habits and preference for foods and to result in physical and developmental retardation [51].
The mean values of Fe, Cu, Ca, Cr, Mn, Se, Na, K, Li, V,
Co, and Mo in the hair of all children were within the reference
values, but the mean concentration of Zn was much lower than
the reference value. Additionally, the Zn concentrations of the
hair of children in the present study were much lower than the
Zn concentrations of hair in children aged 2~7 in the United
States (100~210 ppm) and Poland (129.65 ppm) [52]. Senofonte et al. [53] reported that the concentration of Zn in the hair of children aged 3~15y in urban areas in Italy was under the reference value (150 ppm). Zn concentration of this study was in the range (30~13 ppm) of children in Korea which was leveled in the previous results by Park et al. [54] in 2006. Medically, a Zn deficiency is considered a hazard factor, and it has been found to be necessary to supply Zn to individuals with inadequate energy, to treat alcoholism and gastrointestinal disease, and to prevent the retardation of growth in children. For vegetarians, it is necessary to consume 50% more Zn than non-vegetarians because Zn absorption can be reduced by the components of vegetarian food [55]. Zn concentration in hair was varied according to species, age, gender, region, environmental factor, and individual character. Zn concentration was lower than standard values of other countries, but it will be serious problem in nutritional aspect.
New guidance and nutritional education are necessary to prevent the development of poor eating habits and unbalanced diets because they can lead the children to develop underweight, obesity, and anemia. Additionally, it is advisable to consult with a physician to determine if children are receiving adequate amounts of Zn and Fe. Taken together, the results of this study indicate that it is imperative for parents to ensure that their children develop good dietary habits and to manage the nutrition that their children receive.
References
1. Nam HW, Um YS, Chung EJ. A comparative study on dietary attitudes and nutritional status of preschoolers in different income levels in Seoul and Kyunggido. The Korean Journal of Dietary Culture 1998;13:405-14.
2. Brich LL. The role of experience in children's food acceptance patterns. J Am Diet Assoc 1987;87;S36-40.
3. Kim YK, Chyun JH. Food habits and its relation to the obesity of preschool children living in urban area. The Korean Journal of Dietary Culture 2000;15:349-60.
4. Kim SK, Kim HJ. Comparison of the blood lipids, insulin and nutrients intake by fat distribution of obese male in Korea. The Korean Journal of Nutrition 1998;31:72-9.
5. Mossberg HO. 40-year follow-up of overweight children. Lancet 1989;2:491-93.
6. Maffeis C. Aetiology of overweight and obesity in children and adolescents. Eur J Pediatr 2000;159:S35-44.
7. Steinberger J, Steffen L, Jacobs DR Jr, Moran A, Hong CP, Sinaiko AR. Relation of leptin to insulin resistance syndrome in children. Obes Res 2003;11:1124-30.
8. Lee JS, Lee JY, Lim HJ, Cho MR, Choue R. Comparisons of anthropometric measurements, body fat, blood parameters and nutrients intakes in over- and desirable-body weight school children. Journal of Korean Dietetic Association 2003;9:316-25.
9. Kim JH, Kim BH, Kim K, Son SM, Mo SM, Choi HM. A study on food according to obesity index of elementary school children in high socioeconomic apartment complex in Seoul. The Korean
Journal of Dietary Culture 1993;8:275-87.
10. Kim KA, Kwun IS, Kwon CS. Potential relationship between obesity and risk for coronary heart disease in Kyungbuk area.
The Korean Journal of Nutrition 2001;34:664-70.
11. Ahn HS, Park JK, Lee DH, Paik IK Lee JH, Lee YJ. Clinical and nutritional examination in obese children and adolescents.
The Korean Journal of Nutrition 1994;27:79-89.
12. Choi SH, Kim KB, Park SK, Jeoung JT, Son CS, Dokgo YC.
The study of serum lipids in grossly obeses elementary school students in Seoul. Korean Journal of Pediatrics 1993;36:73-80.
13. Robertson SM, Cullen KW, Baranowski J, Baranowski T, Hu S, de Moor C. Factors related to adiposity among children aged 3 to 7 years. J Am Diet Assoc 1999;99:938-43.
14. He Q, Ding ZY, Fong DYT, Karlberg J. Risk factors of obesity in preschool children in china : a population-based case-control study. Int J Obes Relat Metab Disord 2000;24:1528-36.
15. Park JN, Kim KH, Lee SS. A study of factors affecting bone mineral density in children : Anthropometric measurements, socioeconomic factors, family history and other environmental factors. The Korean Journal of Nutrition 2004;37:52-60.
16. Kim NH, Kim JM, Kim HS, Chang NS. Effect of nutrition and exercise education on fat mass and blood lipid profile in postmenopausal obese women. The Korean Journal of Nutrition 2007;40:162-71.
17. Lee JH, Chae JS, Koh SJ, Kang SM, Choi DH, Jang YS. Caloric restrictions vs testosterone treatment: the effect on body fat distribution and serum lipid levels in overweight male patients with coronary artery disease. The Korean Journal of Nutrition 2003;36:924-32.
18. Anuurad E, Shiwaku K, Nogi A, Kitajima K, Enkhmaa B, Shimono K, Yamane Y. The new BMI criteria for asians by the regional office for the western pacific region of WHO are suitable for screening of overweight to prevent metabolic syndrome in elder Japanese workers. J Occup Health 2003;45:335-43.
19. Bayles B. Perceptions of childhood obesity on the Texas-Mexico border. Public Health Nurs 2010;27:320-8.
20. Christian P. Maternal height and risk of child mortality and undernutrition. JAMA 2010;303:1539-40.
21. Maddah M, Shahraki T, Shahraki M. Underweight and overweight among children in Zahedan, south-east Iran. Public Health Nutr 2010;13:1519-21.
22. Park HS, Shin KO. Hair zinc and lead : Relationship to nutrient intake and height and body weight in Korean preschool children.
The Korean Journal of Nutrition 2004;37:193-201.
23. Kim WY, Cho MS, Lee HS. Development and validation of mini dietary assessment index for Koreans. The Korean Journal of Nutrition 2003;36:83-92.
24. Lim Y, Oh SY. Development of a semi-quantitative food frequency questionnaire for preschool children in Korea. The Korean Journal of Community Nutrition 2002;7:58-66.
25. The Korean Nutrition Society. Dietary Reference Intakes for Koreans. Seoul, Korea; 2006.
26. Kadar N, Caldwell BV, Romero R. A method of screening for ectopic pregnancy and its indications. Obstet Gynecol 1981;58:
162-6.
27. Persijn JP, van der Slik W, Riethorst A. Determination of serum iron and latent iron-binding capacity(LIBC). Clin Chim Acta 1971;35:91-8.
28. Kim YG, Kim NS, Song JG. Effect of long term aerobic exercise on blood pressure, blood lipids and hematological parameters in
elderly women over 65 years old. The Korean Journal of Exercise Nutrition 2003;7:235-40.
29. Parvin R, Pande SV, Venkitasubramanian TA. On the colorimetric biuret method of protein determination. Anal Biochem 1965;12:
219-29.
30. World Health Organization. National Health and Nutrition Exa- mination Survey Ⅲ U.S.A 47 (RR-3); 1998. p.1-25.
31. Moon HK, Chung HR, Song BH, Park HR. Factors related to infant growth in low-income households. Journal of the Korean Public Health Association 1991;17:118-29.
32. Korea centers for disease control and prevention and Korean Institute for Health and Social Affairs. In-depth Analyses of the Third National Health and Nutrition Examination Survey: the Health Interview and Health Attitude Survey Part. (Korean);
2007.
33. Yum KS, Yoon EY, Kim CI, Kim KT, Mo SM, Choi HM. Eating behavior obesity and serum lipid levels in children. The Korean Journal of Nutrition 1993;26:56-66.
34. Cheng TO. Childhood obesity in China. Health Place 2004;10:
395-6.
35. Iwata F, Hara M, Okada T, Harada K, Li S. Body fat ratios in urban Chinese children. Pediatr Int 2003;45:190-2.
36. Kim IK, Kang JH, Song JH. Serum leptin levels and changes in body weight and obesity index in Gwacheon elementary school children. The Korean Journal of Nutrition 2007;40:736-44.
37. Must A, Strauss RS. Risks and consequences of childhood and adolescent obesity. Int J Obes Relat Metab Disord 1999;23:
S2-11.
38. Moon HK, Jung HJ, Park SY. Indicators of nutritional status on the basis of preschool children's growth. The Korean Journal of Community Nutrition 1998;3:3-11.
39. Park JK, Ahn HS, Lee DH. Nutrient intake and eating behavior in mid and severely obese children. The Korean Journal of Obesity 1995;4:43-50.
40. Kerrey E, Crispin S, Fox HM, Kies C. Nutritional status of preschool children : Ⅰ. Dietary and biochemical findings. Am J Clin Nutr 1968;21:1274-9.
41. Gibson EL, Wardle J, Watts CJ. Fruit and vegetable consump- tion, nutritional knowledge and belief in mother and children.
Appetite 1998;31:205-28.
42. Fisher JO, Mitchell DC, Smiciklas-Wright H, Birch LL. Parental influences on young girls' fruit and vegetable, micronutrient and
fat intakes. J Am Diet Assoc 2002;102:58-64.
43. Reimer K, Smith C, Reicks M, Henry H, Thomas R, Atwell J.
Child-feeding strategies of African American woman according to stage of change for fruit and vegetable consumption. Public Health Nutr 2004;7:505-12.
44. Kim SH, Kim GE, Kim SY. A study on relations of obesity to the serum lipid and insulin concentrations in the elementary school children. The Korean Journal of Nutrition 1998;31:159-65.
45. Zlotkin S. Clinical nutrition : 8. The role of nutrition in the prevention of iron deficiency anemia in infants, children and adolescents. CMAJ 2003;168:59-63.
46. Winichagoon P. Prevention and control of anemia: Thailand experiences. J Nutr 2002;132:862S-866S.
47. Cornet M, Le Hesran JY, Fievet N, Cot M, Personne P, Gounoue R, Beyeme M, Deloron P. Prevalence of and risk factors for anemia in young children in southern Cameroon. Am J Trop Med Hyg 1998;58:606-11.
48. Hedberg K, Shaffer N, Davachi F, Hightower A, Lyamba B, Mbudi Paluku, Nguyen-Dinh P, Breman JG. Plasmodium falciparum-associated anaemia in children at a large urban hospital in Zaire. Am J Trop Med Hyg 1993;48:365-71.
49. Premji Z, Hamisi Y, Shiff C, Minjas J, Lubega P, Makwaya C.
Anemia and plasmodium falciparum infections among young children in an holoendemic area, Bagamoyo, Tanzania. Acta Trop 1995;59:55-64.
50. Walter T. Effect of iron deficiency anemia on cognitive skills and neuromaturation in infancy and childhood. Food Nutr Bull 2003;24:S104-10.
51. Park HS, Ahn SH. Eating habits and social behavior in Korean preschool children. The Korean Journal of Nutrition 2003;36:
298-305.
52. Nowak B. Contents and relationship of elements in human hair for a non-industrialised population in Poland. Sci Total Environ 1998;209:59-68.
53. Senofonte, Violante N, Caroli S. Assessment of reference values for elements in human hair of urban schoolboys. J Trace Elem Med Biol 2000;14:6-13.
54. Park HS, Shin KO, Kim JS. Assessment of reference values for hair minerals of Korean preschool children. Biol Trace Elem Res 2007;116:119-30.
55. Gibson RS. Content and bioavailability of trace elements in vegetarian diets. Am J Clin Nutr 1994;59:1223S-1232S.