Effect of Scytosiphon lomentaria Ethanol Extracts on Myostatin Activity and Zebrafish Obesity Induced by High Feeding
Jun Gyo Jung
1, Jae Hong Kim
1, Jeong Hwan Kim
1,3, Yong Soo Kim
2, Deuk-Hee Jin
1and Hyung-Joo Jin
1*
1Department of Marine Molecular Bioscience, Gangneung-Wonju National University, Gangneug-si, Ganwon-do 25457, Korea
2Department of Human Nutrition, Food and Animal Sciences, University of Hawaii, Honolulu, Hawaii 96822, United States of America
3Department of Nanobody research, Shaperon Inc., Gangnam ACE tower 606, Gangnam-gu, Seoul 06373, Korea Received September 16, 2020 /Revised April 13, 2021 /Accepted April 13, 2021
Muscle mass improvement through lifestyle modification has been shown to reduce the risk of meta- bolic syndrome. This study examined the capacity of ethanol extracts of Scytosiphon lomentaria (SLE) to suppress the bioactivity of myostatin, a potent negative regulator of skeletal muscle mass, as well as the effect of SLE treatment on metabolic homeostasis in obese zebrafish induced by high feeding.
A total of 10 μg/ml SLE completely blocked myostatin (1 nM/ml) signaling in the pGL3-(CAGA)
12luciferase assay and suppressed myostatin-induced Smad2 phosphorylation in the Western blot analysis. In the zebrafish larvae analysis, the whole body glucose concentration of the high feeding control (HFC) group was significantly higher than that of the normal feeding control (NFC) group.
However, the glucose levels of the high feeding group treated with 12.5 ug SLE and of the high feed- ing group treated with 18.75 ug SLE were similar to those of the NFC group. The mRNA expression level of the GLUT2 gene of the HFC group was significantly lower than that of the NFC group. SLE treatment restored the expression of the GLUT2 gene to a level that was close to that of the NFC group, indicating that SLE is capable of regulating glucose levels in zebrafish larvae. The current re- sults highlight the potential of SLE as a natural MSTN inhibitor and supplement that can be used to facilitate the treatment of metabolic syndrome.
Key words : Inhibitor, myostatin, muscle, obese zebrafish, Scytosiphon lomentaria
*Corresponding author
*Tel : +82-33-640-2349, Fax : +82-33-640-2340
*E-mail : [email protected]
This is an Open-Access article distributed under the terms of the Creative Commons Attribution Non-Commercial License (http://creativecommons.org/licenses/by-nc/3.0) which permits unrestricted non-commercial use, distribution, and reproduction in any medium, provided the original work is properly cited.
Introduction
The metabolic syndrome has been on the rise because of westernized eating habits and lack of exercise. This phenom- enon is widespread globally, ranging in prevalence from 10
~40% [15]. For this reason, metabolic syndrome is a serious health problem worldwide. The metabolic syndrome is a risk factor for cardiovascular disease and type 2 diabetes mellitus that is characterized by the clustering of obesity, hyper- tension, dyslipidemia, and insulin resistance [16]. Methods of prevention and treatment for metabolic syndrome have been dietary control, exercise, pharmacotherapy, or a combi- nation of those methods. Recently, the increase in muscle mass through lifestyle modifications and resistance exercise has been reported to reduce the risk of metabolic syndrome
[19, 28]. These studies indicate that muscle tissue is an im- portant organ in facilitating metabolic homeostasis.
Skeletal muscle comprising ~30-40% of total body mass plays a major role in locomotion, as well as energy metabo- lism [4]. Studies have shown that muscle mass is negatively regulated by myostatin, a member of transforming growth factor-beta (TGF-β) superfamily [23]. During embryonic de- velopment, myostatin negatively regulates myogenesis through modulation of myoblast proliferation and differ- entiation [26], and in postnatal growth, myostatin negatively affects skeletal muscle mass via regulation of muscle protein synthesis and degradation or satellite cell activation [3]. Sup- pression of myostatin induces the hypertrophy of muscle fi- bers in mice via the activation of the anabolic IGF/Akt/
mTOR signaling pathway, resulting in increased muscle
mass [2, 35]. Studies have shown enhanced expression of
myostatin in aging process or various disease conditions
such as muscular dystrophy (DM), amyotrophic lateral scle-
rosis (ALS), congestive obstructive pulmonary disease
(COPD), chronic heart failure (CHF), acquired immune defi-
ciency syndrome (ADIS), cancer cachexia, renal failure, ure-
mia, rheumatoid arthritis (RA) [12]. Because of the negative
role of myostatin on muscle mass, myostatin antagonists has emerged as a therapeutic strategy to treat metabolic syn- drome and muscle atrophy [2].
Zebrafish has various advantages as a model to study hu- man diseases because it has similar genetic identities and organ systems to the human [31, 38]. Also, the zebrafish em- bryo is small and transparent, the development is rapid, and the generation time is short. These advantages have led to the use of the zebrafish model in molecular and toxicology and drug discovery research. In particular, they are suitable as an animal model of obesity and diabetes because its lipid and glucose metabolism are very similar to those of the hu- man, and many researchers used the zebrafish as a model for obesity study [5, 10, 18, 25, 34].
Recently, interest in natural products rapidly increases in various pharmacological fields because of its better econom- ical aspect of developing therapies designed for multi-target and lower side effects than synthetic products. Whip tube (Scytosiphon lomentaria, SL) is a littoral brown alga and being abundantly distributed on temperate water worldwide. S.
lomentaria contains a number of potentially biologically ac-
tive compounds and the reported bioactivities include anti- fouling, anti-inflammation, anti-oxidant, anti-cancer, and bone formation effect [8, 21, 22, 30]. Recently, a variety of physiologically-relevant functional activities of the extracts of SL has been reported, thus SLE has been regarded as healthy food [32]. However, the effects of S. lomentaria on muscle growth either in vitro or in vivo have not yet reported. Thus, the purpose of this study was to examine whether the ethanol extract of S. lomentaria (SLE) has myo- statin-inhibitory activity and to investigate its effect on obe- sity in zebrafish induced by high-diet feeding.
Materials and Methods
Preparation of S. lomentaria‘s ethanol extracts (SLE) Fresh S. lomentaria (SL) was collected at Sacheonjin-ri, Gangneung-si, Gangwon-do, Korea. The collected samples were washed with tap water and dried in shade at room temperature. The dried SL was then ground and stored at -20℃ until use. The SL powder was extracted in 100% etha- nol (1:50(w/v)) for 24 hr under dark condition. After 24 hr, the supernatant was filtered by 100 μm mesh gauze and con- centrated by rotary evaporator at 37℃. The residues were re-extracted with 100% ethanol and the re-extraction was re- peated twice, then the SLE was pooled. The pooled SLE was
centrifuged at 1,590x g in room temperature, and the super- natant was filtered by a 0.45 μm syringe filter. The filtered SLE was dried under vacuum on a centrifugal evaporator (Hanil, Korea) and was dissolved in 100% DMSO (Sigma, USA), then the SLE was stored at -20℃ until use for in vitro and in vivo study.
Determination of the total carbohydrate, polyphe- nolic, and protein contents
Phenolic contents determination method was modified Ding et al. [9]. Each 10 ul of SLE, 100 ul of 95% EtOH, 500 ul of distilled water, and 500 ul of 50% Phenol reagent were mixed. The mixtures were react for 5 min. then, added 5%
Na
2CO
3into the mixture before placing in the dark for 1 hour. The sample was measured at 725 nm and gallic acid standard curve was used for calculation of phenolic content.
The carbohydrate contents determined by phenol sulfuric acid method and calculated by glucose standard curve. The protein content was determined by BCA assay kit (Thermo Fisher Scientific, USA).
Cytotoxicity test by WST assay
The cytotoxicity of SLE was examined using the WST (Water Soluble Tetrazoleum) assay kit (Dogen, Korea) with L6 cells. Cells were seeded in 96 well plates (1×10
4cells/100 μl/well) and grown in DMEM (GE Healthcare, PA, USA) containing 10% FBS (GenDepot, TX, USA), 1% penicillin/
streptomycin (GE Healthcare, PA, USA). The cells were maintained in a humidified incubator with 5% CO
2at 37℃.
After 24 hr, various concentrations of SLE (50, 25, 5, 1 μg/ml) were added into the wells. Some wells were not added with SLE to serve as a negative control and some wells were add- ed with H
2O
2(final concentration, 0.08 M) to serve as a pos- itive control. After 24 hr, 10 μl WST reagent was added to each well. After 1 hr, the plate was shaken for 1 min and absorbance was measured using a microplate reader (Bio Tek, Seoul, Korea) at 415 nm. The percentage of cell viability was calculated using the following formula: {(the value of positive control well - the value of SLE well) / (the value of positive control well–the value of negative control well)}
×100.
pGL3-(CAGA)
12-luciferase reporter assay
The anti-myostatin activity of SLE was examined using
a pGL3-(CAGA)
12-luciferase reporter assay. HEK293 cells
stably expressing (CAGA)
12-luciferase gene construct [6]
were seeded in 96 well plates at 2×10
4cell/100 μl/well and grown in DMEM containing 10% FBS, 1% penicillin/strep- tomycin and 0.01% geneticin. The cells were maintained in a humidified incubator with 5% CO
2at 37℃. After 24 hr, the medium was replaced with 100 μl of serum-free DMEM.
Then 1 nM ligand (myostatin, GDF11, or Activin A (R&D systems, USA)) with various concentrations of SLE was add- ed to each well. After 24 hr, luciferase activity was measured by a microplate luminometer (Promega, USA) using the Bright-Glo luciferase assay system following the manu- facturer’s protocol. The percentage inhibition of myostatin activity was calculated by the following formula: Percentage of inhibition capability = (luminescence at 1 nM ligands (myostatin, Activin A or GDF11)–luminescence at the vari- ous concentration of SLE) ×100 / (luminescence at 1 nM li- gands (myostatin, Activin A or GDF11)–luminescence at 0 nM ligands). IC
50(ligand concentration inhibiting the activity of myostatin, GDF11 or Activin A) value was estimated by a non-linear regression model defining a dose-response curve as described previously using the Prism6 program (GraphPad, CA, USA) [24]. The equation for the model was Y=Bottom + (Top-Bottom)/[1+10^(X-LogIC
50)], where Y is % inhibition, Bottom is the lowest value of % inhibition set at 0%, Top is the highest value of % inhibition set at 100%, and X is Log ligand concentration. IC
50values were analyzed by ANOVA using the same program.
Western blot analysis
To examine the effect of SLE on myostatin-induced phos- phorylation of Smad2, HepG2 cells were seeded in 6 well plates at 2×10
5cells/well, and grow in DMEM containing 10% FBS, and 1% penicillin/streptomycin. The cells were maintained in a humidified incubator containing 5% CO
2at 37℃. After 24 hr, the medium was replaced with 2 ml of serum-free DMEM for starvation. After 4 hr, the cells were treated with 10 nM of myostatin plus SLE (55.0 or 1.6 μg/ml) under a serum-free condition for 30 min. SB431542 (10 μM), an inhibitor of activin receptor-like kinase (ALK) 4/5/7 (Sigma, USA), was used as a positive control. The cells were washed with PBS and lysed in RIPA buffer (NEB, USA) con- taining protease inhibitors cocktail (Roche, Switzerland) and phosphatase inhibitors cocktail (Roche, Switzerland) at 4℃
for 5 min. The lysates were sonicated for 15 sec on ice and centrifuged at 14,320x g for 20 min at 4℃. Protein concen- trations of the supernatants were determined by the BCA protein assay kit (Thermo Scientific, USA). 50 μg protein
sample was subjected to electrophoresis on 10% polyacryl- amide gel and transferred to PVDF membrane (Millipore, USA). The membrane was blocked with 5% skim milk (BD, USA) or 5% BSA (Gendepot, USA) in TBS-T (100 mM Tris, 0.9% NaCl, 0.1% tween 20, pH 7.5) at room temperature.
After 2 hr, the membranes were probed with primary anti- bodies; anti-phospho-Smad2 rabbit mAb (1:2,000, #3108, Cell signaling, USA), anti-Samd2 rabbit mAb (1:2,000, #3122, cell signaling, USA), and anti-actin mouse mAb (1:4,000, #3700, Cell signaling, USA) at room temperature for 3 hr, and wash- ed with TBS-T. The primary antibodies were detected with horseradish peroxidase conjugated secondary antibodies (anti-rabbit IgG HRP-linked antibody and anti-mouse IgG HRP-linked antibody). The signal was developed using the SuperSignal West Femto Maximum Sensitivity Substrate (Thermo Scientific, USA) and visualized on Kodak Omat X-ray films. Densitometry analysis of the images obtained from X-ray films was performed using the Image J software (NIH).
Treatment of laval zebrafish with SLE
The zebrafish experiment was conducted in accordance with the current law and guiding principles for the care and use of laboratory animals approved by the Animal Ethics Committee of Gangneung-Wonju National University (Gang- neung, Korea, protocol # GWNU-2017-11). Zebrafish were obtained from a local fish supplier (Seoulaqua, Korea) and kept at 28.5±0.5 under a 14 L:10 D cycle, and water quality was maintained by passing tap water through a UV light sterilizing filtration. To obtain fertilized eggs, the fertiliza- tion tank containing adult male and female zebrafish was placed in the dark overnight. The eggs were collected within two hours after the light was turned on the next morning and put on a petri-dish. Fertilized eggs were sorted from infertile eggs and debris such as scales and waste products of the fish. Zebrafish larvae were fed microencapsulated fry food (Hatchfry Encapsulon, Argent Laboratories, WA, USA) three times daily until 4 days post-fertilization (dpf). Bet- ween 5 and 11 dpf, microencapsulated fry food and Artemia nauplii (4/zebrafish larva), and between 12 and 13 dpf, only
Artemia nauplii (6/zebrafish larva) three times daily. Artemianauplii were prepared by hatching artemia cyst that was purchased from Diversified Technologies International Inc.
(UTAH, USA). At 14 dpf, zebrafish larvae were randomly
divided into two groups: normal feeding control (NFC) and
high feeding (HF). NFC (n=35) group was fed Artemia nau-
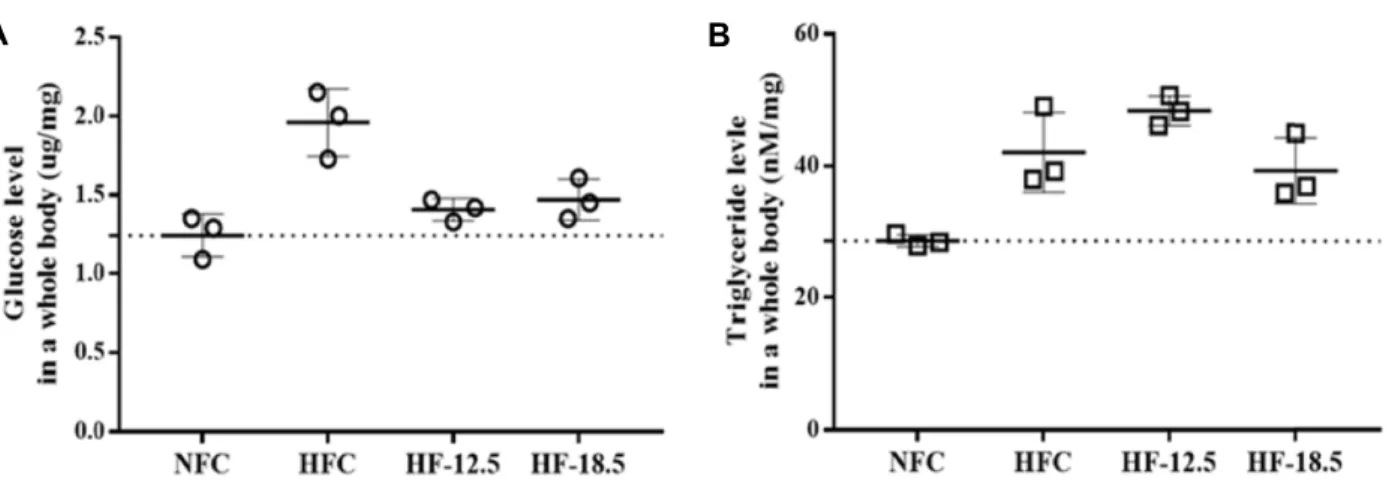
Table 1. Primers used for quantitative reverse transcription polymerase chain reaction (RT-PCR)
Gene Forward primer Reverse primer Reference
Myostatin Pax7 FoxO
Adiponectin B PPARγ PEPCK Insa GLUT2 β-actin
TGTGGTCCAGTGGGTTATGG ACCAGGCCAGAACTACCCAC
GGGAAACTATTCCTACGCCG TGCCTCGTCCTACCATTCAG CATCAACCTGGACCTGAACG AGATAGGGGTGGAGCTGACG CTGGTGCTCTGTTGGTCCTG
TTATCTACTTCCGTGTACC CACCACAGCCGAAAGAGAAA
AGAGGACGATGAACATGCCA CACCCGACGTTGAAAAGAGA GGCGTGCAGTATCAATGGAC GTGTGGCTGCAGGTCTATGG CAGACTCGCTGCAGCTCTTC CTAAAGAGGAGGGCTGGCTG
CTGCCACAAACCCTGCAG GATAATTGTGGAAGATGGTGC
CCTTCCTTCCTGGGTATGGA
AY258034 [37]
[39]
EU139314.1 NM_131467 NM_214751 NM_131056 DQ098687 NM_131031
plii three times daily in the following schedule: 8/larva (14-
17 dpf), 10/larva (18-19 dpf), 15/larva (20-21 dpf), 24/larva (22-25 dpf), 36/larva (26-29 dpf), 60/larva (30-32 dpf), and 90/larva (32-34 dpf). HF (n=120) group was fed six-fold of the NFC group at each stage to induce obesity. Zebrafish larvae were housed in a plastic tank (10×10×11 cm) with 20 larvae in 500 ml of filtered water sterilized by UV light.
After 10 days, the length of zebrafish larvae was measured from the head to the end of the body and the weight of individual zebrafish larva was measured. Then, zebrafish larvae in the HF group were randomly divided into three groups (n=40 in each group) and housed in plastic tanks (10×10×11 cm) with 500 ml water in each tank: HFC (high feeding control), HF-12.5, and HF-18.75. Each group was subjected to daily immersion bath treatment for 2 hr in water containing 0, 12.5, and 18.75 mg/l SLE, respectively. For the immersion treatment, the water in the tank was reduced to 100 ml with appropriate amounts of SLE, then after 2 hr, the tank was filled with water up to 500 ml. The final con- centration of DMSO did not exceed 1% during immersion, and DMSO is not toxic to zebrafish larvae at this concen- tration [17]. After 9 days of immersion treatment, all larvae were anesthetized using tricaine (Sigma, USA) and individ- ual body weight and length were measured and stored at -80℃ for later analysis.
Triglyceride and glucose assay in a whole body To measure the triglyceride concentration, the zebrafish larva was homogenized in 5% NP-40 in PBS (2 μl per mg body weight), centrifuged at 14,320x g for 5 min at 4℃, and the supernatant was collected and triglyceride concentration was determined using the Triglyceride quantification kit (Biovision, USA). To measure the glucose concentration, the zebrafish larva was homogenized in PBS (2 μl per mg body weight) and boiled for 5 min. The boiled extract was centri-
fuged at 14,320x g for 5 min at 4℃, and the supernatant was collected and glucose concentration was determined us- ing a glucometer (SD biosensor, Korea).
Quantitative reverse transcription polymerase chain reaction (qRT-PCR)
Total RNA was isolated using TRIzol reagents (Invitro-
gen, USA) according to the manufacturer’s instructions, fol-
lowed by reverse transcription using the Superscript III re-
verse transcriptase kit (Invitrogen, USA). Briefly, 3 μg of total
RNA was added to 1 μl of oligo(dT)
17and 1 μl of dNTP
mix and RNase free water was added to a total 13 μl. The
mixture was heated to 65℃ for 5 min followed by a quick
chill on ice. Then the mixture was added with 4 μl of 5X
First-Strand Buffer, 1 μl of 0.1 M DTT, 1 μl of RNaseOUT
recombinant RNase inhibitor, and 1 μl of SuperScript III
Reverse Transcriptase. The reaction mixture (20 μl) was in-
cubated at 50℃ for 60 min and the reaction was completed
by incubating at 95℃ for 5 min. For PCR amplification, one
μl of template cDNA (150 ng/μl) was mixed with 2.5 μl of
Pfu reaction buffer (10X), 0.5 μl of dNTP (10 mM each dATP,dCTP, dGTP, and dTTP), 1 μl of each primer (10 pmol/ul),
0.25 μl of Solg
TMPfu (2.5U/μl) and DNAse-free water was
added to a total 25 μl. PCR amplification was carried out
using the iCycler thermal cycler (Bio-rad, USA). The cycling
parameters were: denaturation at 94℃ for 2 min followed
by amplification for 30 cycles (94℃ for 20 sec, annealing tem-
perature for 40 sec, and 72℃ for 30 sec) and a final extension
at 72℃ for 5 min. β-actin gene expression was used as an
internal control to normalize the data in determining the rel-
ative expression of the target genes. PCR products were vi-
sualized by 1.5% agarose gel electrophoresis, photographed
and analyzed by Vilber Lourmat imaging system (Vilber
Luourmat, France). The primer sets for genes used in PCR
analysis are listed in Table 1.
A
B
Fig. 1. SLE has no cytotoxicity (A) and inhibits myostatin activ- ity (B). (A) SLE (50, 25, 5, and 1 μg/ml) was added to the L6 cells in 96 well plates, followed by incubation for 24 hr. Then, 10 μl of WST reagent was added into each well. After 1 hr, the plate was shaken for 1 min and absorbance was measured at 415 nm. The percentage of cell viability = {(the value of positive control well - the value of SLE well) / (the value of positive control well - the value of negative control well)} ×100. (B) Various concentrations of SLE in combination with 1 nM myo- statin, 1 nM Activin A, or 1 nM GDF11 were added to the HEK293 cells in 96 well plates, followed by in- cubation for 24 hr. After 24 hr, the medium was changed to serum-free DMEM, and luciferase activity was meas- ured using the Bright-Glo luciferase assay system (Promega, USA). Percentage of inhibition capability = (luminescence at 1 nM ligands - luminescence at each SLE concentration) ×100 / (luminescence at 1 nM ligands- luminescence at 0 nM ligands. The error bars indicate standard deviation (n=3).
Table 2. Yield and chemical composition of SLE extracts
Component SLE extract
Extraction yield (%)
Total polyphenolic content (mg/g) Carbohydrate (mg/g)
Protein (mg/g)
1.58 5.45 ± 0.01 2.45 ± 0.01 0.62 ± 0.01 The values are expressed as the mean ± standard error in tripli- cate experiments.
SLE, Ethanol extract of Scytosiphon lomentaria.
Statistical analyses
All results are expressed as means ± standard error (SE).
Significant differences among the group were determined by one-way ANOVA using the SPSS software (IBM SPSS Statistics, version 23.0, New York, USA). Duncan’s multiple range test was followed when differences were identified among the groups at p<0.05.
Results
Total polyphenolic, carbohydrate, and protein con- tents
The SLE’s total phenolic and protein, carbohydrate, and extraction yield was shown at Table 2. Extraction yield was 1.58%. Total polyphenolic, carbohydrate, and protein content are 5.45±0.01 mg/g, 2.45±0.01 mg/g, and 0.62±0.01 mg/g, respectively.
SLE suppresses myostatin activity
The cytotoxicity and myostatin-inhibitory capacity of SLE were examined using the WST assay and pGL3-(CAGA)
12- luciferase reporter assay, respectively. As shown in Fig. 1A, SLE did not show any cytotoxicity up to 50 μg/ml concen- tration of SLE. SLE demonstrated its capacity to suppress myostatin activity (Fig. 1B). The IC
50value of the extract for inhibition of 1 nM myostatin was 0.82 μg/ml. The inhibitory capacity of SLE to suppress myostatin was compared with those to suppress GDF11 and Activin A, molecules closely related to myostatin, using the luciferase reporter assay. The IC
50value for 1 nM Activin A was 2.35 μg/ml and the IC
50value for 1 nM GDF11 was not measureable, but the graph indicated that the potency of SLE to inhibit GDF11 is much lower than its capacity to suppress myostatin and Activin A (Fig. 1B).
SLE blocks myostatin-induced Smad2 phosphor- ylation
Myostatin binding to its receptor (ActRIIB) activates
type-1 activin receptor ALK4 or ALK5, leading to the phos-
phorylation of Smad2 and Smad3 to exert its signaling
process. So, we examined Smad2 phosphorylation in HepG2
cells treated with both MSTN and/or SLE. Smad2 phosphor-
Table 3. Effect of SLE on weight, length, and BMI of zebrafish larvae
Before immersion NFC (n=35) HFC (n=40) HF-12.5 (n=40) HF-18.75 (n=40)
Weight (mg) Length (mm) BMI (g/cm2)
1.95a±0.160 5.96a±0.15 0.0032a±0.0002
6.07b±0.506 8.36b±0.20 0.0069b±0.0004
5.03b±0.356 8.02b±0.15 0.0061b±0.0003
5.73b±0.477 8.12b±0.21 0.0067b±0.0004 After immersion
Weight (mg) Length (mm)
BMI (g/cm2)
4.20a±0.451 7.37a±0.20 0.0070a±0.0004
16.83b±1.461 11.00b±0.26 0.0127b±0.0005
11.82c±0.789 9.55c±0.19 0.0123bc±0.0004
9.89c±0.987 9.20c±0.30 0.0109c±0.0007 Values are means ± standard error.
Different letters are different at p<0.05.
NFC; Normal Feeding Control, HFC; High Feeding Control, HF-12.5; High Feeding and immersed with SLE (12.5 μg/ml), HF-18.75; High Feeding and immersed with SLE (18.75 μg/ml)
Fig. 2. SLE blocks myostatin-induced Smad2 phosphorylation in HepG2 cells. HepG2 cells were cultured in a serum- free DMEM for 4 hr, followed by treatment with a com- bination of 10 nM myostatin, 10 μM SB431542, 55 μg/
ml*, or 1.6 μg/ml** of SLE for 30 min. The blot is a repre- sentative of three independent assays and each blot has been sequentially probed with antibodies against phos- pho-Smad2 (p-Smad2), total Smad2 (Smad2), and β- actin. Densitometry analyses of the blots from three in- dependent assays. The relative phosphorylation level of p-Smad2 was normalized by the expression level of total Smad2. The error bars indicate standard deviation (n=3).
Different letters are different at p<0.001.
ylation was not observed in the control group without any treatment. On the other hand, Smad2 was phosphorylated in the group treated with 10 nM myostatin only. The myo- statin-induced phosphorylation of Smad2 was blocked in the group treated with 10 μM SB431542, an ALK5 inhibitor. The SLE suppressed the level of phosphorylated Smad2 induced by myostatin in a dose-dependent manner (55 μg/ml and 1.6 μg/ml) (Fig. 2). The current result, thus, suggests that
SLE blocks the binding of myostatin to its receptor.
SLE suppresses growth in diet-induced obese ze- brafish
14 dpf zebrafish larvae were divided into normal feeding (NFC) and high feeding (HF) groups and fed for 10 days.
HF group had significantly greater body weight (5.61±0.446 vs 1.95±0.160 mg) and size (8.17±0.020 vs 5.96±0.147 mm) as compared with the NFC group (Table 3). HF group was further divided into three groups (HFC, HF-12.5, and HF- 18.75), and HF-12.5 and HF-18.75 groups were immersed in 12.5 and 18.75 μg/ml of SLE, respectively, once daily for 9 days. HF group without immersion treatment of the SLE (HFC) had significantly greater body weight (16.83±1.461 vs 4.20±0.451 mg, 400%) and length (11.0±0.26 vs 7.4±0.20 mm, 149%) as compared to the NFC group. Body weights of the HF-12.5 (11.82±0.789 mg) and HF-18.75 (9.89±0.987 mg) were significantly lighter than that of the HFC (16.83±1.461 mg) and the body weight between the HF-12.5 and HF-18.75 was not statistically significant. The length of the HF-12.5 (9.6±
0.19 mm) and the HF-18.75 (9.2±0.30 mm) was also sig- nificantly shorter than that of the HFC (11.0±0.26 mm). The BMI values of the HF-18.75 group (0.0109±0.0007 g/cm
2) were significantly lower by 14.1% compared with that of the HFC group (0.0127±0.0005 g/cm
2), but the BMI value of the HF-12.5 group was not significantly different from that of the HFC group. Taken together, the SLE emersion appears to decrease the BMI value, leading the value closer to that of NFC (Table 3).
Effects of SLE on body glucose and triglyceride lev- els in diet-induced obese zebrafish
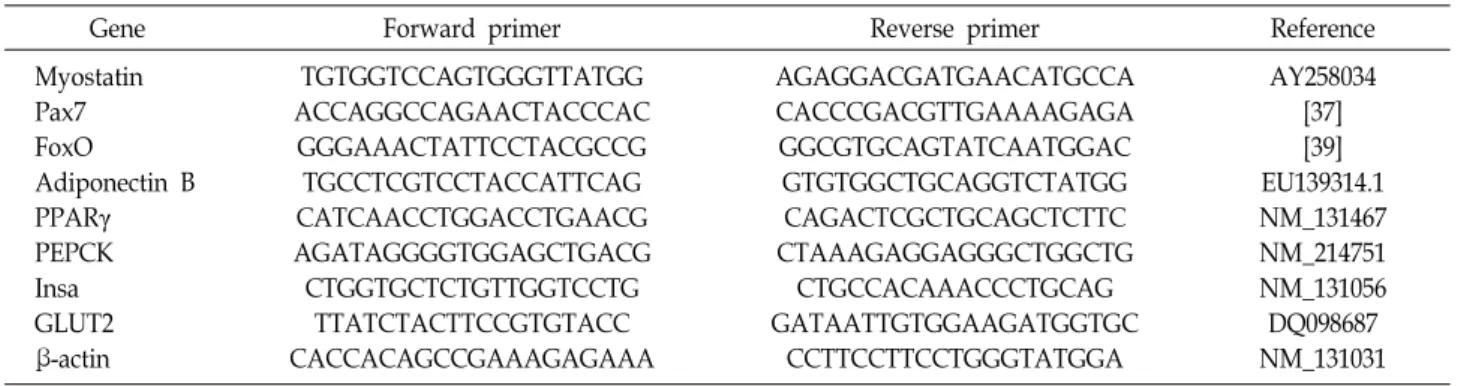
Fig. 3 summarizes the changes in glucose and triglyceride
A B
Fig. 3. Effect of SLE on glucose (A) and triglyceride (B) levels in zebrafish larvae. The zebrafish larvae were immersed with SLE for 2 hr/day for 9 days. Values are expressed as mean ± SE (n=3). Mean with different letters are significantly different at p<0.05.
levels in the whole body of zebrafish larvae treated with SLE. The whole body glucose concentration of the HF-12.5 and HF-18.75 groups was significantly lower by 28.0% (1.40±
0.071 ug/ml) and 25.0% (1.47±0.131 ug/ml), respectively, compared with the HFC group (1.96±0.213 ug/ml). The glu- cose levels of HF-12.5 and HF-18.75 were similar to that of NFC, suggesting that SLE is capable of regulating glucose levels in zebrafish larvae. However, triglyceride levels in HFC, HF-12.5, and HF-18.75 groups were not significantly different from the NFC group.
Effects of SLE on gene expression levels in diet-in- duced obese zebrafish
Fig. 4 summarize the effect of SLE on the expression of myogenesis-related (myostatin, Pax7, and FoxO), obesity-re- lated (Adiponectin B, PPARγ and PEPCK), and diabetes-re- lated genes (Insa and GLUT2) in zebrafish larvae. The mRNA expression level of the GLUT2 gene of the HFC group was significantly lower than that of the NFC group, and SLE treatment restored the expression of GLUT2 gene to the level close to that of the NFC group. The expressions of myostatin,
Pax7, FoxO, Adiponectin B, PPARγ, PEPCK, and Insa geneswere not affected by the high feeding, and SLE treatment also did not affect the expression of those genes in the obese zebrafish induced by high feeding.
Discussion
This study first reports the myostatin inhibitory effect of the SLE in an in vitro luciferase assay system using HEK293 cells. The myostatin-inhibitory capacity of SLE measured by
pGL-(CAGA)
12luciferase reporter gene assay was further confirmed by SLE’s inhibition of myostatin-induced Smad2 phosphorylation, a critical component of the canonical myo- statin signaling pathway. Myostatin is a member of the TGF- β (transforming growth factor β) superfamily of growth and differentiation factors, and functions as a negative regulator of skeletal muscle [27]. Natural mutations of the myostatin gene in bovines, such as Belgian blue and Piedomontese, increased muscle mass over normal bovine. In addition, mu- tations of the myostatin gene in mice resulted in a dramatic increase in muscle mass through muscle fiber hyperplasia and hypertrophy [14, 20, 27]. Fish myostatin is very similar to mammalian myostatin in function and structure, but its tissue-specific expression patterns and level are different [29]. Myostatin knock-down zebrafish through an RNAi ap- proach increased somite size and upregulation of the myo- genic regulatory factor [1]. Furthermore, in zebrafish, over- expression or dominant negative approach of myostatin- prodomain, a myostatin suppressor, significantly increased muscle fiber number [13, 40]. These studies together indicate that fish myostatin suppression is a potential strategy to im- prove muscle mass in fish.
Studies have shown that overexpression of myostatin pro- peptide, a myostatin antagonist, prevented diet-induced obe- sity and insulin resistance in mice [41]. Overexpression of follistatin, another myostatin antagonist, preserved β-cell function in db/db mice by enhancing the proliferation of pancreatic β-cell [42]. These studies indicate that myostatin plays a role not only in the regulation of muscle mass but also in the regulation of fat mass and energy metabolism.
Since SLE demonstrated myostatin inhibitory capacity in vi-
Fig. 4. Effect of SLE on the expression of myogenesis-related (myostatin, Pax7, and FoxO), obesity-related (Adiponectin B, PPARγ and PEPCK), and diabetes-related genes (Insa and GLUT2) in zebrafish larvae. The Y-axis shows gene expression levels nomalized by β-actin gene expression. Values are expressed as means ± SE (n=3). *, significantly different at p<0.05, NFC;
Normal Feeding Control, HFC; High Feeding Control without any immersion, HF-12.5; High Feeding and immerse with the SLE (12.5 μg/ml), HF-18.75; High Feeding and immerse with the SLE (18.75 μg/ml).
tro, this study examined the effects of SLE treatment on body mass and energy metabolism in obese zebrafish induced by high feeding. The body weight and glucose level of obese zebrafish in HF-12.5 and HF-18.75 groups treated with the SLE were lowered than those of the HFC group. High feed- ing increased both the body glucose and triglyceride concen- trations and SLE treatment prevented the increase in body glucose concentration but not the triglyceride concentration, suggesting that SLE improved glucose utilization but did not suppress triglyceride accretion in the body. GLUT2, a glu- cose transporter across the membrane, plays an essential role in maintaining glucose homeostasis in mammals and was predominantly expressed in the liver, pancreas, small intes- tine, and kidney [36]. In zebrafish, the GLUT2 gene consists
of 11 exons and 10 introns and is expressed in testis, brain,
skin, kidney, and intestine. Its mRNA level in the intestine
is altered by fasting and refeeding, suggesting that GLUT2
mRNA expression in zebrafish may be regulated by the glu-
cose level [7]. In this study, in parallel to the changes in
body glucose concentration during treatment, the mRNA
level of the GLUT2 was lower in the high feeding group
(HFC) than in the normal feeding group (NFC). Further-
more, SLE treatment increased the mRNA expression of the
GLUT2, supporting that SLE improved the glucose homeo-
stasis in obese zebrafish. Even though the Ins a and PEPCK
genes also play a role in glucose homeostasis, these genes
were not affected by the treatment. A previous study, how-
ever, showed a down regulation of PEPCK expression in ze-
brafish (2 dpf) injected directly with glucose [33]. In adult zebrafish, the PEPCK expression was reduced by high-carbo- hydrate fed for 16 weeks [11]. Of note, it is not clear whether the increase in GLUT2 mRNA expression by SLE treatment is related to the capacity of SLE to suppress myostatin activ- ity or other compounds present in SLE since we did not measure any makers related to myostatin signaling in the zebrafish treated with SLE. Thus, more studies are needed to investigate whether SLE immersion in fish is able to regu- late myostatin activity for a clear understanding of the po- tential role of SLE in treating metabolic syndrome.
In conclusion, this study showed that the ethanol extract of S. lomentaria (SLE) suppressed MSTN activity in vitro. SLE treatment of obese zebrafish induced by high feeding pre- vented the increase in whole body glucose concentration ac- companied by an increase in the GLUT2 gene expression.
Current results, thus, demonstrate the potential of SLE as a natural MSTN-inhibitor and natural supplement to help the treatment of the metabolic syndrome.
Acknowledgement
This research was a part of the project titled “Develop- ment of Aging-friendly health agents to overcome Sarcope- nia based on Marine-Bio resources” funded by the Ministry of Oceans and Fisheries, Korea (No. 20190033).
The Conflict of Interest Statement
The authors declare that they have no conflicts of interest with the contents of this article.
References
1. Amali, A. A., Lin, C. J., Chen, Y., Wang, W. L., Gong, H.
Y., Lee, C. Y., Ko, Y. L., Lu, J. K., Her, G. M., Chen, T.
T. and Wu, J. L. 2004. Up-regulation of muscle-specific tran- scription factors during embryonic somitogenesis of zebra- fish (Danio rerio) by knock-down of myostatin-1. Dev. Dyn.
229, 847-856.
2. Bonaldo, P. and Sandri, M. 2013. Cellular and molecular mechanisms of muscle atrophy. Dis. Model. Mech. 6, 25-39.
3. Bowen, T. S., Schuler, G. and Adams, V. 2015. Skeletal mus- cle wasting in cachexia and sarcopenia: molecular patho- physiology and impact of exercise training. J. Cachexia Sarcopenia Muscle 6, 197-207.
4. Braun, T. and Gautel, M. 2011. Transcriptional mechanisms regulating skeletal muscle differentiation, growth and ho- meostasis. Nat. Rev. Mol. Cell. Biol. 12, 349-361.
5. Capiott, K .M., Antonioli, R., Kist, L. W., Bogo, M. R., Bonan, C. D. and Da Silva, R. S. 2014. Persistent impaired glucose metabolism in a zebrafish hyperglycemia model. Comp.
Biochem. Physiol. B Biochem. Mol. Biol. 171, 58-65.
6. Cash, J. N., Angerman, E. B., Kattamuri, C., Nolan, K., Zhao, H., Sidis, Y., Keutmann, H. T. and Thompson, T. B. 2012.
Structure of myostatin: follistatinlike 3: N-terminal domains of follistatin-type molecules exhibit alternate modes of binding. J. Biol. Chem. 287, 1043-1053.
7. Castillo, J., Crespo, D., Capilla, E., Diaz, M., Chauvigne, F., Cerda, J. and Planas, J. V. 2009. Evolutionary structural and functional conservation of an ortholog of the GLUT2 glucose transporter gene (SLC2A2) in zebrafish. Am. J. Physiol. Regul.
Integr. Comp. Physiol. 297, R1570-R1581.
8. Demirel, Z., Yilmaz-Koz, F. F., Karabay-Yavasoglu, U. N., Ozdemir, G. and Sukatar, A. 2009. Antimicrobial and anti- oxidant activity of brown algae from the aegean sea. J. Serb.
Chem. Soc. 74, 619-628.
9. Ding, Y., Kim, S. H., Lee, J. J., Hong, J. T., Kim, E. A., Kang, D. H., Heo, S. J. and Lee, S. H. 2019. Anti-melanogenesis activity of Ecklonia cava extract cultured in tanks with mag- ma seawater of Jeju Island. Algae 34, 177-185.
10. Elo, B., Villano, C. M., Govorko, D. and White, L. A. 2007.
Larval zebrafish as a model for glucose metabolism: Expres- sion of phosphoenolpyruvate carboxykinase as a marker for exposure to anti-diabetic compounds. J. Mol. Endocrinol. 38, 433-440.
11. Fang, L., Liang, X., Zhou, Y., Guo, X., He, Y., Yi, T., Li, L., Yuan, X. and Tao, Y. 2014. Programming effects of high-carbohydrate feeding of larvae on adult glucose metab- olism in zebrafish, Danio rerio. Br. J. Nutr. 111, 808-818.
12. Fanzani, A., Caonraads, V. M., Penna, F. and Martinet, W.
2012. Molecular and cellular mechanisms of skeletal muscle atrophy : an update. J. Cachexia Sarcomenia Muscle 3, 163-179.
13. Fuentes, E. N., Pino, K., Navarro, C., Delgado, I., Valdés, J. A. and Molina, A. 2013. Transient inactivation of myo- statin induces muscle hypertrophy and overcompensatory growth in zebrafish via inactivation of the SMAD signaling pathway. J. Biotechnol. 168, 295-302.
14. Grobet, L., Martin, L. R., Poncelet, D., Pirottin, D., Brouwers, B., Riquet, J., Schoeberlein, A., Dunner, S., Menissier, F., Massabanda, J., Fries, R., Hanset, R. and Georges, M. 1997.
A deletion in the bovine myostatin gene causes the dou- ble-muscled phenotype in cattle. Nat. Genet. 17, 71-74.
15. Grundy, S. M. 2008. Metabolic syndrome pandemic. Arter- ioscler Thromb. Vasc. Biol. 28, 629-636.
16. Grundy, S. M. 2016. Metabolic syndrome update. Trends Cardiovasc. Med. 26, 364-373.
17. Hallare, A., Nagel, K., Kohler, H-R. and Triebskorn, R. 2006.
Comparative embryotoxicity and proteotxoicity of three car- rier solvents to zebrafish (Danio rerio) embryos. Ecotoxicol.
Environ. Saf. 63, 378-388.
18. Hasumura, T., Shimada, Y., Kuroyanagi, J., Nishimura, Y., Meguro, S. and Takema, Y. 2012. Green tea extract sup- presses adiposity and affects the expression of lipid metabo- lism genes in diet-induced obese zebrafish. Nutr. Metab.
(Lond) 9, 1-7.
19. Kalyani, R. R., Corriere, M. and Ferrucci, L. 2014. Age-re- lated and disease-related muscle loss: The effect of diabetes, obesity, and other diseases. Lancet Diabetes Endocrinol. 2, 819- 829.
20. Kambadur, R., Sharma, M., Smith, T. P. and Bass, J. J. 1997.
Mutations in myostatin (GDF8) in double-muscled belgian blue and piedmontese cattle. Genome Res. 7, 910-916.
21. Kim, S. C., Park, S. Y., Hyoun, J. H., Cho, H., Kang, J. H., Lee, Y. K., Park, D. B., Yoo, E. S. and Kang, H. K. 2004.
The cytotoxicity of Scytosiphon lomentaria against HL-60 pro- myelocytic leukemia cells. Cancer Biother. Radiopharm. 19, 641-648.
22. Kuda, T., Tsunekawa, M., Hishi, T. and Araki, Y. 2005.
Antioxidant properties of dried kayamo-nori, a brown alga Scytosiphon lomentaria (Scytosiphonales, Phaeophyceae). Food Chem. 89, 617-622.
23. Lee, S. J. 2004. Regulation of muscle mass by myostatin.
Ann. Rev. Cell Dev. Biol. 20, 61-86.
24. Lee, S. B., Park, S. K. and Kim, Y. S. 2015. Production of bioactive chicken (Gallus gallus) follistatin-type proteins in E. coli. AMB Expr. 5, 142.
25. Maddison, L. A., Joest, K. E., Kammeyer, R. M. and Chen, W. 2015. Skeletal muscle insulin resistance in zebrafish in- duces alterations in beta-cell number and glucose tolerance in an age- and diet-dependent manner. Am. J. Physiol. Endoc- rinol. Metab. 308, E662-E669.
26. Manceau, M., Gros, J., Savage, K., Thome, V., McPherron, A., Paterson, B. and Marcelle, C. 2008. Myostatin promotes the terminal differentiation of embryonic muscle progeni- tors. Genes Dev. 22, 668-681.
27. McPherron, A. C. and Lee, S. J. 1997. Double muscling in cattle due to mutations in the myostatin gene. Proc. Natl.
Acad. Sci. USA. 94, 12457-12461.
28. Narici, M. V. and Maffulli, N. 2010. Sarcopenia: Characteris- tics, mechanisms and functional significance. Br. Med. Bull.
95, 139-159.
29. Østbye, T. K., Wetten, O. F., Tooming-Klunderud ,A., Jakobsen, K. S., Yafe, A., Etzioni, S., Moen, T. and Andersen, O. 2007. Myostatin (MSTN) gene duplications in atlantic sal- mon (Salmo salar): Evidence for different selective pressure on teleost MSTN-1 and-2. Gene 403, 159-169.
30. Park, M. H., Kim, S., Cheon, J., Lee, J., Kim, B. K., Lee, S., Kong, C., Kim, Y. Y. and Kim, M. 2016. Effects of Scytosiphon lomentaria on osteoblastic proliferation and differentiation of MC3T3-E1 cells. Nutr. Res. Pract. 10, 148-153.
31. Parng, C., Seng, W. L., Semino, C. and McGrath, P. 2002.
Zebrafish: A preclinical model for drug screening. Assay Drug Dev. Technol. 1, 41-48.
32. Ponce, N. M. A., Flores, M. L., Pujol, C. A., Becerra, M. B., Navarro, D. A., Cordoba, O., Damonte, E. B. and Stortz, C. A. 2019. Fucoidans from the phaeophyta Scytosiphon lo- mentaria: Chemical analysis and antiviral activity of the gal- actofucan component. Carbohydrate Res. 478, 18-24.
33. Rocha, F., Dias, J., Engrola, S., Gavaia, P., Geurden, I., Dinis, M. T. and Panserat, S. 2014. Glucose overload in yolk has little effect on the long-term modulation of carbohydrate metabolic genes in zebrafish (Danio rerio). J. Exp. Biol. 217, 1139-1149.
34. Rocha, F., Dias, J., Engrola, S., Gavaia, P., Geurden, I., Dinis, M. T. and Panserat, S. 2015. Glucose metabolism and gene expression in juvenile zebrafish (Danio rerio) challenged with a high carbohydrate diet: Effects of an acute glucose stimulus during late embryonic life. Br. J. Nutr. 113, 403-413.
35. Thomas, M., Langley, B., Berry, C., Sharma, M., Kirk, S., Bass, J. and Kambadur, R. 2000. Myostatin, a negative regu- lator of muscle growth, functions by inhibiting myoblast proliferation. J. Biol. Chem. 275, 40235-40243.
36. Thorens, B., Sarkar, H. K., Kaback, H. R. and Lodish, H.
F. 1988. Cloning and functional expression in bacteria of a novel glucose transporter present in liver, intestine, kidney, and β-pancreatic islet cells. Cell 55, 281-290.
37. Seo, H. C., Saetre, B. O., Håvik, B., Ellingsen, S. and Fjose, A. 1998. The zebrafish Pax3 and Pax7 homologues are high- ly conserved, encode multiple isoforms and show dynamic segment-like expression in the developing brain. Mech. Dev.
70, 49-63.
38. Vascotto, S. G., Beckham, Y. and Kelly, G. M. 1997. The ze- brafish's swim to fame as an experimental model in biology.
Biochem. Cell Biol. 75, 479-485.
39. Xie, X. W., Liu, J. X., Hu, B. and Xiao, W. 2011. Zebrafish foxo3b negatively regulates canonical Wnt signaling to af- fect early embryogenesis. PloS One 6, e24469.
40. Xu, C., Wu, G., Zohar, Y. and Du, S. 2003. Analysis of myo- statin gene structure, expression and function in zebrafish.
J. Exp. Biol. 206, 4067-4079.
41. Zhao, B., Wall, R. J. and Yang, J. 2005. Transgenic expression of myostatin propeptide prevents diet-induced obesity and insulin resistance. Biochem. Biophys. Res. Commun. 337, 248- 255.
42. Zhao, C., Qiao, C., Tang, R., Jiang, J., Li, J., Martin, C. B., Bulaklak, K., Li, J., Wang, D. W. and Xiao, X. 2015. Over- coming insulin insufficiency by forced follistatin expression in β-cells of db/db mice. Mol. Ther. 23, 866-874.
초록:고리매( Scytosiphon lomentaria ) 에탄올 추출물이 마이오스타틴 활성과 고 급식으로 유도된 비만 제브라피쉬에 미치는 영향
정준교
1․김재홍
1․김정환
1,3․김용수
2․진덕희
1․진형주
1*
(1강릉원주대학교 해양분자생명과학과, 2미국 하와이주립대학교 동물과학과, 3㈜샤페론)