Eugene Lee, Moonho Son, Jeong Bea Kim, Won Chan Lee, Ga Eun Jeon and Sang Heon Lee
62Korean J. Environ. Biol. 36(1) : 62~72(2018) https://doi.org/10.11626/KJEB.2018.36.1.062
* Corresponding author: Moonho Son, Tel. 061-690-8963, Fax. 061-686-1588, E-mail. [email protected]
ⓒ2018. Korean Society of Environmental Biology.
UPLC 를 이용한 남해 진주만 식물플랑크톤 군집 변동특성 연구
이유 진 · 손 문호
*
· 김정배1· 이원찬 · 전가 은1· 이상헌2 국립수 산과학원 남해수 산연구소, 1국립수 산과학원 어장환경과2부 산대학교 해양 학과
A Study of Variation Characteristics of the Phytoplankton Community by UPLC Located in the Jinju Bay, Korea
Eugene Lee, Moonho Son*, Jeong Bea Kim
1, Won Chan Lee, Ga Eun Jeon
1and Sang Heon Lee
2SSFRI, National Institute of Fishery Science, Yeosu 58780, Republic of Korea
1
Marine Environment Research Division, National Institute of Fishery Science, Busan 46083, Republic of Korea
2
Department of Oceanography, College of Natural Science, Pusan National University, Busan 46241, Republic of Korea
Abstract - In order to provide important information for the efficient management of the identified farm ecosystem in Jinju Bay, we investigated the spatial and temporal distribution of the phytoplankton community using a UPLC pigment analysis and a CHEMTAX program from the timeframe of February 2013 to January 2014. In addition, we measured the available physical and chemical parameters controlling the distribution of the phytoplankton communities. As a result of this comprehensive pigment analysis, it was noted that the Diatoms were the predominant species with an average of 77.1% as noted located in Jinju Bay. It was discovered that during the summer season, the phytoplankton community composition was changed by a reduction of diatoms and noted increases of the Cryptophytes, Prasinophytes, and Dinoflagellates. Especially, it was noted that the Cryptophytes and Prasinophytes were shown with an average of 18.8% and 17.8% in June, respectively. However, it was revealed that the Cryptophytes and Prasinophytes were not shown by a microscopic observation. The phytoplankton community composition was correlated with the temperature and salinity variations as noticed in the Jinju Bay. Therefore, the water temperature and freshwater inputs in the Jinju Bay were important environmental factors for controlling the phytoplankton community composition and the varying Cryptophytes and the noted amounts of Prasinophytes as well.
Keywords : Jinju Bay in South sea, phytoplankton community, pigment analysis, environmental factor
<Original article>
서 론
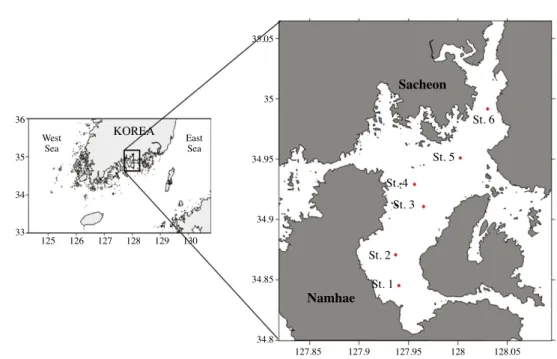
진주만은 경남 남해도와 창선도, 사천시, 하동군으로 둘 러싸여 있는 반 폐쇄성 내만으로, 남북 18km, 동서 15km 에 달하며 평균수심 7.5m이다. 해저지형은 남쪽에서 북쪽으 로 개방되어 있는 만을 따라 완만한 해저경사를 이루고 있 으며, 조간대가 약 25%를 차지하고 매우 복잡한 해저지형을 가지고 있으며 남해 본도보다는 창선도에 가까울수록 깊다. 북서쪽에 노량해협, 북동쪽에 대방수로(삼천포수로) 및 남동 쪽에 창선해협과 연결되어 있어 광양만 및 남해 외해로부터 해수 교환이 일어난다(Kim et al. 2010). 만의 상류부는 사천 시의 생활하수가 유입되며, 하계 대량 강우 시 진양호 방류 수의 영향을 받는다(Oh et al. 2008). 또한 진주만은 총 156 건에 면적 912 ha의 어업이 허가되어 있고, 양식어업은 피조 개 양식(83건, 469ha)이 가장 많고, 새꼬막(50건, 307ha), 굴 (23건, 136ha) 등 패류양식 어장이 밀집되어 있는 환경으로 다양한 생물군에 의하여 복잡한 먹이망 구조를 이루고 있다 (Park et al. 2010). 이러한 연안 어장 생태계에서의 건강성을 유지하고 높은 생산성과 회복성을 유지시키는 것은 매우 중 요하며, 이를 위한 체계적인 모니터링 시스템 구축이 필요하 다.
해양생태계의 먹이망에서 식물플랑크톤은 일차 생산자로 서 동물플랑크톤과 양식생물 등 고차소비자에게 에너지를 제공하는 역할을 한다. 식물플랑크톤의 생물량 및 군집 조 성은 물리, 화학적인 환경요인의 영향에 의해 뚜렷한 변화 를 보이기 때문에(James 1979), 식물플랑크톤의 군집구조와 특징을 파악하여 해역의 특성을 평가하고(Raymont 1980;
Lee et al. 2014), 해양 생태계의 구조와 기능을 이해하는 데 중요한 자료로 이용이 된다. 식물플랑크톤 군집에 대한 연 구는 식물플랑크톤의 생물량을 파악하기 위해 분광광도법 (Spectrophotomertry)이나 형광법(Fluorometry) 등을 이용 해 식물플랑크톤의 주 광합성 색소인 Chlorophyll a의 농도 를 측정하거나(Bowles et al. 1985), 현미경을 통한 직접적인 관찰을 이용해 왔다. 그러나 이러한 연구방법은 Chlorophyll a의 분해산물들이 함께 측정이 되어 과대평가가 되거나 (Welschmeyer 1994), 현미경 관찰로는 확인하기 어려운 초 미세 플랑크톤에 의해 과소평가가 되는 등의 문제점들이 존 재하였다. 이를 보완하기 위해 고성능 액체크로마토그래피 (High Performance Liquid Chromatography; HPLC)를 이 용하여 혼합색소를 단일색소로 분리 후 정량·정성 분석하 는 방법이 이용되고 있다(Wright et al. 1991; Zapata et al.
2000). UPLC(Ultra Performance Liquid Chromatography)는 HPLC보다 향상된 분석기기로 고압의 조건에서 분석을 시 행하기 때문에 분리능이 증가하고 해상도 및 감도 역시 크
게 향상되었다. 또한 HPLC 컬럼에 비해 다양한 유속을 가 질 수 있으며, 이로 인해 분석 시간이 단축이 되고 적은 양 의 이동상을 소모하기 때문에 분석 효율이 높다(De Villiers et al. 2007; Kim et al. 2014). HPLC와 UPLC의 동시분석 조 건을 설정하고 진행하였을 때, 두 방법 모두 시료를 정량 분 석하는데 유용하였지만, UPLC 방법이 더 빠르고 높은 감도 를 나타냈으며, 짧은 시간 내에 더 많은 샘플분석에 용이하 다(Guillarme et al. 2007).
따라서 본 연구는 진주만 어장생태계의 효율적인 관리를 위해 HPLC를 이용한 식물플랑크톤 색소 분석 방법(Wright et al. 1991)을 UPLC와 컬럼의 조건에 맞추어 전환하여 진 주만의 식물플랑크톤 생물량 및 군집구조를 파악하고 식물 플랑크톤 군집변화에 영향을 미치는 환경 특성을 파악하여 기초적인 정보를 제공하고자 한다.
재료 및 방법 1. 연구지역 및 해양환경요인 조사
진주만 해역의 시공간적이 환경특성을 분석하기 위해 진 주만의 남북을 가로지르는 6개 정점을 선정하여 2013년 2월 부터 2014년 1월까지 매월 1회 현장조사를 실시하였다(Fig.
1). 해수의 수온과 염분, 용존산소는 현장에서 CTD(Sea bird 19, USA)와 다기능 수질측정기(YSI-6100, USA)를 이용하 여 측정하였고, 영양염류와 식물플랑크톤 색소 분석을 위해 표층에서 Niskin 채수기를 이용하여 채수하였다. 영양염류 는 해양환경공정시험법(국토해양부 2010)에 따라 영양염 자 동분석기(Auto analyzer, Quaatro, Germany)를 이용해 용존 무기질소(Dissolved Inorganic Nitrogen; DIN), 용존무기인 (Dissolved Inorganic Phosphate; DIP), 규산규소(SiO2-Si)를 측정하였다.
2. 식물플랑크톤 색소 분석
식물플랑크톤의 색소 분석을 위해 현장에서 채수한 해수 를 47mm GF/F 여과지를 이용해 여과한 후 알루미늄 호일 로 차광을 한 후 냉동 보관하여 실험실로 운반하였다. 냉동 보관된 여과지를 10mL culture tube에 넣고 100% 아세톤을 5mL 첨가한 후 분쇄 시 손실을 보정하기 위하여 내부 표준 물질 Canthaxanthin을 50 μL 첨가하였다. 초음파 분쇄를 5분 간 실시한 후 4°C 이하의 냉암소에서 24시간 추출하였고, 추 출 시간 내에 분쇄기를 이용하여 여과지를 분쇄하였다. 추출 후 원심분리기를 이용해 2000rpm으로 10분간 원심분리 시
킨 후 상등액 1mL를 취하여 HPLC용 H2O 300μL와 섞은 후 UPLC(Ultra Performance Liquid Chromatography)를 이 용해 색소 분석을 실시하였다.
분석기기는 ACQUITY UPLC H-Class(Water Corp., Milford, MA, USA) 를 사용하였고, 컬럼은 Waters HSS C18 (1.8 μm particle size, i.d. 2.1×100mm, Waters Crop.)를 사 용하였다. 용매의 method는 ACQUITY UPLC Columns Calculator 프로그램을 이용해 HPLC에서 이용했던 gradient (Wright et al. 1991)를 새로운 컬럼의 조건에 맞추어 계산하 여 전환하였다(Table 1). 용매의 gradient가 성공적으로 모든 색소를 분리할 수 있는 최적의 조건을 찾기 위해 DHI사에서 구입한 표준색소 Chlorophyll 계열 3개(Chlorophyll a, b, c2), Chlorophyll a의 분해산물인 Pheophytin a, Chlorophyllide a, 보조색소인 Carotenoids 계열(Peridinin, 19-but-fucoxanthin, Fucoxanthin, Neoxanthin, Prasinoxanthin, Violaxanthin, 19-Hex-fucoxanthin, Diadinoxanthin, Alloxanthin, Diatoxan- thin, Lutein, Zeaxanthin, Beta-carotene) 총 18가지를 이용 하여 calibration하였다(Table 1). 분석 조건은 다음과 같다.
System: ACQUITY UPLC H-Class(Water Corp., Milford, MA, USA)
Column: Waters HSS C18(1.8μm, 2.1×100mm) Column temperature: 25°C
Solvent A: MeOH : AmAc : BHT(80:20:0.01 v:v:v) Solvent B: ACN : Water : BHT(87.5:12.8:0.01 v:v:v) Solvent C: Ethyl Acetate 100%
(AmAc: Ammonium Acetate, ACN: Acetonitrile, BHT:
Butylated Hydrox Toluen) Flow rate: 0.35mL min-1 Run time: 11min Injection volume: 10μL
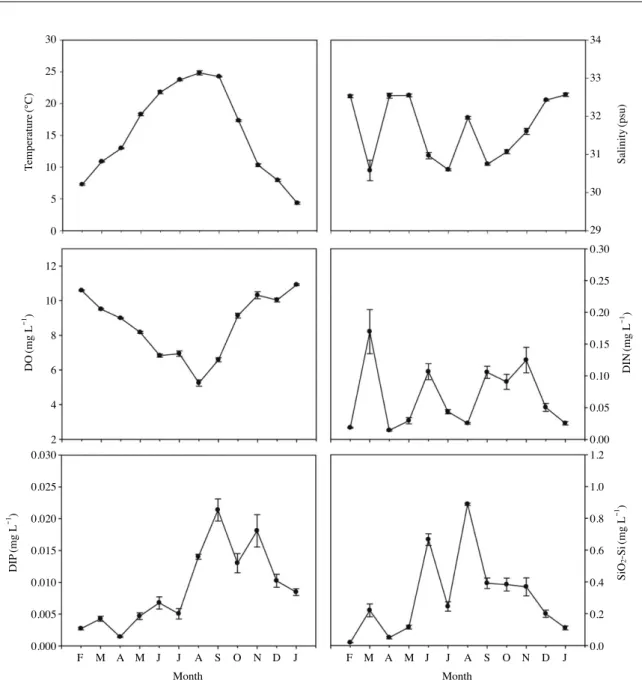
위의 방법을 이용해 표준 색소의 Retention time을 결정 하였고, UPLC PDA(Photo Diode Array) Detector를 이용 해 표준 색소의 흡광도를 측정하여 기존에 알려진 흡광계수 (Jeffrey et al. 1997)를 이용해 보정한 뒤(Table 2), Response factor(Rf)를 계산하였다. 샘플에서 분석된 색소의 농도는 다 음 식에 의하여 계산되었다(Park and Park 1997).
Concentration[ng L-1]=Area×Rf×(Ve/Vs) Rf[ng L-1 Area-1]=standard response factor
Ve[L]=(AIS/peak area of IS added)×(volume of IS added to
36 35 34 33
35.05
35
34.95
34.9
34.85
34.8 125 126 127 128 129 130
127.85 127.9 127.95 128 128.05
St. 5 St. 6
St. 4 St. 3
St. 2 St. 1
WestSea East
Sea
KOREA
Sacheon
Namhae
Fig. 1. Map showing the study area and sampling stations in Jinju Bay.
Table 1. Solvent Gradient of UPLC.
Time Flow
(mL min-1) Solvent A
(%) Solvent B
(%) Solvent C (%)
Initial 0.35 90 10 0
0.2 0.35 0 100 0
2.5 0.35 0 90 10
4 0.35 0 85 15
5 0.35 0 77 23
6 0.35 0 60 40
7 0.35 0 30 70
8 0.35 0 10 90
9 0.35 90 10 0
11 0.35 90 10 0
sample)
AIS: peak area of the internal standard(IS) when 1mL IS is mixed with 300μL of H2O
Vs[L]=volume of filtered water sample
3. CHEMTAX Program
1996년 Mackey 등에 의해 개발된 CHEMTAX program은 해수 샘플의 광합성 색소 분석 결과를 이용해 식물플랑크 톤 군집이 가지고 있는 지시색소(Marker pigment)의 상대적 인 비 값을 산정하여 Chlorophyll a 값에 대한 군집별 기여 도를 추정하는 프로그램이다(Table 3). 기존 CHEMTAX 연 구 결과에 기초하여 8개의 식물플랑크톤 그룹이 선택되었고 (Furuya et al. 2003; Zhu et al. 2009) 이는 규조류(Diatoms),
와편모류(Dinoflagellates), 은편모류(Cryptophytes), 담녹조 류(Prasinophytes), 녹조류(Chlorophytes), 착편모류(Hapto_
N, Haptophytes), 황갈조류(Hapto_S, Chrysophytes), 남조류 (Cyanobacteria)이다. CHEMTAX program을 이용한 연구에 서는 현미경 관찰로 얻을 수 있는 식물플랑크톤의 정량·정 성 분석에 있어서의 단점을 보완할 수가 있지만 대부분 입 력된 색소 비율에 의한 결과에 전적으로 의존하기 때문에 연구해역의 특성과 환경에 의한 식물플랑크톤 색소 비율의 차이에 의한 오류가 존재한다. 이러한 오차를 줄이고 신뢰도 를 판단하기 위해 현미경 분석 결과와 비교를 통한 고찰이 필요하여(Mackey et al. 1996; Lee et al. 2011), 동기간 진주 만에서 연구 수행한 국립수산과학원 ‘연안어장생태계 통합 평가 및 관리연구 보고서(2013, 2014)의 식물플랑크톤 결과 를 활용하여 본 연구와 비교하였다.
4. 통계분석
본 연구해역에서의 물리, 화학적인 요인들과 주요 식물플 랑크톤 군집과의 상관성을 알아보기 위하여 Pearson’s cor- relation을 실시하였다(PASW statistics 18).
결과 및 고찰
1. 환경요인
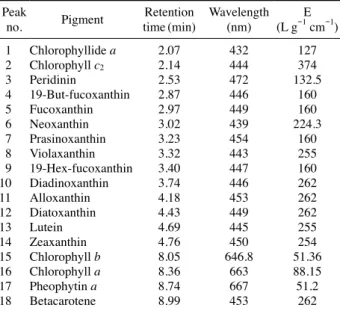
본 연구해역인 진주만의 수온은 평균 15.3°C(2.8~
27.1°C)로, 8월 평균 24.8°C(22.8~25.0°C)로 가장 높게 나 타났고, 1월(2014년) 평균 4.3°C(2.8~5.4°C)로 가장 낮게 나타났다(Fig. 2).
염분은 평균 31.7psu(27.9~32.9psu)로, 1월(2014년) 평 균 32.6psu(32.1~32.8psu)로 가장 높게 나타났고, 7월 평균 30.6psu(30.3~30.8psu)로 가장 낮게 나타났다(Fig. 2). 상관 Table 2. List of pigments obtained, with the corresponding reten-
tion time, absorption maxima wavelength in the eluent and extinction coefficients(E).
Peak
no. Pigment Retention
time(min) Wavelength
(nm) E
(L g-1 cm-1)
1 Chlorophyllide a 2.07 432 127
2 Chlorophyll c2 2.14 444 374
3 Peridinin 2.53 472 132.5
4 19-But-fucoxanthin 2.87 446 160
5 Fucoxanthin 2.97 449 160
6 Neoxanthin 3.02 439 224.3
7 Prasinoxanthin 3.23 454 160
8 Violaxanthin 3.32 443 255
9 19-Hex-fucoxanthin 3.40 447 160
10 Diadinoxanthin 3.74 446 262
11 Alloxanthin 4.18 453 262
12 Diatoxanthin 4.43 449 262
13 Lutein 4.69 445 255
14 Zeaxanthin 4.76 450 254
15 Chlorophyll b 8.05 646.8 51.36
16 Chlorophyll a 8.36 663 88.15
17 Pheophytin a 8.74 667 51.2
18 Betacarotene 8.99 453 262
Table 3. Initial pigment: Chl-a ratios for eight algal groups in CHEMTAX analysis(Mackey et al. 1996).
Class1)/
Pigment2) Perid 19butfu Fuco 19hexfu Neo Prasino Viol Allo Lutein Zea Chl-b Chl-a
Pras. 0 0 0 0 0.3768 0.1413 0.2165 0 0.0843 0 0.2807 1
Dino. 0.7471 0 0 0 0 0 0 0 0 0 0 1
Crypto. 0 0 0 0 0 0 0 0.1927 0 0 0 1
Hapto_N 0 0 0 1.7139 0 0 0 0 0 0 0 1
Hapto_S 0 0.5076 0.8354 0.2225 0 0 0 0 0 0 0 1
Chloro. 0 0 0 0 0.0495 0 0.1185 0 0.1294 0.3262 0.0168 1
Cyano. 0 0 0 0 0 0 0 0 0 0.6795 0 1
Diat. 0 0 1.0198 0 0 0 0 0 0 0 0 1
1)Pras: Prasinophytes, Dino: Dinoflagellates, Crypto: Cryptophytes, Hapto_N: Haptophytes, Hapto_S: Chrysophytes, Chloro: Chlorophytes, Cyano:
Cyanobacteria, Diat: Diatoms
2)Perid: Peridinin, 19butfu: 19-But-fucoxanthin, Fuco: Fucoxanthin, 19hexfu: 19-Hex-fucoxanthin, Neo: Neoxanthin, Prasino: Prasinoxanthin, Viol:
Violaxanthin, Allo: Alloxanthin, Lutein: Lutein, Zea: Zeaxanthin, Chl-b: Chlorophyll b, Chl-a: Chlorophyll a
분석 결과(Table 4) 수온과 염분은 상관계수 0.458(p<0.01) 로 음의 상관관계를 보였다. 이는 겨울철 수온이 낮을 때 높 은 염분을 유지하다 여름철 강수량이 집중되는 7월과 8월에 남강댐에서 담수의 대량 방류를 시작하고 이때에 유입된 담 수로 인해 본 연구 해역에서 급격한 염분 변화의 원인이 된 다고 보고한 기존의 연구와 유사한 결과를 나타내었다(Ro and Jung 2010; Jung et al. 2012).
DO(Dissolved Oxygen, 용존산소)는 평균 8.60mg L-1 (4.02~11.59mg L-1)로, 11월 평균 10.04mg L-1 (9.22~11.03 mg L-1)으로 가장 높게 나타났고, 8월 평균 5.25mg L-1 (4.02~6.60mg L-1)으로 가장 낮게 나타났다.
DIN(Dissolved Inorganic Nitrogen, 용존무기질소)은 평균 0.067mg L-1 (0.004~0.549mg L-1)로, DIP는 3월 평균 0.169 mg L-1 (0.014~0.549mg L-1)로 가장 높게 나타났고, 4월 평 균 0.012mg L-1 (0.010~0.028mg L-1)로 가장 낮게 나타났 다. DIP(Dissolved Inorganic Phosphate, 용존무기인)는 평균 0.009mg L-1 (최대값 0.036mg L-1)로, 9월 평균 0.021mg L-1 (0.005~0.036mg L-1)로 가장 높게 나타났고, 4월 평균 0.001mg L-1 (0.001~0.003mg L-1)로 가장 낮게 나타났다.
SiO2-Si(Silica, 규산규소)는 평균 0.305mg L-1 (0.002~1.05 mg L-1)로, 8월 평균 0.889mg L-1 (0.814~0.921mg L-1)로 가장 높게 나타났고, 2월 평균 0.018mg L-1 (0.008~0.022 30
25 20 15 10 5 0
34 33 32 31 30 29 12
10 8 6 4 2
0.30 0.25 0.20 0.15 0.10 0.05 0.030 0.00
0.025 0.020 0.015 0.010 0.005 0.000
F M A M J J A S O N D J Month
F M A M J J A S O N D J Month
1.2 1.0 0.8 0.6 0.4 0.2 0.0
Temperature(°C) Salinity(psu)
DO(mg L-1 ) DIN(mg L-1 )
DIP(mg L-1 ) SiO2-Si(mg L-1 )
Fig. 2. Spatial variation of Temperature, Salinity(psu), DO(mg L-1), DIN(mg L-1), DIP(mg L-1), SiO2-Si(mg L-1) in Jinju Bay.
mg L-1)로 가장 낮게 나타났다(Fig. 2). 염양염은 정점 1에 서 정점 6으로 갈수록 증가하는 경향이 나타났고, 특히 염분 이 27.9 psu로 가장 낮았던 3월 정점 6에서 DIN은 0.549mg L-1, SiO2-Si는 0.660mg L-1로 매우 높은 농도를 보이는 반 면 DIP는 0.008mg L-1로 비교적 낮게 나타났다. 또한 이 때 의 N/P 비가 157로 상당히 높은 값이 보이고 남강댐 방류 수의 영향이 적은 지역일수록 염분이 증가하고 DIN와 DIP 의 농도가 감소하는 경향을 보였다. 낙동강이나 섬진강 등에 서 담수 유입 시 일시적으로 질산염 과잉공급이 될 수 있음 을 시사한 정 등의 2013년 연구에 의하면 N/P 비가 평균 45 로 담수유입을 적게 받는 해역보다 높게 나타났고(Jung et al. 2013), Kwon et al.(2001)의 연구에서도 초저염분대역에 서 N/P 비가 200 이상으로 나타났다. 영양염은 주변 육상으 로부터 집중 유입이 되는데, 생활하수와 공장폐수를 배출하 는 대도시나 공장지대가 없다면, 질소 성분이 인산인에 비 해 상대적으로 많이 유입된다(Kwon et al. 2001). 또한 DIN 과 SiO2-Si는 대체로 유사한 경향의 증감을 보이는데, 본 연 구에서 SiO2-Si의 농도가 최대치를 보이는 8월의 경우 DIN 의 농도가 상당히 낮은 값을 보여주고 있다. 이는 여름철 증 가된 편모조류에 의해 DIN이 다량 흡수 되었거나, 본 연구 에서는 분석하지 않았지만 영양염을 흡수하는 종속영양박테 리아가 급속도로 성장하였을 때 DIN이 선택적으로 제거되 었을 가능성이 있기에(Baek et al. 2017) 향후 추가적인 분석 이 필요할 것이다.
2. 식물플랑크톤 변동 특성
UPLC 분석 결과 Chlorophyll a의 농도는 평균 1.84μg L-1 (0.13~9.03 μg L-1)로, 11월 평균 3.32μg L-1 (0.70~9.93 μg L-1)로 가장 높았고, 3월 평균 0.62μg L-1 (0.46~0.86
μg L-1)로 가장 낮게 나타났다(Figs. 3, 4). 또한 2014년 1월 Chlorophyll a의 농도가 3.23μg L-1로 연구기간 평균 1.84 μg L-1보다 더 높게 나타났는데, 내만에서는 겨울철에도 식 물플랑크톤의 광합성에 필요한 충분한 광조건과 원활한 영 양염의 공급에 의해 높은 세포밀도를 보여주며(Wafar et al.
1983; Karthink et al. 2012), 남해와 같이 수심이 얕고 조석 의 혼합이 활발한 지역은 겨울철에 도리어 식물플랑크톤의 현존량이 높을 수도 있다(Yoon 1995, 1998).
본 연구와 유사한 시기의 현미경 동정 결과 전 연구기 간 동안 규조류가 평균 92.9%로 극우점하여 나타났고 시·
공간적인 차이를 보였다. 수온이 낮은 가을에서 봄까지 기 간 동안 규조류가 식물플랑크톤의 총 현존량의 97% 이상 으로 우점하였고, 그 외 기간에는 와편모류의 우점율이 크 게 증가하여 차이가 나타났다. 현미경 관찰로 99% 이상 의 군집이 규조류와 와편모류로 구분되었으나 UPLC를 이용한 색소 분석 결과 담녹조류와 은편모류의 지시색소 인 Prasinoxanthin과 Chlorophyll b가 검출되어 이들의 존 재를 추정할 수 있다. Noh et al.(2005)이 동해 이어도 기 지 주변의 식물플랑크톤 군집 연구에서도 현미경과 HPLC 색소 분석을 병행하여 식물플랑크톤의 생태를 파악하였는 데, 녹조류에서 공통적으로 나타나는 색소인 Chlorophyll b, Neoxanthin, Prasinoxathin, Violaxanthin이 검출됨으로써 초 미소조류에 속하는 식물플랑크톤의 분포양상을 확인할 수 있었다.
UPLC로 분석된 식물플랑크톤의 지시색소의 농도를 이용 하여 CHEMTAX program 처리 결과 식물플랑크톤 군집은 총 8개의 분류군으로 구분 된다. 그 중 규조류가 평균 77.1%
로 가장 우점하게 나타났고, 은편모류가 10.1%, 뒤를 이어 담녹조류 7.7%, 와편모류 3.7%의 순으로 나타났고, 착편모 류, 황갈조류, 녹조류, 남조류는 모두 1% 이하의 분포비율을 Table 4. Pearson’s correlation matrix of phytoplankton composition and environmental parameters in Jinju Bay(Significant correlation:
**p<0.01, *p<0.05).
Temp. Sal. DO DIN DIP SiO2-Si Chl-a Pras. Dino. Crypto. Diat.
Temp. 1
Sal. -.458** 1
DO -.888** .343** 1
DIN .040 -.704** -.113 1
DIP .212 -.271* -.328** .536** 1
SiO2-Si .553** -.443** -.694** .492** .644** 1
Chl-a -.221 .118 .347** -.174 -.033 -.221 1
Pras. .526** -.287* -.509** .246* .216 .444** -.258* 1
Dino. .590** -.308** -.629** -.047 .007 .448** -.253* .197 1
Crypto. .242* -.393** -.214 .289* .117 .386** -.105 .453** .073 1 Diat. -.676** .422** .678** -.189 -.145 -.585** .343** -.840** -.628** -.589** 1 Temp: Temperature, Sal: Salinity, DO: Dissolved Oxygen, DIN: Dissolved Inorganic Nitrogen, DIP: Dissolved Inorganic Phosphate, SiO2-Si: Silica, Chl-a:
Chlorophyll a, Pras: Prasynophytes, Dino: Dinoplagellates, Crypto: Cryptophytes, Diat: Diatoms.
보였다(Figs. 3, 4).
식물플랑크톤 군집 중 최우점하여 나타난 규조류는 28.3~90.2%의 범위의 분포를 보이며, 2014년 1월 88.8%
로 가장 높게 나타났고 6월 56.8%로 가장 낮은 분포비율 로 나타났다. 특히 규조류는 전 연구 기간 동안 평균 75%
이상 우점하여 나타났지만 5월부터 70.7%로 감소하였고 6 월부터 8월까지 70% 이하의 분포비율을 보였다. 본 연구와 같은 방법으로 식물플랑크톤의 군집구조에 대해 연구한 남 해 가막만과 여자만에서도 식물플랑크톤 군집 중 규조류가
80%로 이상의 분포비율을 보이고 있고(Lee et al. 2011), 현 미경 관찰에 의한 식물플랑크톤 군집 연구에서도 진주만에 서 67.4%(Oh et al. 2008), 낙동강 하구 및 연안에서 66.8%
(Jung and Yoon 2013), 장수만에서 75%로(Yoon 2014) 규조 류가 우점하는 것으로 나타났다. 규조류는 성장 속도가 빠르 고 해수의 교환률이 높아도 개체군이 확산되지 않고 개체군 의 확대가 가능하여 담수의 영향이 크고 해수의 교환이 빠 르게 일어나는 연안 환경에서 다른 식물플랑크톤에 비해 적 응률이 높기 때문에 본 연구해역에서도 가장 우점하는 분 100
80 60 40 20 0
100 80 60 40 20 0 15
10
5
0
15
10
5
0 15
10
5
0 15
10
5
0 15
10
5
0 15
10
5
0 100
80 60 40 20 0
100 80 60 40 20 0
100 80 60 40 20 0
100 80 60 40 20
St. 1 St. 2 St. 3 St. 4 St. 5 St. 6 0 St. 1 St. 2 St. 3 St. 4 St. 5 St. 6
Composition(%) ◯ Total pigments(μg L-1 )◯ Total pigments(μg L-1 )◯ Total pigments(μg L-1 )
Composition(%)Composition(%)
Fig. 3. The community composition of phytoplankton(%) calculation using the CHEMTAX program and total pigment(μg L-1) in Jinju Bay.
(a) Feb. 2013 (b) Mar. 2013
(c) Apr. 2013 (d) May 2013
(e) Jun. 2013 (f) Jul. 2013
Diatoms Cryptophytes Dinoflagellates Prasinophytes Haptophytes Crysophytes Chlorophytes Cyanobacteria
류군으로 판단된다(Yamamoto 2000; Oh et al. 2008). 은편 모류는 5.3~24.3%의 범위로, 6월 평균 18.8%로 가장 높게 나타났고, 4월 평균 7.11%로 가장 낮게 나타났다. 은편모류 는 6월과 7월, 11월을 제외하고 나머지 기간에서는 10% 미 만으로 나타났다. 담녹조류는 0.9~35.2%의 범위로, 6월 평 균 17.3% 가장 높게 나타났고, 2014년 1월 평균 1.5%로 가 장 낮게 나타났다. 담녹조류는 5월과 6월을 제외하고, 나머 지 기간에서는 10% 미만으로 나타났다. 특히 담녹조류는 겨 울철 1.5%였던 분포비율이 6월 평균 17.8%로 10배 이상 증
가하여 주요 식물플랑크톤 군집 중 월별 분포비율의 차이가 가장 크게 나타났다. 와편모류는 0.1~23.1%의 범위로, 7월 평균 13.9%로 가장 높게 나타났고, 2014년 1월 평균 0.4%
로 가장 낮게 나타났다. 와편모류는 7월과 8월을 제외하고 나머지 기간에서는 10% 미만으로 나타났다. 와편모류는 담 녹조류와 마찬가지로 월별 분포비율의 변화가 크게 나타났 으며 6월, 7월, 8월을 제외한 연구 기간 동안 3% 이내의 분 포비율을 보였으나 6월부터 8월까지 평균 4~14%의 분포비 율로 증가하였다(Figs. 3, 4).
100 80 60 40 20 0
100 80 60 40 20 0 15
10
5
0
15
10
5
0 15
10
5
0 15
10
5
0 15
10
5
0 15
10
5
0 100
80 60 40 20 0
100 80 60 40 20 0
100 80 60 40 20 0
100 80 60 40 20
St. 1 St. 2 St. 3 St. 4 St. 5 St. 6 0 St. 1 St. 2 St. 3 St. 4 St. 5 St. 6
Composition(%) ◯ Total pigments(μg L-1 )◯ Total pigments(μg L-1 )◯ Total pigments(μg L-1 )
Composition(%)Composition(%)
Fig. 4. The community composition of phytoplankton(%) calculation using the CHEMTAX program and total pigment(μg L-1) in Jinju Bay.
(g) Aug. 2013 (h) Sep. 2013
(j) Nov. 2013 (i) Oct. 2013
(k) Dec. 2013 (l) Jan. 2014
Diatoms Cryptophytes Dinoflagellates Prasinophytes Haptophytes Crysophytes Chlorophytes Cyanobacteria
식물플랑크톤 중 주요 우점 군집(규조류, 은편모류, 담녹 조류, 와편모류)의 월별 분포특징을 살펴보면 수온이 올라가 는 6월부터 규조류의 분포비율이 감소하는 대신 나머지 세 군집의 분포비율이 증가하여 군집의 조성이 눈에 띄게 변했 는데, 특히 수온이 가장 낮은 2014년 1월과 수온이 가장 높 은 7월을 비교해보면, 88.8%였던 규조류가 64.7%로 감소하 고, 1%로 미만의 분포비율을 보이던 와편모류가 13.9%로 증가하여 규조류 다음으로 우점하여 나타났다. 와편모류는 대체로 높은 염분과 수온, 광량을 선호하는 것으로 알려져 있는데(Smayda 1980), 특히 연안역에서는 인간 활동에 의 해 육지기원의 영향과 강수에 의한 영향을 크게 받기 때문 에 계절적 변화도 그 특성이 달리 나타나게 된다고 하였다 (Yoon 1996). 그리고 온대지역의 연안에서는 식물플랑크톤 이 봄에는 규조류가 우점하고 여름에는 와편모류가 우점한 다는 것이 Cloern의 연구에 의해 밝혀진 바 있고(Cloern and
Dufford 2005), 본 연구해역에서도 유사한 군집조성을 보여 주고 있다(Fig. 5).
3. 주요 식물플랑크톤 군집과 환경요인과의 관계 식물플랑크톤 군집분포에 영향을 주는 환경요인을 알아 보기 위해 식물플랑크톤 중 주요 우점 군집과 수온, 염분, 용 존산소, 영양염과 Pearson 상관분석을 실시하였다(Table 4).
규조류는 95% 신뢰구간 내에서 수온과 상관계수 0.676으로 음의 상관관계가 나타났고, 염분과 상관계수 0.422로 음의 상관관계가 나타났다. 반면 규조류를 제외한 나머지 군집 담 녹조류와 와편모류, 은편모류는 95% 신뢰구간 내에서 수온 과 각각 상관계수 0.526, 0.590, 0.242로 양의 상관관계가 나 타났고, 염분과는 각각 상관계수 0.287, 0.308, 0.393으로 음 의 상관관계가 나타났다. 또한 규조류는 SiO2-Si와 -0.585 (p<0.01)로 음의 상관성을 보였고 그 외 군집은 양의 상관 성을 보였다. 일반적으로 규소는 규조류가 소비를 하기 때문 에 규조류의 현존량이 많을 때 유입되어 빠르게 소비가 되 고, 반면 여름철 군집 조성이 변하여 규조류를 제외한 그 외 군집의 분포비율이 증가하고 규조류 군집이 감소하여 유입 된 규소가 규조류에 의해 소비되지 않았다고 판단된다.
몬순 기후의 영향을 받는 우리나라 연안에서는 여름철 홍 수기에 많은 양의 담수 유입으로 인하여 염하구성 환경과 유사한 물리, 화학적 특성의 연안수가 일시적으로 광범위하 게 발달하는 것으로 보고되고 있다. 이러한 일시적 염하구성 환경의 발달이 육지와 해양 간의 물질순환에 상당한 영향을 주고(Choi et al. 2007), 특히 남해안에 자주 발생하는 적조 또한 주변 강이나 하천에서 공급되는 육상기원 영양염 물 질과 직, 간접적으로 밀접한 관계가 있다(Kwon et al. 2001;
Lee et al. 2001). 결과적으로 진주만의 식물플랑크톤 군집은 온대해역의 특징인 수온의 변화와, 육지로부터 공급되는 담 수로 인한 염분 변화에 의해 영향을 받는 것을 확인할 수 있 었다. 아울러 진주만은 복잡한 지형에 의해 노량해협과 창선 수로, 대방수로를 통한 유기물질의 유입과 유출이 빈번히 일 어나고, 남강댐 방류수와 주변에 둘러싸인 육지에 의해 영 향을 받기 때문에 식물플랑크톤 군집의 특성을 파악하는 데 다양한 물리, 화학적인 환경요인을 고려해야 할 것이다.
적 요
진주만 해역에서의 식물플랑크톤 시공간적 군집 분포와 이를 조절하는 환경요인을 파악하기 위해 물리, 화학적인 환 경조사와 더불어 UPLC-CHEMTAX program을 이용한 식 물플랑크톤 군집특성분석을 수행하였다. 본 연구해역에서의 St. 6
St. 5 St. 4 St. 3 St. 2 St. 1 St. 6 St. 5 St. 4 St. 3 St. 2 St. 1 St. 6 St. 5 St. 4 St. 3 St. 2 St. 1 St. 6 St. 5 St. 4 St. 3 St. 2 St. 1
100 85 70 55 40 25
Percentage(%)Percentage(%)Percentage(%)Percentage(%)
30 24 18 12 6 0
30 24 18 12 6
F M A M J J A S O N D J 0
Month
40 32 24 16 8 0
(a)
(b)
(c)
(d)
Fig. 5. Spatio-temporal distribution of dominant phytoplankton groups(%) calculation using the CHEMTAX program in Jinju Bay: Diatoms(a), Cryptophytes(b), Prasinophytes(c), and Dinoflagellates(d).
Chlorophyll a 농도는 평균 1.84μg L-1 (0.13~9.03μg L-1)로 얕은 수심과 조석의 혼합이 활발한 본 연구해역에서 겨울 철 식물플랑크톤 현존량이 높게 나타났다. 또한 본 연구해역 에서 나타난 주요 식물플랑크톤 군집 중 규조류가 연구기간 동안 평균 77.1%로 대부분 우점하였으나, 하계(6월, 7월, 8 월) 은편모류(7.7~18.8%), 담녹조류(7.8~17.3%), 와편모류 (4.9~13.9%)의 분포비율을 나타내었다. 특히 은편모류와 담 녹조류는 현미경으로 검경하기 어려운 군집이며, 동기간 보 고된 현미경 관찰결과에도 나타나지 않아 향후 이들 군집에 대한 면밀한 조사가 필요할 것으로 판단되었다.
본 연구를 통해 UPLC 활용하여 진주만 어장 생태계의 기 초 생산자이자 먹이원으로 작용하는 식물플랑크톤의 생물량 및 시공간적 변동특성을 확인할 수 있었다. 아울러 현미경 검경으로 확인하기 어려운 은편모류와 담녹조류 군집이 하 계에 상대적으로 높은 비율을 나타내는 것을 UPLC로 확인 할 수 있었고, 이러한 결과는 향후 1차 생산에 관여하는 식 물플랑크톤의 계절 변화의 기초정보로 유용하게 이용될 것 이다.
사 사
본 연구는 국립수산과학원 남해수산연구소 ‘남해연안어업 및 환경생태조사(R2017032)’ 사업의 일환으로 수행되었습 니다.
REFERENCES
Bae SH, K You and MS Han. 2017. Analysis of environmental factors related to seasonal variation of bacteria and hetero- trophic nanoflagellate in Kyeonggi bay, Korea. Korean J.
Environ. Biol. 35:198-206.
Bowles ND, HW Paerl and J Tucker. 1985. Effective solvents and extraction periods employed in phytoplankton carot- enoid and chlorophyll determination. Can. J. Fish. Aquat.
Sci. 42:1127-1131.
Choi YK, JY Yang, YS Lee, J Yu, DK Kim, IS Han and WJ Go.
2007. Characteristics of ocean environment in the dry and wet seasons in the South Sea of Korea. J. Environ. Sci. Int.
16:459-466.
Cloern JE and R Dufford. 2005. Phytoplankton community ecology: principles applied in San Francisco Bay. Mar. Ecol.
Prog. Ser. 285:11-28.
De Villiers A, F Lestremau, R Szucs, S Gelebart, F David and P Sandra. 2007. Valuation of ultra performance liquid chro-
matography Part I. Possibilities and limitations. J. Chro- matogr. A. 1127:60-69.
Furuya K, M Hayasi, Y Yabushita and A Lshikawa. 2003. Phy- toplankton dynamics in the East China Sea in spring and summer as revealed by HPLC-derived pigment signatures.
Deep Sea Res. II. 50:367-387.
Guillarme D, DT Nguyen, S Rudaz and JL Veuthey. 2007.
Recent developments in liquid chromatography-impact on qualitative and quantitative performance. J. Chromatogr. A 1149:20-29.
James A. 1979. The value of biological indicators in relation to other parameters of water quality. pp. 1-16. In: Chap.
1. James A. and L. Evison(eds.), Biological indicators of water quality. John Wiley and Sons, USA.
Jeffrey SW, RFC Mantoura and SW Wright. 1997. Phytoplank- ton pigments in oceanography. UNESCO Publishing, Paris.
Jung KY, YJ No, BJ Kim and KS Park. 2012. Model trajectory simulation for the behavior of the Namgang dam water in the Kangjin bay, South Sea, Korea. J. Korean Soc. Coast.
Ocean Eng. 24:97-108.
Jung MH and SH Yoon. 2013. Temporal and spatial variability of phytoplankton communities in the Nakdong river estu- ary and coastal area, 2011-2012. The Sea 18:214-226.
Karthik R, KM Arun, ES Sai, SR Siva and G Padmavati. 2012.
Phytoplankton abundance and diversity in the coastal waters of port Blair, South Andaman Island in relation to environmental variables. J. Mar. Biol. Oceanogr. 1:2.
Kim CK, JT Lee and HS Jang. 2010. Water circulation structure in the Chinju bay of Korea. J. Korean Soc. Coast. Ocean Eng. 22:215-223.
Kim HJ, BM Kwak, JH Ahn and JS Park. 2014. Simultaneous determination of Synephrine and N-Methyltyramine in orange fruit and juice from Korean market by UPLC-FLD.
Korean J. Food Sci. Technol. 46:276-282.
Kwon KY, CH Moon and HS Yang. 2001. Behavior of nutri- ents along the salinity gradients in the Seomjin river estu- ary. Korean J. Fish. Aquat. Sci. 34:199-206.
Kwon KY, CH Kim, CK Kang, CH Moon, MO Park and SY Yang. 2011. Limiting nutrients for phytoplankton growth in the Seomjin river estuary as determined by algal bioassay experiment. Korean J. Fish. Aquat. Sci. 35:455-462.
Lee JY and M Jang. 2014. Size dependent analysis of phyto- plankton community structure during low water temperature periods in the coastal waters of East Sea, Korea. Korean J.
Environ. Biol. 32:168-175.
Lee YS, YT Park, KY Kim, JS Park, WJ Go, YJ Jo and SY Park.
2001. Countermeasure and outbreak mechanism of Cochlo- dinium polykrikoides red tide: 1. Environmental character- istics on outbreak and disappearance of C. polykrikoides
bloom. The Sea 6:259-264.
Lee YW, MO Park, YS Kim, SS Kim and CK Kang. 2011. Ap- plication of photosynthetic pigment analysis using a HPLC and CHEMTAXprogram to studies of phytoplankton com- munity composition. The Sea 16:117-124.
Mackey MD, DJ Mackey, HW Higgins and SW Wright. 1996.
CHEMTAX - a program for estimating class abundances from chemical markers: application to HPLC measurements of phytoplankton. Mar. Ecol. Prog. Ser. 144:265-283.
Noh JH, S Yoo, JA Lee, HC Kim and JH Lee. 2005. Phyto- plankton in the waters of the Ieodo ocean research station determined by microscopy, flow cytometry, HPLC pigment data and remote sensing. Ocean Polar Res. 27:397-417.
Oh SJ, JS Lee, JS Park, IH No and YH Yoon. 2008. Environ- mental factor on the succession of phytoplankton communi- ty in Jinju Bay, Korea. J. Korean Soc. Mar. Environ. Energy 11:98-104.
Park K, MR Jo, JY Kwon, KT Son, DS Lee and HJ Lee. 2010.
Evaluation of the bacteriological safety of the shellfish grow- ing area in Gangjinman, Korea. Korean J. Fish. Aquat. Sci.
43:614-622.
Park MO and JS Park. 1997. HPLC method for the analysis of chlorophylls and carotenoids from marine phytoplankton.
Ocean Sci. J. 32:46-55.
Raymont JEG. 1980. Plankton and productivity in the oceans 2nd Ed. volume Phytoplankton. Pergamon Press. p. 489.
Ro YJ and KY Jung. 2010. Impact of the Dam water discharge on the circulation system in the Kangjin Bay, South Sea, Korea. Ocean Sci. J. 45:17-35.
Smayda TJ. 1980. Phytoplankton species succession. pp. 493- 570. In: The physiological ecology of phytoplankton. ed.
by Morris I. Blackwell, Oxford.
Wafar MVM, P Le Corre and JL Birren. 1983. Nutrients and primary production in permanently well mixed temperate coastal waters. Estuar. Coast. Shelf Sci. 17:431-446.
Welschmeyer NA. 1994. Fluorometric analysis of chlorophyll a in the presence of chlorophyll b and pheopigments. Lim- nol. Oceanogr. 39:1985-1992.
Wright SW, SW Jeffrey, RFC Mantoura, CA Llewellyn, T Bjornland, D Repeta and N Welschmeyer. 1991. Improved HPLC method for the analysis of chlorophylls and carot- enoids from marine phytoplankton. Mar. Ecol. Prog. Ser.
77:189-196.
Yamanoto T and M Okai. 2000. Effects of diffusion and upwell- ing on the formation of red tides. J. Plankton Res. 22:363- Yoon YH. 1995. Seasonal dynamics of phytoplankton com-380.
munity and red tide organisms in the Northern Kamak bay, Southern Korea. Bull. Mar. Sci. Inst., Yosu Nat’l Fish. Univ.
4:1-15.
Yoon YH. 1998. The distributional characteristics of phyto- plankton community in Wando Eastern coastal waters, Southwestern Korea. Bull. Yosu Nat’l Univ. 12:651-664.
Yoon YH. 2014. Spatio-temporal distribution of phytoplankton community in the Jangsu Bay and adjoining sea of South Sea, Korea. Korean J. Environ. Biol. 32:75-87.
Yoon YH and SA Kim. 1996. Seasonal variations of phy- toplankton population and primary productivity in the southern coastal waters of Korea. 1. A characteristics of the distribution of chlorophyll a and water quality in the dry season in the Yosuhae Bay and adjoining sea. J. Korean En- viron. Sci. Soc. 5:347-359.
Zapata M, F Rodriguez and JL Garrido. 2000. Separation of chlorophylls and carotenoids from marine phytoplankton:
A new HPLC method using a reversed phase C8 column and pyridine containing mobile phases. Mar. Ecol. Prog.
Ser. 195:29-45.
Zhu ZY, WM Ng, SM Liu, J Zhang, JC Chen and Y Wu. 2009.
Estuarine phytoplankton dynamics and shift of limiting factors: A study in the Changjiang(Yangtze River) Estuary and adjacent area. Estuar. Coast. Shelf Sci. 84:393-401.
Received: 1 February 2018 Revised: 5 March 2018 Revision accepted: 6 March 2018