• 검색 결과가 없습니다.

Distribution of Dissolved Organic Carbon (DOC) in the Southwestern East Sea in Summer

N/A
N/A
Protected

Academic year: 2021

Share "Distribution of Dissolved Organic Carbon (DOC) in the Southwestern East Sea in Summer"

Copied!
7
0
0

로드 중.... (전체 텍스트 보기)

전체 글

(1)

Article

DOI: 10.4217/OPR.2010.32.3.291

Distribution of Dissolved Organic Carbon (DOC) in the Southwestern East Sea in Summer

Tae-Hoon Kim and Guebuem Kim

*

School of Earth and Environmental Sciences/Research Institute of Oceanography Seoul National University, Seoul 151-747, Korea

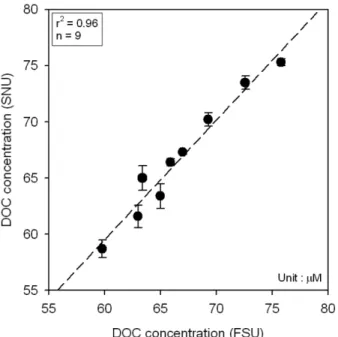
Abstract : In the summer of 2008 (August 4-14), vertical and horizontal distributions of inorganic nutrients and dissolved organic carbon (DOC) were measured in the southwestern East Sea. Concentrations of DOC were determined for the first time in the southwestern East Sea using the high-temperature combustion oxidation (HTCO) method, and results were compared with those measured by another laboratory.

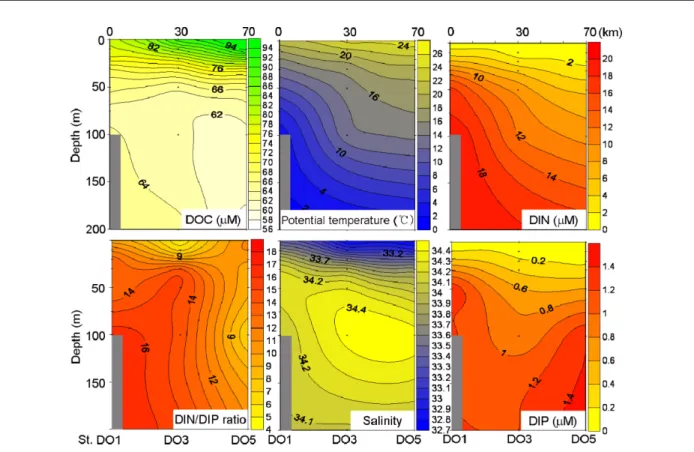
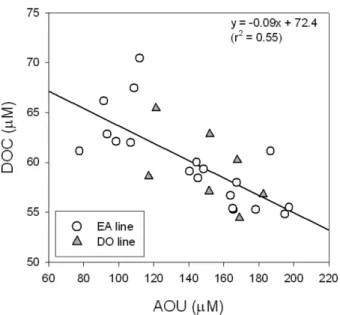
Concentrations of DOC ranged from 58 to 104 µM in the upper 200 m, showing a typical decreasing pattern with depth. Generally, concentrations of DOC were relatively lower, with higher nutrient concentrations, in the upper layer of the coastal upwelling zone. Concentrations of DOC ranged from 54 to 64 µM in the deep Ulleung Basin (200-1500 m), and were higher than those in the Pacific and Atlantic oceans. In association with rapid vertical ventilation of the euphotic, this difference indicates a larger accumulation of semi-labile DOC in the deep East Sea than in the major oceans. A correlation between apparent oxygen utilization (AOU) and DOC in the deep ocean of the East Sea revealed that only a small portion (<10%) of the sinking DOC, relative to the sinking particulate organic carbon (POC), contributes to microbial degradation. Our results present an important data set of DOC in the East Sea, which plays a critical role in carbon cycle modeling and sequestration.

Key words : dissolved organic carbon, nutrients, coastal upwelling, apparent oxygen utilization, East Sea

1. Introduction

Surrounded by Korea, Japan, and Russia, the East Sea is an almost completely enclosed marginal sea located in the northwestern Pacific Ocean. The East Sea has a maximum depth of approximately 3700 m with three major basins over 2000 m deep: the Japan Basin (which is almost 4000 m deep) in the northern half, the Ulleung Basin in the southwest, and the Yamato Basin in the southeast. The Tsushima Current Water (TCW) is present in the upper 150 m of the Ulleung and Yamato Basins, and encounters the cold northern surface water at the sub- polar front (approximately 40

o

N). The TCW consists of the lower salinity and high temperature Tsushima Surface Water and the high salinity Tsushima Middle Water (>34.5) below the seasonal thermocline in the East Sea

(Chang et al. 2002). The Tsushima Surface Water, occurring in the southwestern East Sea, often exhibits low salinity from the influence of the Yangtze and Korean rivers, particularly in summer (Lim 1971; Ahn et al . 2008).

Turnover time for water in the East Sea is about 100 years (Watanabe et al. 1991; Tsunogai et al. 1993; Kim et al. 2001), which is much faster than the global ocean conveyer belt. The recent slowdown of deep water formation in the East Sea has been well documented using changes in dissolved oxygen concentrations in deep water masses (Kim and Kim 1996; Chen et al. 1999; Gamo 1999; Kim et al. 1999; Kim et al. 2001; Kang et al. 2004).

As such, the anthropogenic CO

2

accumulation rate in the deep water of the East Sea has considerably decreased in the last few decades (Park et al. 2008).

Measurements of export production based on

3

H and

3

He tracers show values of ~99 g C m

−2

yr

−1

in the Japan

*Corresponding author. E-mail : [email protected]

(2)

Basin of the East Sea (Hahm and Kim 2008). Owing to the high production and rapid sinking of biogenic particulate organic carbon (POC), POC fluxes (>37 g C m

−2

yr

−1

) in the upper 100 m observed in the East Sea are relatively higher than those of major oceans (Hong et al.

2008; Otosaka et al. 2008). However, there is no information on dissolved organic carbon (DOC) cycling or export in the Ulleung Basin. DOC is known to be the largest organic carbon reservoir in the ocean. Thus, DOC production, cycling, export, and remineralization are very important in evaluating carbon budgets. Recent studies have shown that DOC export rivals POC export in large areas of the ocean (Carlson et al. 1994; Hansell et al.

2002). DOC data are not available in many important oceanic regions, because of the difficulty in obtaining accurate measurements (Sharp 1997). This study accurately measures DOC concentrations in the southwestern East Sea for the first time using a well-established high- temperature combustion method. Comparison with data from a leading laboratory in DOC measurements (T.

Dittmar, Florida State University) verifies our measurement accuracy.

2. Materials and methods

Samples were collected on the hydrographic survey cruise (August 4-14, 2008) of the National Oceanographic Research Institute (NORI) R/V HaeYang 2000 in the southwestern East Sea. Seawater samples were collected at 20 stations to measure dissolved inorganic nitrogen (DIN: NO

3

+NO

2

), dissolved inorganic phosphate (DIP:

PO

4

), and DOC (Fig. 1). Samples for the nutrients (DIN and DIP) and DOC were collected from Niskin bottles mounted on a conductivity-temperature-depth (CTD) rosette. Nutrient samples were filtered through a GF/F filter (diameter: 47 mm) onboard. Until analysis, samples were stored at −20

o

C. Samples for DOC analysis were filtered onboard through a pre-combusted glass fiber syringe filter (Whatman, 0.7 µm, 25 mm). DOC samples were acidified with 6 M HCl in pre-combusted glass ampoules (550

o

C for 5 h) and immediately stored at 5

o

C for preservation until analysis. Niskin bottles were used for all vertical samplings. Temperature and salinity were measured using the CTD SBE 911 plus system (Sea-Bird Co.).

In the laboratory, nutrients were measured using an autoanalyzer (Futura Plus, Alliance Co.), which uses the Cu-Cd reduction column method for DIN and the molybdenum blue colorimetric method for DIP. For a

large number of East Sea cruise samples, reliability of nutrient data from our laboratory was verified through comparison experiments with POI (Russia). The comparison showed a good correlation (r

2

=0.99 for DIN, r

2

=0.98 for DIP) for approximately 200 samples. We also measured certified reference material (CRM) from MOOS-1 (National Research Council, Canada) for each batch of samples, and they were in agreement within 5%.

A Shimadzu TOC analyzer (V

CPH

model) was used for

the high-temperature combustion oxidation (HTCO)

analysis of DOC. The HTCO method is based on the

method described by Sugimura and Suzuki (1998), and

was modified by Dittmar et al. (2006). After samples were

pumped with a glass syringe, they were acidified with

HCl to a pH below 2 and purged by an ultrapure air gas to

remove any inorganic carbon. An aliquot (100 µl typical

volume) of each sample was automatically injected into a

combustion glass tube filled with a catalyst (Pt-coated Al)

at 720

o

C in a furnace. Organic matter present in the

sample was oxidized by the catalyst to CO

2

. By integrating a

peak area, evolved CO

2

was measured by non-dispersive

infrared detection (NDIR). To accurately determine DOC

concentrations, it was necessary to reduce the system

Fig. 1. Location of sampling stations in the southwestern

East Sea. Hydrological observations and seawater

samplings were conducted during August 4-14,

2008.

(3)

blank to as low as possible. This procedure was continued until organic-free distilled water was stable within the detection limit (<5 µM) of our DOC methods.

Measurement reliability was verified daily by using a certified DOC seawater sample (DSR; 46-47 µM) obtained from the University of Miami. Our results agreed within

5% with the certified value. Analytical results (n=9) were also compared with those measured for duplicate samples (T. Dittmar, FSU). Comparison results showed a good agreement within 5% (Fig. 2).

3. Results and discussion

In the EE, DO, and EA transects of the East Sea, potential temperature and salinity in the upper mixed layer are in the ranges of 15-28

o

C and 31.9-34.0, respectively (Figs. 3-5). Below the mixed layer, potential temperature and salinity are in the ranges of 1-24

o

C and 33.3-35.0, respectively. The surface TCW in the eastern part of the study area has lower salinity (<34) and higher temperature (Figs. 3-5) than the western part. Wind-driven coastal upwelling is observed in the western part of the study area, where relatively higher salinity and lower temperatures are recorded in the upper waters (Figs. 3-5).

Concentrations of DIN are almost depleted (0.2 to 3.5 µM) in the mixed layer, while DIP concentrations are less than 0.2 µM (Fig. 3). Below 50 m, DIN and DIP concentrations are in the ranges of 5-15 µM and 0.6-1.6 µM, respectively. Concentrations of the DIN and DIP in the coastal upwelling zone are higher than in offshore waters. DIN/DIP (hereafter N/P) ratios in the coastal upwelling water are less than 12 in the EE line, but relatively higher in the DO and EA lines. In general, N/P ratios in the East Sea are between 13 and 14 in deep Fig. 2. A plot showing the comparison of DOC concen-

trations measured by Seoul National University (SNU) and Florida State University (FSU) for duplicate samples.

Fig. 3. Horizontal and vertical distributions of DOC, potential temperature, salinity, N/P ratio, DIN, and DIP in the

EE transect of the East Sea.

(4)

Fig. 4. Horizontal and vertical distributions of DOC, potential temperature, salinity, N/P ratio, DIN, and DIP in the DO transect of the East Sea.

Fig. 5. Horizontal and vertical distributions of DOC, potential temperature, salinity, N/P ratio, DIN, and DIP in the

EA transect of the East Sea.

(5)

water, but lower than 12 in surface waters owing to biological consumption (Kim et al. 2010). In this study, relative to the typical N/P ratio observed in the East Sea, we observed somewhat higher N/P ratio trends in the upper layer (0-200 m) of each transect line. We speculate that this trend is related to the influence of coastal upwelling of the deep water, which has N/P ratios of approximately 13.

In the southwestern East Sea, concentrations of DOC are relatively high in the surface mixed layer and decrease with depth. Concentrations of DOC in the surface layer (<200 m depth) range from 56 to 104 µM (Fig. 6). In the EE, DO, and EA transects of the East Sea, the concentrations of DOC in the upper mixed layer are in the ranges of 71-98 µM (avg.: 85 µM), 76-104 µM (avg.: 87 µM), and 64-102 µM (avg.: 81 µM). Below the mixed layer, DOC concentrations are in the ranges of 57-76 µM (avg.: 67 µM), 59-82 µM (avg.: 68 µM), and 56-76 µM (avg.: 65 µM). In the surface mixed layer of the western upwelling region, DOC concentrations (avg.: 76 µM) are lower than those (avg.: 86 µM) for the offshore area, possibly due to the deep water upwelling of the East Sea, which has relatively low DOC.

In general, concentrations of DOC in the surface layer of the major oceans are in the range of 60-80 µM (Carlson and Ducklow 1995; Hansell and Carlson 1998; Doval and Hansell 2000). The DOC concentrations in the surface layer of the East Sea are relatively higher than those in the

Pacific Ocean (avg.: 70 µM) and Atlantic Ocean (avg.: 68 µM). Concentrations of DOC in the deep layer of the East Sea (depth > 200 m) are relatively constant within the range of 54-64 µM (Fig. 6). The concentrations of DOC in the deep water are higher than those in the Pacific Ocean (avg.: 36 µM) and Atlantic Ocean (avg.: 44 µM) (Fig. 6; Bauer et al. 1992).

In the ocean, refractory DOC turns over on time scales of centuries to millennia, whereas labile DOC turns over on time scales of minutes to days (Hansell and Carlson 2001). More recently, a portion of the DOC pool found in deep water with high concentrations of DOC was resistant to rapid microbial degradation and was termed “semi- labile” DOC (Carlson et al. 1994; Hansell and Carlson 2001). However, there is a deep ocean DOC gradient of 14 µM from the North Atlantic to the North Pacific, indicating that a portion of deep ocean DOC is removed on time scales of global ocean mixing, either because of UV irradiation when exposed to the surface (Kieber et al.

1989; Mopper et al. 1991) or remineralization of refractory DOM by attached bacteria (Druffel et al. 1996, 1998).

Our results indicate that a large portion (approximately 40%) of the DOC in the East Sea (the difference between Pacific deep water and East Sea deep water) is resistant to microbial degradation over the time scale of East Sea turnover (>100 years). Overall, it seems that production of labile and semi-labile DOC is greater in the euphotic zone of the East Sea because of higher productivity relative to Fig. 6. Vertical profiles of DOC for the entire depth of the southwestern East Sea. Typical profiles of DOC from the

North Pacific (solid line) and North Atlantic (dashed line) are shown for comparison.

(6)

the major oceans. However, a larger portion of the semi- labile DOC produced in the surface layer is present in the deep ocean due to rapid water turnover.

To determine DOC contribution to dissolved oxygen utilization in the deep water of the East Sea, we plotted DOC concentrations against apparent oxygen utilization (AOU) below the euphotic zone (100-1500 m). The plot (Fig. 7) shows a good linear correlation (r

2

=0.55, n=25) with negative slopes (DOC/AOU: −0.09 for the EA and DO stations). The DOC/AOU ratio in the East Sea is much smaller than the Redfield ratio (C/O

2

= −0.77).

Below the euphotic layer, the ratio value indicates that DOC oxidation is responsible for approximately 10% of the oxygen consumption in the deep ocean. Using DOC/

AOU molar ratios ( −0.21), the contribution of DOC oxidation to oxygen consumption is calculated to be approximately 30% in the deep water of the North Pacific (depth > 600 m) and North Atlantic oceans (depth > 300 m) (Druffel et al. 1989; Kepkay and Wells 1992). In the southwestern East Sea, POC contribution seems to be relatively high because of higher POC export in this region.

4. Conclusions

In the southwestern East Sea, concentrations of DOC are highest in the upper mixed layer, and decreased with depth. The DOC concentrations in the coastal upwelling zone are relatively lower than those in the offshore zone

owing to coastal deep water upwelling, which has low DOC concentrations. In association with the rapid water ventilation of the East Sea, semi-labile DOC concentrations in deep water are higher than concentrations found in the major oceans. The oxidation of DOC contributes to approximately 10% of the deep ocean oxygen utilization, indicating a major contribution of oxygen utilization by POC in water below 100 m in the southwestern East Sea.

Together with other biogeochemical parameters, more extensive observations of DOC are necessary to gain a better understanding of the carbon cycle in the East Sea, which can be regarded as a miniature model of the major oceans.

Acknowledgements

We would like to thank the EMBL members for assistance in field sampling and laboratory analysis. This work was supported by the Ministry of Land, Transport and Maritime Affairs as part of the Korea EAST-I (East Asian Seas Time-series 1) Program. THK was partially supported by the BK21 scholarship through the School of Earth and Environmental Sciences, Seoul National University (SNU), Korea.

References

Ahn YH, Shanmugam P, Moon JE, Ryu JH (2008) Satellite remote sensing of a low-salinity water plume in the East China Sea. Ann Geophys 26:2019-2035

Bauer JE, Williams PM, Druffel ERM (1992)

14

C activity of dissolved organic carbon fractions in the north central Pacific and Sargasso Sea. Nature 357:667-670

Carlson CA, Ducklow HW, Michaels AF (1994) Annual flux of dissolved organic carbon from the euphotic zone in the northwestern Sargasso Sea. Nature 371:405-408 Carlson CA, Ducklow HW (1995) Dissolved organic carbon

in the upper ocean of the central equatorial Pacific Ocean, 1992: daily and finescale vertical variations.

Deep-Sea Res II 42:639-656

Chang KI, Kim YB, Suk MS, Byun SK (2002) Hydrography around Dokdo. Ocean and Polar Res 24:369-389

Chen CTA, Bychkov AS, Wang SL, Pavlova GYu (1999) An anoxic Sea of Japan by the year 2200? Mar Chem 67:249-265

Dittmar T, Hertkorn N, Kattner G, Lara RJ (2006) Mangroves, a major source of dissolved organic carbon to the oceans. Global Biogeochem Cy 20. doi:10.1029/

Fig. 7. A plot of DOC versus AOU in the deep ocean

(>100 m) for the EA and DO transects.

(7)

2005GB002570

Doval M, Hansell DA (2000) Organic carbon and apparent oxygen utilization in the western South Pacific and central Indian Ocean. Mar Chem 68:249-264

Druffel ERM, Bauer JE, Williams PM, Griffin S, Wolgast D (1996) Seasonal variability of particulate organic radiocarbon in the northeast Pacific Ocean. J Geophys Res 101(20):543-552

Druffel ERM, Griffin S, Bauer JE, Wolgast DM, Wang XC, (1998) Distribution of particulate organic carbon and radiocarbon in the water column from the upper slope to the abyssal NE Pacific Ocean. Deep-Sea Res II 45:667- 687

Druffel ERM, Williams PM, Suzuki Y (1989) Radiocarbon levels and concentrations of dissolved organic matter in Pacific Ocean waters. Geophys Res Lett 16:991-994 Gamo T (1999) Global warming may have showed down

the deep conveyor belt of a marginal sea of the northwestern Pacific: Japan Sea. Geophys Res Lett 26:3137-3140

Hahm D, Kim KR (2008) Observation of bottom water renewal and export production in the Japan Basin, East Sea using tritium and helium isotopes. J Korean Soc Oceanogr 43:39-48

Hansell DA, Carlson CA (1998) Net community production of dissolved organic carbon. Global Biogeochem Cy 12:443-453

Hansell DA, Carlson CA (2001) Biogeochemistry of total organic carbon and nitrogen in the Sargasso Sea: control by convective overturn. Deep-Sea Res II 48:1649-1667 Hansell DA, Carlson CA, Suzuki Y (2002) Dissolved

organic carbon export with North Pacific intermediate water formation. Global Biogeochem Cy 16:77-84 Hong GH, Kim YI, Baskaran M, Kim SH, Chung CS

(2008) Distribution of

210

Po and export of organic carbon from the euphotic zone in the southwestern East Sea (Sea of Japan). J Oceanogr 64:277-292

Kang DJ, Kim K, Kim KR (2004) The past, present and future of the East/Japan Sea in change: a simple moving-boundary box model approach. Prog Ocenogr 61:175-191

Kepkay PE, Wells ML (1992) Dissolved organic carbon in North Atlantic surface waters. Mar Ecol Prog Ser 80:275-283

Kieber DJ, McDaniel J, Mopper K (1989) Photochemical source of biological substrates in sea water: Implications for carbon cycling. Nature 341:637-639

Kim K, Kim KR, Min DH, Volkov Y, Yoon JH, Takematsu M (2001) Warming and structural changes in the East (Japan) Sea: A clue to future changes in global oceans?

Geophy Res Lett 28(17):3293-3296

Kim KR, Kim K (1996) What is happening in the East Sea (Japan Sea)?: recent chemical observations during CREAMS 93-96. J Korean Soc Oceanogr 31:164-172 Kim KR, Kim K, Kang DJ, Park SY, Park MK, Kim YG,

Min HS, Min D (1999) The East Sea (Japan Sea) in change: a story of dissolved oxygen. MTS J 33:15-22 Kim TH, Lee YW, Kim G (2010) Hydrographically mediated

patterns of photosynthetic pigments in the East/Japan Sea: Low N:P ratios and cyanobacterial dominance. J Mar Syst 82:72-79

Lim DB (1971) On the origin of the Tsushima Current Water. J Oceanol Soc Korea 6:85-91

Mopper K, Zhou XL, Kieber RJ, Kieber DJ, Sikorski RJ, Jones RD (1991) Photochemical degradation of dissolved organic carbon and its impact on the oceanic carbon cycle. Nature 353:60-62

Otosaka S, Tanaka T, Togawa O, Amano H, Karasev EV, Minakawa M, Noriki S (2008) Deep sea circulation of particulate organic carbon in the Japan Sea. J Oceanogr 64:911-923

Park GH, Lee K, Tishchenko P (2008) Sudden, considerable reduction in recent uptake of anthropogenic CO

2

by the East/Japan Sea. Geophys Res Lett 20. doi: 10.1029/

2008GL035672

Sharp JH (1997) Marine dissolved organic matter: Are the older values correct? Mar Chem 56:265-277

Sugimura Y, Suzuki Y (1988) A high-temperature catalytic oxidation method for the determination of non-volatile dissolved organic carbon in seawater by direct injection of a liquid sample. Mar Chem 24(2):105-131

Tsunogai S, Watanabe YW, Harada K, Watanabe S, Saito S, Nakajima M (1993) Dynamics of the Japan Sea deep water studied with chemical and radiochemical tracers.

In: Teramoto T (ed) Deep Ocean Circulation, Physical and Chemical Aspects Elsevier, Amsterdam, pp 105-119 Watanabe YW, Watanabe S, Tsunogai S (1991) Tritium in

the Japan Sea and the renewal time of the Japan Sea deep water. Mar Chem 34:97-108

Received Aug. 12, 2010

Revised Sep. 12, 2010

Accepted Sep. 13, 2010

수치

Fig. 3. Horizontal and vertical distributions of DOC, potential temperature, salinity, N/P ratio, DIN, and DIP in the EE transect of the East Sea.
Fig. 4. Horizontal and vertical distributions of DOC, potential temperature, salinity, N/P ratio, DIN, and DIP in the DO transect of the East Sea
Fig. 7. A plot of DOC versus AOU in the deep ocean (&gt;100 m) for the EA and DO transects.

참조

관련 문서

By the way, because the mass rearing of sea cucumber is not achieved until now, culture system to rear sea cucumber in large quantity is required

Characteristics of water quality at East China Sea in southwestern sea of Jeju Island in summer..

platensis under variously mixed medium conditions of low cost medium based on deep sea water.. platensis in the growth medium at 22 days

The KBox A-150-BYT is connected by the Input power connector on the front panel to a DC power source via a DC power supply wiring; consisting of the Phoenix power

The index is calculated with the latest 5-year auction data of 400 selected Classic, Modern, and Contemporary Chinese painting artists from major auction houses..

The “Asset Allocation” portfolio assumes the following weights: 25% in the S&amp;P 500, 10% in the Russell 2000, 15% in the MSCI EAFE, 5% in the MSCI EME, 25% in the

1 John Owen, Justification by Faith Alone, in The Works of John Owen, ed. John Bolt, trans. Scott Clark, &#34;Do This and Live: Christ's Active Obedience as the

The concentration of the dissolved metal as well as that of the adsorbed to solid particles depends mainly on the concentration of the metal in the inflow water