Article
DOI: 10.4217/OPR.2010.32.1.063
Ocean and Polar Research
Effects of Temperature and Stocking Density on the Ammonia Excretion Rate of Red Seabream, Pagrus major
Dicky Harwanto
1, Sung-Yong Oh
2, Chong-Kwan Kim
2, Victor David Nico Gultom
1, and Jae-Yoon Jo
1,3*1
Department of Fisheries Biology
Pukyong National University, Busan 608-737, Korea
2
Marine Living Resources Research Department, KORDI Ansan P.O. Box 29, Seoul 425-600, Korea
3
Tianjin Agricultural University
No. 22 Jinjing Road, Xiqing District, Tianjin, P.R. China
Abstract :
An experiment was conducted to investigate the effects of temperature and stocking density on daily patterns and rates of total ammonia nitrogen (TAN) excretion in juvenile red seabream Pagrus major (mean body weight: 29.0 g) under fasting and feeding conditions. Fish were acclimated over 7 days under four different temperatures (10, 15, 20, and 25
oC) and at two different densities (5.5 and 11.0 kg m
−3). Each treatment had three replicates and a total of 216 fish were used. After 72 hours starvation, endogenous TAN excretion was measured for each temperature and density. To investigate exogenous TAN excretion, fish were handfed a commercial diet containing 51.6% crude protein twice a day for 7 days, at 08:00 and 16:00. Water was sampled from both inlets and outlets of chambers every 2 hours over a 24 hour period.
Both endogenous and exogenous TAN excretion increased with increases in temperature and density (P<0.05). Mean daily endogenous TAN excretion rates at 10, 15, 20, and 25
oC were 88.8, 101.1, 125.0, and 143.3 mg TAN kg
−1d
−1at low density, and 105.2, 119.2, 141.5, and 168.8 mg TAN kg
−1d
−1at high density, respectively. Mean daily exogenous TAN excretion rates at 10, 15, 20, and 25
oC were 343.5, 403.7, 535.7, and 601.7 mg TAN kg
−1d
−1at low density, and 391.9, 479.7, 611.9, and 683.4 mg TAN kg
−1d
−1at high density, respectively. The exogenous TAN excretion rate peaked 10~12 hours after the first feeding under all temperatures and densities. The TAN loss for ingested nitrogen increased with increases in temperature and density (P<0.05), ranging from 27.9 to 50.1% at low density and 31.7 to 56.9% at high density. This study provides empirical data for estimating ammonia excretion and managing the culture of red seabream under the given temperatures and densities.
Key words :
ammonia excretion, Pagrus major , red seabream, stocking density, temperature
1. Introduction
Marine teleosts are predominantly ammonotelic, with 70 to 90% of nitrogen excretion usually being in the form of ammonia (Dosdat et al. 1996). Among the toxic metabolites which accumulate in aquaculture systems, ammonia and nitrite are the most poisonous (Avnimelech 2006). Therefore, ammonia is considered to be a major limiting factor for stocking density and growth in
intensive culture systems. Quantification of ammonia excretion is important for estimating maximum stocking density, the amount of water flow, and the size of biological filters in culture systems (Wu 1995), as well as for assessing the environmental impact of culture operations (Wu 1995; Dosdat et al. 1996).
Ammonia excretion is known to be affected by factors such as water temperature, feeding, ration size, species, and body weight (Leung et al. 1999). In the design and optimization of recirculation aquaculture and waste treatment technologies, it is important to know the
*Corresponding author. E-mail : [email protected]
nitrogen excretion rates of the fish being cultured (Merino et al. 2007b).
Although many studies have been carried out to investigate the ammonia excretion rate of other species in relation to body weight, water temperature, and ration size (Kikuchi et al. 1992; Dosdat et al. 1996; Leung et al.
1999; Merino et al. 2007b; Oh and Choi 2009), there is little information about the ammonia excretion of the red seabream ( Pagrus major ), especially concerning water temperature and stocking density factors. The total ammonia nitrogen (TAN) excretion rate of red seabream as related to the utilization of dietary protein by three different strains was reported by Oh et al. (2004).
The red seabream is one of the most important aquaculture marine finfish species in Korea and is mainly cultured in cages or in land-based flow-through tank systems. However, it takes more than three years to produce market-size fish because winter temperatures are too low for this warm water species (Perez-Enriquez et al.
1999). The optimum water temperature for the growth of red seabream is over 20
oC (Ren et al. 2006; Uyan et al.
2007; Oh et al. 2007; Huang et al. 2007; Biswas et al.
2008; Matsunari et al. 2008), at temperatures lower than 20
oC, food consumption decreases dramatically, and the fish do not eat when the water temperature is under 12
oC (Kim 2000). In Korean waters, the optimum temperature for this species is only maintained from May to October.
Therefore, recirculating aquaculture systems with temperature control are needed to maintain the maximum growth of red seabream. Information on the ammonia excretion rates of this species is thus needed for the proper design of recirculating systems. This study carried out experiments to investigate the effects of water temperature and stocking density on the ammonia excretion of red seabream.
2. Materials and methods
A small-scale closed recirculation system was used for this study. The experimental device consisted of aquaria, a rotating biological contactor (RBC), a header tank, and a reservoir for water storage (Fig. 1). The RBC was employed to support the nitrification process in the experimental system. The RBC was made of 80 round corrugated plastic plates (Ø 60 cm) on an axis, installed in a plywood tank (L:W:D 90:70:60 cm; 360 l ). The RBC was rotated by a reduction motor (Gukje Geared Motor, Model GUA-C-90-B, Korea) at a speed of 4 rpm. The surface area of the RBC was 48.28 m
2. Excess water from the RBC flowed into the reservoir.
A circular header tank made from polyethylene (519 l ) was used to supply water to each aquarium. Water was pumped from the reservoir by a submerged pump (Hanil pump, Model IP-217, Korea) into the header tank. Excess water from the header tank flowed into the RBC. From the header tank, water was distributed to 13 aquaria (L:W:D 39:23:26 cm) and overflow went into the reservoir. Each aquarium contained 17 l of water and the flow rate was adjusted to 36 l h
−1.
Red seabream were brought from the Sea Farming Station of the Korea Ocean Research and Development Institute, Tongyeong, Gyeongsangnam-do, Korea. Fish were transferred to an indoor recirculating system and acclimatized for 1 week in running water at 15
oC. During the acclimation period, fish were acclimated in a stepwise manner to warmer (25
oC) or cooler (10
oC) water by increasing or decreasing the water temperature by 1 or 2
oC d
−1. Following the acclimation period, six fish were randomly distributed into each experimental aquarium to acclimate to the experimental system under each temperature
Fig. 1. Schematic diagram of the system used for measuring the TAN excretion rate of red seabream (RBC: rotating
biological contactor).
condition. Fish were fed ad libitum twice daily at 08:00 and 16:00 with commercial sinking pellets that contained 51.6% crude protein. After 1 week of acclimation in the experimental system, fish were fasted for 1 day and weighed before the start of the experiment.
Red seabream with a mean initial body weight of 29 g were used for testing endogenous and exogenous TAN excretion under two different densities. Six aquaria were stocked with three fish each to form the low-density groups (5.5 kg m
−3, total 72 fish), and another six aquaria were stocked with six fish each to form the high-density groups (11.0 kg m
−3, total 144 fish). Three aquaria each in the low- and high-density groups were divided into two treatment groups to study endogenous and exogenous TAN excretion. A control aquarium was treated the same as the other aquaria, except for the fact that no fish were stocked. All fish were fed twice daily (08:00 and 16:00) at 1.6% of their body weight for 1 week. Then fish in the endogenous TAN excretion study groups at both densities were not fed for 72 hours while the exogenous ammonia excretion study groups continued to be fed. All treatments were conducted in triplicate.
Once the endogenous and exogenous TAN excretion tests at a given temperature had been completed, all fish were replaced with new fish. Each new temperature effect test was begun after 1 week of temperature conditioning.
The TAN excretion ratio as a proportion of ingested nitrogen (%) was also calculated for every temperature treatment.
Dissolved oxygen (DO), temperature, and pH were measured every 2 hours over a 24 hour period in each aquarium. DO and temperature were measured using an oxygen meter (Oxyguard
®, Handy Mk III, USA), and pH was measured using a pH meter (Ecomet
®, P25, USA).
Salinity was measured twice per day using a Refrac- tometer (ATAGO
®, Japan). For TAN, concentrations in the inlet and outlet of each aquarium were measured every 2 hours for a 24 hour period using a TAN meter (ORION
®Model 720A, USA). All measurements followed the methods described by the American Public Health Association (APHA 1995). The TAN excretion rate of the fish was calculated using the following equation:
TAN (mg kg
−1h
−1)={( C
o−C
1)
−( C
c−C
1) } W
−1where C
1is the TAN concentration (mg l
−1) at the inflow, C
ois the TAN concentration at the outflow of the experimental chamber, C
cis the TAN concentration at the outflow of the control chamber, ( dv / dt )
1is the flow rate ( l
−1)
through the experimental chamber, ( dv / dt )
2is the flow rate of the control chamber, and W is the wet body weight (kg) of the fish.
By plotting TAN excretion (mg kg
−1h
−1) against time, the TAN excreted over the 24 hour period (mg kg
−1d
−1) was determined by integrating the area under the curve (Leung et al. 1999). The mean daily TAN excretion rate was also calculated for each treatment.
Statistical analysis
All statistical analysis was performed using MINITAB:
Release 14. The effects of the two densities on TAN excretion were compared using a t- test, and the effects of temperature were examined using one-way analysis of variance (ANOVA). Differences were analyzed using Tukey’s-HSD test to reveal significant differences (P<0.05).
Interactive effects of temperature and density on TAN excretion rates were analyzed using two-way ANOVA.
dv dt ---
⎝ ⎠⎛ ⎞
1
dv dt ---
⎝ ⎠⎛ ⎞
2
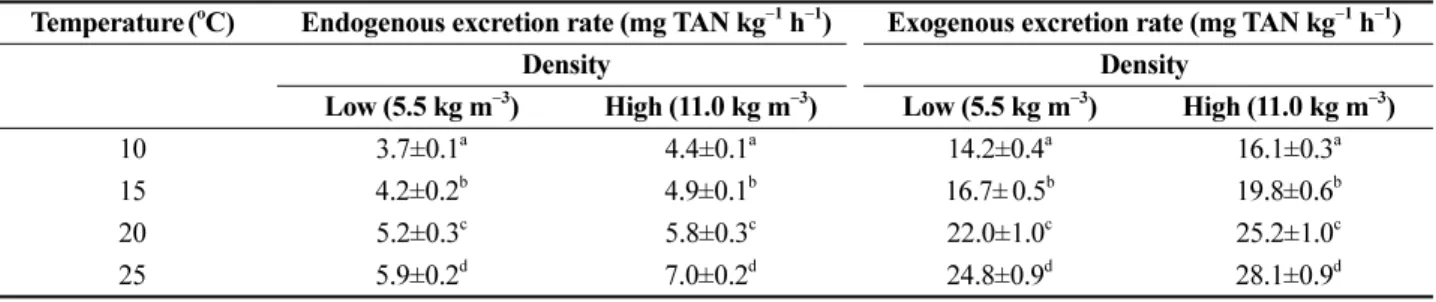
Fig. 2. Fluctuations in the endogenous TAN excretion
rate of red seabream ( Pagrus major ) at low density
(a) and high density (b) under four different tem-
perature regimes (10, 15, 20, and 25
oC). Values
(means of triplicates±SD) with different letters at
the same density are significantly different
(P<0.05). Time 0 on the X axis means 08:00.
3. Results
Endogenous TAN excretion rate
The patterns of the endogenous TAN excretion rates of fasted red seabream under combinations of temperatures (10, 15, 20, and 25
oC) and densities (5.5 and 11 kg m
−3) did not change greatly with time (Fig. 2). However, the rates were strongly related to changes in temperatures and densities. The average endogenous TAN excretion rates of fish at 10, 15, 20, and 25
oC at low density were 3.7, 4.2, 5.2, and 5.9 mg kg
−1h
−1, respectively, and those at high density were 4.4, 4.9, 5.8, and 7.0 mg kg
−1h
−1, respectively (Table 1).
The TAN excretion of red seabream significantly increased with increasing temperature, and fish in high- density groups exhibited significantly higher TAN excretion than did fish in low-density groups. Under fasting conditions, the daily TAN excretions of red seabream in low-density groups at 10, 15, 20, and 25
oC were 88.8, 101.1, 125.0, and 143.3 mg kg
−1d
−1, while those in high-
density groups were 105.2, 119.2, 141.5, and 168.8 mg kg
−1d
−1, respectively (Table 2). The relationship between endogenous TAN excretion rate (Y) and temperature (T) at low density was Y=18.746 T+67.66 (R
2=0.9865) and that at high density was Y=21.306 T+80.416 (R
2= 0.9804) (Table 2).
Exogenous TAN excretion rate
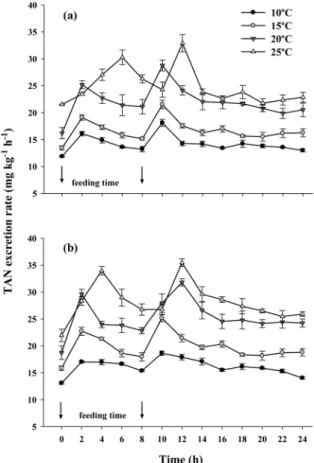
The patterns of exogenous TAN excretion rates of fed red seabream were similar for all temperature regimes at both densities (Fig. 3). However, TAN excretion rates were more variable for exogenous than for endogenous excretion. The average exogenous TAN excretion rates of fish at 10, 15, 20, and 25
oC at low density were 14.2, 16.7, 22.0, and 24.8 mg kg
−1h
−1, respectively, and those at high density were 16.1, 19.8, 25.2, and 28.1 mg kg
−1h
−1, respectively (Table 1).
Two peaks were noticeable in exogenous TAN excretion rates, and the second peak was always higher than the first one. The highest peak in exogenous TAN excretion rates Table 1. Hourly TAN excretion rates of two density groups (5.5 and 11.0 kg m
-3) of red seabream ( Pagrus major ) under
four different temperature regimes (10, 15, 20, and 25
oC)
Temperature (
oC) Endogenous excretion rate (mg TAN kg
−1h
−1) Exogenous excretion rate (mg TAN kg
−1h
−1)
Density Density
Low (5.5 kg m
−3) High (11.0 kg m
−3) Low (5.5 kg m
−3) High (11.0 kg m
−3)
10 3.7±0.1
a4.4±0.1
a14.2±0.4
a16.1±0.3
a15 4.2±0.2
b4.9±0.1
b16.7± 0.5
b19.8±0.6
b20 5.2±0.3
c5.8±0.3
c22.0±1.0
c25.2±1.0
c25 5.9±0.2
d7.0±0.2
d24.8±0.9
d28.1±0.9
dValues (mean of triplicates±SD) with different letters in same density are significantly different (P<0.05).
Table 2. Daily TAN excretion rates of two density groups (5.5 and 11.0 kg m
−3) of red seabream ( Pagrus major ) under four different temperature regimes (10, 15, 20, and 25
oC)
Temperature (
oC) Endogenous excretion rate (mg TAN kg
−1d
−1) Exogenous excretion rate (mg TAN kg
−1d
−1)
Density Density
Low (5.5 kg m
−3) High (11.0 kg m
−3) Low (5.5 kg m
−3) High (11.0 kg m
−3)
10 88.8±0.9
a105.2±2.5
a343.5±6.6
a391.9±3.2
a15 101.1±1.7
b119.2±0.6
b403.7± 4.6
b479.7±13.2
b20 125.0±5.5
c141.5±4.8
c535.7±15.3
c611.9±12.7
c25 143.3±1.1
d168.8±5.3
d601.7±5.4
d683.4±3.5
dRegression Y = 18.746 T + 67.66
(R
2= 0.9865) Y = 21.306 T + 80.416
(R
2= 0.9804) Y = 90.68 T + 244.47
(R
2= 0.9772) Y = 100.66 T + 290.09 (R
2= 0.9880) Two-way
Temperature Density Interaction
P=0.000 P=0.000 P=0.007
P=0.000
P=0.000
P=0.100
Values (mean of triplicates±SD) with different letters in same density are significantly different (P<0.05).
in low-density groups at 10, 15, and 20
oC occurred 10 hours after the first feeding, while the highest peak at 25
oC occurred 12 hours after the first feeding. Peak values for each temperature were 18.1, 21.5, 28.8, and 32.9 mg kg
−1h
−1, respectively. The highest peak of exogenous TAN excretion rates at high density occurred at the same times as for the low-density groups, with peak values at each temperature of 18.6, 25.2, 31.8, and 35.5 mg kg
−1h
−1, respectively.
Daily exogenous TAN excretion rates of red seabream at low density were always significantly lower than those at high density and rates increased significantly with increasing temperature (Table 2). The daily TAN excretion rates of red seabream under low density at 10, 15, 20, and 25
oC were 343.5, 403.7, 535.7, and 601.7 mg kg
−1d
−1, respectively, while those under high density were 391.9, 479.7, 611.9, and 683.4 mg kg
−1d
−1, respectively. The relationship between the exogenous TAN rate (Y) and temperature (T) at low density was Y=90.68 T+244.47 (R
2=0.9772) and at high density was Y=100.66 T+
290.09 (R
2=0.9880) (Table 2).
Ratio of TAN excretion as a proportion of ingested nitrogen
Daily ingested nitrogen per unit body weight for both densities under the four different temperature regimes was not significantly different (Table 3). However, TAN excretions as a proportion of ingested nitrogen (%) for red seabream in low-density groups were significantly lower than for high-density groups at 10, 15, 20, and 25
oC. The Fig. 3. Fluctuations in the exogenous TAN excretion rate
of red seabream ( Pagrus major ) at low density (a) and high density (b) under four different tempera- ture regimes (10, 15, 20, and 25
oC). Values (means of triplicates±SD) with different letters at the same density are significantly different (P<0.05).
Time 0 in the X axis means 08:00.
Table 3. Ratio of TAN excretion as a proportion of nitrogen ingested (%) of two density groups (5.5 and 11.0 kg m
−3) of red seabream ( Pagrus major ) at four different temperature regimes (10, 15, 20, and 25
oC)
Temperature
(
oC) Density
(kg m
−3) Ingested N
(mg kg
−1d
−1) TAN excretion rate
(mg kg
−1d
−1) Ratio of TAN excretion (% of ingested N)
10 15.5±0.0 1230.3±0.4
a343.5±6.6
a27.9±0.5
a10.8±0.1 1238.4±6.8
a391.9±3.2
b31.7±0.1
b15 15.3±0.0 1229.7±5.2
a403.7±4.6
a32.8±0.2
a10.8±0.3 1227.3±7.5
a479.7±13.2
b39.1±0.8
b20 15.6±0.2 1211.4±4.6
a535.7±15.3
a44.2±1.1
a11.1±0.2 1222.5±6.4
a611.9±12.7
b50.1±1.1
b25 15.8±0.0 1200.8±6.1
a601.7±5.4
a50.1±0.2
a11.4±0.2 1201.2±6.3
a683.4±3.6
b56.9±0.1
bTwo-way Temperature
Density Interaction
P=0.000 P=0.000 P=0.023
Values (mean of triplicates±SD) in same temperature with different letters are significantly different (P<0.05).
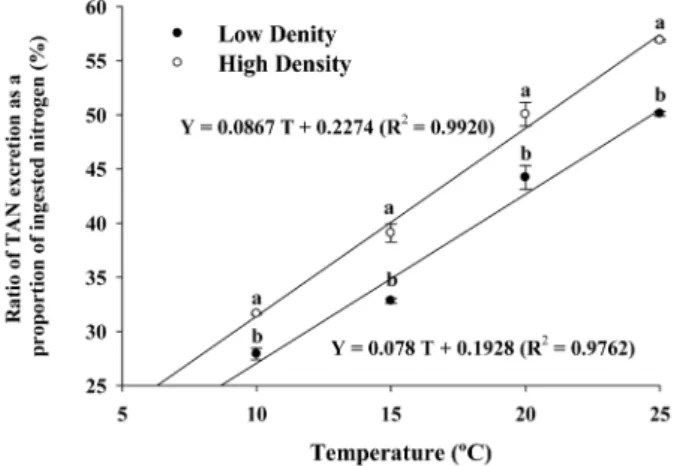
ratios of TAN excretion of ingested nitrogen of fish at low density under 10, 15, 20, and 25
oC were 27.9, 32.8, 44.2, and 50.1%, respectively, while those at high density were 31.7, 39.1, 50.1, and 56.9%, respectively.
The ratio of TAN excretion also increased significantly with increasing temperature at both densities. The relationship between the TAN excretion ratio (Y) as a proportion of ingested nitrogen and temperature (T) at low density was Y=0.078 T+0.1928 (R
2=0.9762) and that at high density was Y=0.0867 T+0.2274 (R
2=0.9920) (Fig. 4). Two-way ANOVA showed a significant interaction between density and temperature on the ratio of TAN excretion (P=0.023) (Table 3).
4. Discussion
Endogenous TAN excretion rate
The patterns of hourly endogenous TAN excretion rates for each temperature regime were almost constant over a 24 hour period with ranges of 3.7 to 5.9 mg kg
−1h
−1at low density and 4.4 to 7.0 mg kg
−1h
−1at high density. These results were similar to those of previous studies (Kikuchi et al. 1992; Oh and Choi 2009). The hourly endogenous TAN excretion rates of juvenile and young olive flounder ( Paralichthys olivaceus ) were almost constant over 24 hours (Kikuchi et al. 1992). Furthermore, Oh and Choi (2009) found that the endogenous TAN excretion rates of dark-banded rockfish ( Sebastes inermis ) did not change much during 24 hours under three different temperature regimes (15, 20, and 25
oC). However, in the present study,
increased endogenous TAN excretion rates were observed under higher temperatures and density.
The daily endogenous TAN excretion rates of red seabream showed ranges of 88.8~143.3 mg kg
−1d
−1at low density and 105.2~168.8 mg kg
−1d
−1at high density and were comparable with results from Oh and Choi (2009).
In fasting conditions, TAN excretion rates were increased with increasing water temperature. Oh and Choi (2009) reported that the endogenous TAN excretion rates of dark- banded rockfish at 15, 20, and 25
oC were 194.0, 215.5, and 221.8 mg kg
−1d
−1, respectively. The values of endogenous TAN excretion rates at low and high density under temperatures of 10, 15, 20, and 25
oC in this study were slightly lower than those recorded by Oh and Choi (2009). These differences may be due to differences in species and body weight. In the present study, 29 g red seabream were used. Oh and Choi (2009) were testing 15 g dark-banded rockfish. Decreases in TAN excretion rate with increasing fish body weight are in agreement with the studies of Kikuchi et al. (1992) and Dosdat et al. (1996).
Increasing endogenous TAN excretion rates at higher temperatures indicate that higher metabolic demands at elevated temperatures are partially met via deamination of amino acids from the fish body (Forsberg and Summerfelt 1992). The increase in the ammonia excretion rate with increasing fish density reflects a higher metabolic rate at higher densities. This increase in metabolic rate probably occurs due to the stress condition of fish. High density is considered to be a potential source of stress, with negative effects on fish growth rate (Lefrancois et al. 2001), survival, and feeding rate (Bjornsson and Olafsdottir 2006; Rowland et al. 2006). The negative effects of high fish stocking density on the growth of California halibut ( Paralichthys californicus ) juveniles were reported by Merino et al. (2007a). The growth of California halibut decreased significantly with increasing density (1.18, 1.06, and 0.88% d
−1at 2404, 4579, and 6795 g of biomass, respectively).
Negative effects of high density on fish performance are generally associated with water quality deterioration and increases in aggressive behavior (Ellis et al. 2002).
Sammouth et al. (2009) reported that water TAN concen- trations were significantly higher at a density of 40 kg m
−3than at 10 kg m
−3for seabass ( Dicentrarchus labrax ) with values of 1.44 and 1.03 mg l
−1, respectively. Furthermore, the high stocking densities used generally require high water exchange rates to remove metabolic by-products (Lawson 1995; Bjornsson and Olafsdottir 2006; Foss et al.
2006).
Fig. 4. Ratio of TAN excretion as a proportion of ingested
nitrogen for two stocking densities of red seabream
( Pagrus major ) under four different temperature
regimes (10, 15, 20, and 25
oC). Values (means of
triplicates±SD) at the same temperature with differ-
ent letters are significantly different (P<0.05).
Exogenous TAN excretion rate
The exogenous TAN excretion rate of red seabream increased significantly with increasing temperature and density. The patterns of hourly exogenous TAN excretion rates fluctuated and peaks were reached between 10 and 12 hours after first feeding under all temperature regimes with values ranging from 18.1 to 32.9 mg kg
−1h
−1in low- density groups and 18.6 to 35.5 mg kg
−1h
−1in high- density groups. The average values of hourly exogenous TAN excretion rates ranged from 14.2 to 24.8 mg kg
−1h
−1and 16.1 to 28.1 mg kg
−1h
−1at low and high density, respectively. These results are comparable with those of other studies (Dosdat et al. 1996; Leung et al. 1999; Oh et al. 2004; Merino et al. 2007b; Zheng et al. 2008).
Dosdat et al. (1996) studied the comparison of nitrogenous losses in five teleost fish: seabass ( Dicentrarchus labrax ), turbot ( Scophthalmus maximus ), seabream ( Sparus auratus ), brown trout ( Salmo trutta fario ), and rainbow trout ( Oncorhynchus mykiss ) and found similar results to those recorded in the present study. They used 10 g fish of all species that were fed twice daily and found two peaks, with the second peak always larger than the first. The highest peaks for all fish were reached between 10 and 12 hours after first feeding.
Leung et al. (1999) observed that a peak rate of TAN excretion of 30-200 g wet weight mangrove snapper ( Lutjanus argentimaculatus ) occurred 6 hours after feeding at 15 and 20
oC. At higher temperatures, peak rates were observed 8 hours after feeding at 25
oC and 11 hours after feeding at 30
oC. For 40-250 g areolated grouper ( Epinephelus areolatus ), the peak rates of TAN excretion at 15, 20, 25, and 30
oC were observed 12, 6, 2, and 7 hours after feeding, respectively.
Oh et al. (2004) reported peak rates of TAN excretion from three strains of juvenile red seabream (Japanese strain, hybrid strain between Japanese and selected Korean strain, and Korean strain) of 49.0, 58.7, and 32.7 mg kg
−1h
−1, respectively. The peak values were higher than those recorded in the present study, since they used smaller sizes of fish (17-21 g) than those used in this study (29 g).
Merino et al. (2007b) found that the average TAN excretion pattern of California halibut with body sizes of 4.2, 7.2, 10.4, 20.1, 111.7, and 198.5 g showed the highest peak 12-14 hours after feeding started and that the average hourly exogenous ammonia excretion values for the fish of different sizes were 13.9, 11.8, 11.5, 12.0, and 13.0 mg kg
−1h
−1, respectively.
Hourly TAN excretion rates of juvenile dark-banded
rockfish increased with increasing temperature (Oh and Choi 2009). Following feeding, the TAN excretion rate started to increase; the first peak was reached 6 hours after feeding and the second peak was reached 4 hours after the second feeding or 14 hours after the first feeding. The TAN excretion rate value of the second peak was always higher than that of the first peak. The values of the highest peaks of the exogenous TAN excretion rate at 15, 20, and 25
oC were 28.7, 33.7, and 36.7 mg kg
−1h
−1, respectively, with average values of 20.1, 22.9, and 23.4 mg kg
−1d
−1, respectively.
The effects of water temperature on the TAN excretion rate of juvenile miiuy croaker ( Miichthys miiuy ) have been also reported (Zheng et al. 2008). The TAN values increased significantly from 5.58 to 19.14 mg kg
−1h
−1when the water temperature was increased from 6 to 10
oC.
The daily exogenous TAN excretion rates of red seabream in this study were within the general range reported for other species (Dosdat et al. 1996; Leung et al.
1999; Merino et al. 2007b; Oh and Choi 2009). The daily exogenous TAN excretion rates of seabass, turbot, seabream, brown trout, and rainbow trout of 10 g were 454.3, 411.7, 411.7, 411.6, and 355.5 mg kg
−1d
−1, respectively, while those of 100 g fish were 151.8, 74.0, 108.0, 127.3, and 152.4 mg kg
−1d
−1, respectively (Dosdat et al. 1996). Leung et al. (1999) reported that the daily exogenous TAN excretion rate of areolated grouper with a mean body weight of 125 g was 375.7 mg TAN kg
−1d
−1, while that of mangrove snapper with a mean body weight of 138 g was 558.3 mg kg
−1d
−1. The exogenous TAN excretion rates of California halibut at body weights of 4.2, 7.2, 10.4, 20.1, 111.7, and 198.5 g were 101.9, 102.7, 102.2, 94.1, 83.2, and 82.7 mg kg
−1d
−1, respectively, as also reported by Merino et al. (2007b). According to Oh and Choi (2009), the daily TAN excretion rates of juvenile dark banded rockfish at 15, 20, and 25
oC were 501.2, 569.0, and 583.0 mg kg
−1d
−1, respectively.
Ratio of TAN excretion as a proportion of ingested nitrogen
In this study, the ratio of TAN excretion as a proportion
of ingested nitrogen (%) increased significantly with
increasing temperature and density. Fish with the same
feeding rate showed almost the same amount of ingested
nitrogen, but excreted more TAN, under higher temperatures
and densities. According to Forsberg and Summerfelt
(1992), the increasing TAN excretion rates at higher
temperatures were due to the higher metabolic demands at
elevated temperatures. Increasing TAN excretion rates with increasing density are probably due to the stress condition of the fish (Lawson 1995; Lefrancois et al.
2001; Ellis et al. 2002; Bjornsson and Olafsdottir 2006;
Foss et al. 2006; Rowland et al. 2006; Merino et al.
2007b).
The ratios of TAN excretion in this study (in the range of 27.9-50.1% and 31.7-56.9% at low and high density, respectively) were comparable with results from other studies (Kikuchi et al. 1992; Dosdat et al. 1996; Oh and Choi 2009). According to Kikuchi et al. (1992), the proportions of nitrogenous excretion of juvenile and young olive flounder to the ingested amount of nitrogen were 22.7% and 20.7%. Dosdat et al. (1996) found that the ratios of TAN excretion to ingested nitrogen of 10 g mean body weight seabass, seabream, turbot, brown trout, and rainbow trout were 47, 55, 28, 40, and 37%, respectively. For the same species of fish with mean body weights of 100 g, the ratios were 43, 43, 29, 37, and 42%, respectively. The ratios of TAN excretion to ingested nitrogen of juvenile dark banded rockfish at 15, 20, and 25
oC were 36.2, 40.8, and 41.7%, respectively (Oh and Choi 2009).
5. Conclusion
The TAN excretion of red seabream increased significantly with increasing temperature and fish density.
Based on the present results, increasing water temperature and fish density lead to increasing nitrogen metabolism rates of red seabream.
In the group of fasting fish, patterns of hourly endogenous TAN excretion rates under each temperature regime were almost constant over 24 hours. For the group of fish fed twice a day, patterns of the hourly exogenous TAN excretion rate fluctuated and two peaks in TAN excretion rate occurred. Higher concentrations of TAN will lead to water quality deterioration. Thus, recirculating systems are needed to remove the TAN from the water.
With information on the TAN excretion rates of cultured species, appropriate actions for removing TAN from the water can be determined. The present results suggest actions for removing TAN from red seabream culture under given temperature and density, either by increasing the water loading rate or increasing biofilter performance.
Acknowledgements
Funding was provided by the Korea Ocean Research
and Development Institute through project PE98473.
References
APHA (1995) Standard methods for the examination of water and wastewater, 19th ed. APHA/AWWA/WEF, Washington DC, USA
Avnimelech Y (2006) Bio-filters: the need for a new com- prehensive approach. Aquacult Eng
34(3):172-178 Biswas AK, Seoka M, Ueno K, Takii K, Kumai, H (2008)
Stimulation of growth performance without causing stress response in young red sea bream, Pagrus major (Temminck & Schlegel), by photoperiod manipulation.
Aquacult Res
39(5):457-463
Bjornsson B, Olafsdottir SR (2006) Effects of water quality and stocking density on growth performance of juvenile cod ( Gadus morhua L.). ICES J Mar Sci
63:326-334 Dosdat A, Servais F, Metailler R, Huelvan C, Desbruyeres E
(1996) Comparison of nitrogenous losses in five teleost fish species. Aquaculture
141(1-2):107-127
Ellis T, North B, Scott AP, Bromage NR, Porter M, Gadd D (2002) The relationships between stocking density and welfare in farmed rainbow trout. J Fish Biol
61(3):493- Forsberg JA, Summerfelt RC (1992) Effect of temperature 531 on diel ammonia excretion of fingerling walleye. Aquac- ulture
102(1-2):115-126
Foss A, Kristensen T, Atland A, Hustveit H, Hovland H, Ofsti A, Imsland AK (2006) Effects of water reuse and stocking density on water quality, blood physiology and growth rate of juvenile cod ( Gadus morhua ). Aquacul- ture
256(1-4):255-263
Huang SSY, Higgs DA, Brauner CJ, Satoh S (2007) Effect of dietary canola oil level on the growth performance and fatty acid composition of juvenile red sea bream, Pagrus major . Aquaculture
271(1-4):420-431
Kikuchi K, Takeda S, Honda H, Kiyono M (1992) Nitroge- nous excretion of juvenile and young Japanese flounder.
Nippon Suisan Gakkaishi
58:2329-2333
Kim IB (2000) Finfish culture. Goodeok Print Co. Busan, 433 p
Lawson TB (1995) Fundamentals of aquaculture engineer- ing. Chapman and Hall, New York, USA, 355 p
Lefrancois C, Claireaux G, Mercier C, Aubin J (2001) Effect of density on the routine metabolic expenditure of farmed rainbow trout ( Oncorhynchus mykiss ). Aquacul- ture
195(3-4):269-277
Leung KMY, Chu JCW, Wu RSS (1999) Effects of body weight, water temperature and ration size on ammonia excretion by the areolated grouper ( Epinephelus areolatus ) and mangrove snapper ( Lutjanus argentimaculatus ).
Aquaculture
170(3-4): 215-227
Matsunari H, Furuita H, Yamamoto T, Kim SK, Sakakura Y,
Takeuchi T (2008) Effect of dietary taurine and cystine
on growth performance of juvenile red sea bream
Pagrus major . Aquaculture
274(1):142-147
Merino GE, Piedrahita RH, Conklin DE (2007a) The effect of fish stocking density on the growth of California hali- but ( Paralichthys californicus ) juveniles. Aquaculture
265
(1-4):176-186
Merino GE, Piedrahita RH, Conklin DE (2007b) Ammonia and urea excretion rates of California halibut ( Paralich- thys californicus , Ayres) under farm-like conditions.
Aquaculture
271(1-4):227-243
Oh SY, Noh CH, Hong KP, Jong MK (2004). Total ammo- nia nitrogen excretion rates and feces production rates as an index for comparing efficiency of dietary protein uti- lization of offsprings from selected Korean strain, cul- tured Japanese strain and their intraspecific hybrid strain of juvenile red sea bream, Pagrus major . Ocean and Polar Res
26(3):415-423
Oh SY, Choi SJ (2009). Effect of water temperature on ammonia excretion of juvenile dark-banded rockfish S ebastes inermis . Ocean and Polar Res
31(3):231-238 Oh SY, Noh CH, Cho SW (2007) Effect of restricted feed-
ing regimes on compensatory growth and body composi- tion of red sea bream, Pagrus major . J World Aquacult Soc
38(3):443-449
Perez-Enriquez R, Takagi M, Taniguchi N (1999) Genetic variability and pedigree tracing of a hatchery-reared stock of red sea bream ( Pagrus major ) used for stock enhancement, based on microsatellite DNA markers.
Aquaculture
173(1-4):413-423
Ren T, Koshio S, Teshima S, Ishikawa M, Yokohama S,
Michael FR, Uyan O (2006) The efficiency of L-ascor- bic acid in micro bound diet for larval red sea bream ( Pagrus major ). Aquacult Sci
54(4):561-566
Rowland SJ, Mifsud C, Nixon M, Boyd P (2006) Effects of stocking density on the performance of the Australian freshwater silver perch ( Bidyanus bidyanus ) in cages.
Aquaculture
253(1-4):301-308
Sammouth S, d’Orbcastel ER, Gasset E, Lemarie G, Breuil G, Marino G, Coeurdacier JL, Fivelstad S, Blancheton JP (2009) The effect of density on sea bass ( Dicentrarchus labrax ) performance in a tank-based recirculating sys- tem. Aquacult Eng
40(2):72-78
Uyan O, Koshio S, Teshima S, Ishikawa M, Michael FR, Ren T, Laining A (2007) Effect of tuna muscle powder in diet on the growth and phosphorus loading of juve- nile red sea bream, Pagrus major . Aquacult Sci
55(1):
29-40
Wu RSS (1995) The environmental impact of marine fish culture: towards a sustainable future. Mar Pollut Bull
31