고해상도 영상을 이용한 샘플영역의 크기별 수종분류 정확도 향상을 위한 연구
A study for Improvement the Accuracy of Tree Species Classification within Various Sizes of Training Sample Areas by Using the High-resolution Images
Jin Sung Hou ․ Keum Chul Yang
⁺Department of Civil & Environmental Engineering, Kongju National University, Cheonan, Korea
요 약
본 연구는 고해상도 위성영상과 항공영상을 이용하여 샘플영역의 크기 변화에 따른 수종분류 시 정확도와 신뢰도에 미치
는 영향을 객관적으로 규명하고 그 경향성을 파악하는데 목적이 있다 영상이 포함하고 있는 밴드들의 특성을 모두 고려.
하여 수종분류를 실시하기 위해 위성영상과 항공영상 각각에 대해 다중분광영상을 제작하였으며 이를 기반으로 감독분,
류를 수행하였다 그리고 정확도 검증단계에서 전체정확도를 산출하였으며 그 결과 위성영상의. , 3*3에서 84.7%, 항공영상 은 5*5에서 83%로 가장 높게 나타났으며 Kappa 계수는 각각0.84, 0.82로 나타났다 또한 두 영상의 샘플영역의 크기가. 작아질수록 정확도가 높아지는 것으로 판단된다.
핵심용어: 감독분류 분광정보 위성영상 항공사진, , ,
Abstract
The purpose of this study was to investigate the objective impact in accuracy and reliability with tendency depend on training samples by using the high-resolution images. Supervised classification was performed based on multi-spectral images which made by each satellite and aerial images for considering all of bands’ characteristics. The highest accuracy was 84.7% with satellite image(3*3) and 83% with aerial image(5*5) at the accuracy verification phase. Also, the overall accuracy with the consideration of Kappa coefficient were 0.84 for satellite images and 0.82 for aerial images. In all of the images, the smaller training sample was, the higher accuracy showed. Therefore, tree species classification accuracy was tended to rely on training sample size.
keywords : Supervised classification, Digital numbers, Satellite imagery, Aerial photography
서 론 1.
년에 개최된 유엔환경개발회의 이후
1992 (UNCED)
제기된 지속가능한 개발 의 원칙은 산림에 대한 가‘ ’ 치관이 경제성과 함께 공익적 · 환경적 · 생태적 기 능을 중시하는 방향으로 전환하는 계기를 마련하게 되었다(Chung, 2011). 하지만 약 100년간 지구 온난 화로 인하여 지구상의 온도는 0.74℃ 상승하였으며, 우리나라의 평균 기온 상승률은 1.7℃로 지구 평균 기온 상승률 보다 높게 나타났다(IPCC, 2007). 우리 나라는 주요 온실가스인 이산화탄소 배출량이 2013 년도 세계 위 국가로서 온실가스를 감축하기 위해7 ,
흡수원을 확충해야 한다 이에 따라 산림이 국토의. 면적 약 65% 이상을 차지하고 있는 우리나라에서 산림현황을 체계적으로 조사관리 하는 것이 시급한 실정이며 많은 연구들이 진행 중이다 하지만 산림, . 의 지형적 구조적 특성상 사람에 의한 현장조사가, 용이하지 않은 경우가 빈번하여 산림의 특성을 정량 적 정성적으로 파악하기 어렵다, (Chang et al., 2006).
또한 2013년부터 기존 임상도 및 생태자연도의 조사 주기가 10년에서 년 주기로 단축되어 연간 조사 도5 엽량이 크게 증가하기 때문에 이에 대한 효율적이고 체계적인 조사 방안 수립이 시급한 실정이다(Park et al., 2013).
따라서 고해상도 영상을 이용한 식생분류 가 시급하며 정확도 또한 요 (Vegetation Classification)
구되어지고 있다 수행된 연구들은 토지피복분류 위주. 의 연구들 (Ha et al., 2002; Kwon et al., 2003; Oh et 이며 같은 이 al., 2010; Lee et al., 2011; Kang, 2012) ,
론적 개념을 바탕으로 수종분류(Tree Species 를 위한 고해상도 영상을 활용한 연구들 Classification)
이 있다. Katoh(2004)는 고해상도 영상인 IKONOS 영 상을 이용해 영상밴드별 분광특성을 분석하고 영상밴 드와 식생지수를 조합하여 혼합림에서의 감독분류를 연구하였으며, Timothy et al(2012)은 사바나에서의 자 동분류를 수행하였고, Brandtberg(2002)는 fuzzy 기준점 을 설정하여 각 수종별 수관에 따라 객체를 구분하였 다 그러나 고해상도 영상을 이용하여 자동으로 수종. 분류 시 샘플영역의 크기에 따른 정확도 검증 및 신 뢰도 차이에 대한 연구는 미흡한 실정이다.
따라서 본 연구에서는 기존의 연구에서 사용된 영 상들보다 높은 공간해상도를 가진 위성영상(0.5m) ,과 항공영상(0.12m)을 활용하여 샘플영역의 크기 변화에 따라 수종분류 시 정확도와 신뢰도에 미치는 영향을 객관적으로 규명하고 그 경향을 파악하는데 목적이 있다.
연구방법 2.
연구대상지역 2.1
본 연구는 고해상도 위성영상과 항공영상을 이용 하여 수종분류 시 샘플영역의 크기가 감독분류에 정 확도에 미치는 영향을 현지조사 결과와 비교 분석하· 여 자동분류의 가능성을 보다 효율적으로 제시하기 위한 목적이므로 영상자료 획득이 가능하고 현지 접, 근이 용이하며 수종구성이 다양한 지역을 대상으로 선정하였다.
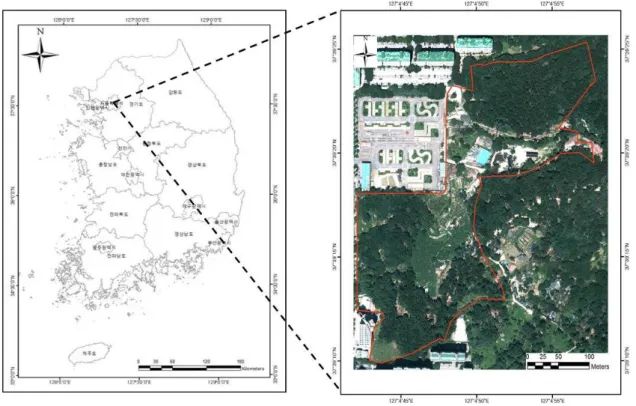
연구대상지는 환경부 자연마당 조성 서울지역 대( ) 상지로서 서울시 노원구 중계동 산, 42-3번지 일원에 위치하고 있다 총 면적은. 79,321.8m2(Fig. 1)이며 대, 상지를 포함하고 있는 노원구 통계연보에 의하면, 년의 연평균 기온은 연강수량은 1999~2012 12.7 ,℃
이다 이러한 결과는 도심이 밀집한 1576.2mm(Fig. 2) .
강남 강서지역에 비교하여 연평균 기온은 상대적으, 로 낮고 연강수량은 지형성 강수의 영향으로 높게, 나타난 것으로 판단된다.
현지조사 결과 상수리나무 군락이 우점하고 있 는 것으로 나타났으며 그 외에도 활엽수로는 신갈나, 무 밤나무 아까시나무 등과 침엽수로는 리기다소나, , 무 향나무 스트로브 잣나무 등이 분포하고 있으며, , , 조사된 수종의 정보는Table 1과 같다.
Fig. 1 Location of the study area in Nowongu, Seoul, Korea.
Fig. 2 A recent annual mean precipitation and air temperature in Nowongu(1999-2012).
Family Tree species(Abbreviation) DBH(cm) Crown diameter(m) Samples
Conifers
Ginkgoaceae
Ginkogo biloba(Gb)
39.3-109 7.8-16.9 3Pinaceae
Pinus rigida (Pr)
17-24 3.8-4.1 3Pinus strobus(Ps)
15.2-18.4 3.6-4.7 3Cupressaceae
Juniperus chinensis(Jch)
38.4-40.6 4.8-8.3 2Deciduous trees
Fagaceae
Castanea crenata(Cac)
13-26.5 6.3-10.7 4Quercus acutissima (Qa)
32-47.5 5.6-16.8 3Quercus mongolica(Qm)
28 8.6 1Quercus aliena(Qal)
47.8 14.5 1Rosaceae
Prunus sargentii(Prs)
28 7.2 1Pyrus pyrifolia(Pp)
10.9-16.2 4.7-4.9 2Leguminosae
Robinia pseudoacacia(Rop)
37-40.8 3.9-6.6 3Scrophulariaceae
Paulownia coreana(Pc)
39.6-43.6 7-7.2 2Salicaceae
Salix koreensis(Sk)
26.4-31.5 6.9-7.8 2Ulmaceae
Zelkova serrata(Zs)
32.9-49.2 10-13.5 3Table 1. Tree species, its DBH (Diameter at breast height in centimeter), and crown diameter in meter in the study, and their abbreviations and their sample numbers in Nowon-gu, Seoul, Korea.
재료 및 방법 2.2
본 연구에 사용된 고해상도 위성영상과 항공영상 의 공간해상도는 각각 0.5m, 0.12m이며 위성영상은,
년에 발사된 디지털글로브 사의
2008 (Digital Glove) 항공영상은 사에서 개발된 GeoEye-1, VEXEL Ultra
로 촬영되었다 촬영 시기는 위성영상의 경우 cam XP .
년 월 항공영상은 년 월이며 각각의 영상 2012 8 , 2011 7 ,
은 개의 밴드5 (Red, Green, Blue, NIR, PAN)를 포함하 고 있다 포함된 각각의 밴드는 서로 차별되는 특성. 을 가지게 된다 또한 획득된 이미지는 공간해상도의. 크기에 따라 이미지 자료의 크기가 결정된다(Lee, 두 영상이 포함하는 각각의 밴드별 파장값은 2008).
Table 2와 같다.
원격탐사를 이용한 다양한 분석을 위해서는 고해 상도의 Multi-Spectral 영상을 사용하는 것이 이상적이 지만, 센서의 물리적 한계로 인해 고해상도의
영상은 불가능하다 이러
Multi-Spectral (Zhang, 2004).
한 이유로 위성영상은 영상융합을 이용하여 높은 공 간해상도의 Panchromatic 영상으로 가시광선 영역의
와 근적외선 영상을 Red, Green, Blue (NIR) Pan
하여 공간해상도 로 생성 후 수행하였 -sharpening 0.5m
다.
대상물의 정확한 좌표는 Leica사의 GPS(Zeno-10)를 이용하였으며 수관폭 및 흉고직경, (DBH: Diameter at
측정하였다 조사결과는. Arc GIS 9.2를 이용하여 Data 로 작성하였다 또한 제공받은 위성영상과 항공
Base .
영상은 정사보정이 완료된 영상이므로 정사보정은 생 략하였으며 ERDAS Imagine 9.1(2006)의 layer stack 기능을 이용해 고해상도의 다중분광 영상을 생성하였 다 이는 다중분광영상의 각각의 밴드가 가지는 특성. 을 모두 고려하여 수종분류를 하기 위함으로서 각 밴 드들의 분광정보(DNs)는 Fig. 3과 같다 이는 칼라합. 성영상의 개념으로 쓰이기도 하며 PAN을 제외한 가4 지 밴드(Blue밴드, Green밴드, Red밴드 근적외선 밴, 드(NIR)를 중첩한 영상이다 또한. SPSS 12.0K(SPSS 를 이용하여 각각 개의 밴드에 Inc., Chicago, USA) 5
대해 일원배치 일원분석(ANOVA: Analysis of 을 실시하였으며 사후분석은 다중 variance) , Turkey’s 비교(Table 3)를 실시하였다.
Electromagnetic
Wavelength( )㎛ Spatial resolution
GeoEye-1 Aerial
imagery GeoEye-1 Aerial imager y
Visible spectrum
Blue 0.45~0.52 0.40~0.60
1.65m 0.12m Gree
n 0.52~0.60 0.48~0.66 Red 0.63~0.70 0.58~0.72 Infrared
radiation NIR 0.76~0.90 0.62~1.00
Panchromatic 0.45~0.90 0.41~0.69 0.41m 0.12m
Table 2. The wavelength for each band of high resolution imagery.
Fig. 3 DNs values of each tree species. (a) GeoEye-1 bands, (b) Aerial imagery bands.
(Gb; Ginkogo biloba, Pr; Pinus rigida, Ps; Pinus strobus, Jch; Juniperus chinensis, Cac; Castanea crenata, Qa; Quercus acutissima, Qm; Quercus mongolica, Qal; Quercus aliena, Prs; Prunus sargentii, Pp; Pyrus pyrifolia, Rop; Robinia pseudoacacia, Pc; Paulownia
coreana, Sk; Salix koreensis, Zs; Zelkova serrat)
Images Tree Species
Pan Band1 Band2 Band3 Band4
Satlellite Aerial Satlellite Aerial Satlellite Aerial Satlellite Aerial Satlellite Aerial
Ginkogo bilob(Gb)
cd f cde f d h abc ef bc fPinus rigida (Pr)
cde d bcde f bcd e abc fg d bPinus strobus(Ps)
ab i cde i cd j bc i a eJuniperus chinensis(Jch)
abc e de f d f cd e ab aQuercus acutissima (Qa)
a c ab b a d a ab abc fCastanea crenata(Cac)
bc a abc b abc a abc a d cQuercus mognilica(Qm)
de b ab a bc b ab bc f hQuercus aliena(Qal)
cde b abcd b abc b ab d ef ghPrunus sargentii(Prs)
de c de c d cd d c c dPyrus pyrifolia(Pp)
ab f a f ab h a h abc eRobinia
pseudoacacia(Rop)
g d cde d bcd f abc h g jPaulownia coreana(Pc)
efg ef e g d g d g de iSalix koreensis(Sk)
fg h bcde f d i abc g ef gZelkova serrata(Zs)
ef b bcde b bcd bc bc bc ef fTable 3. Turkey’s multiple comparison test of the GeoEye-1 bands and Aerial imagery bands.
수종분류시 감독분류 방법중 하나인 최대우도분류 법(Maximum Likelihood Classification)을 적용하였으 며 샘플 영역은 수종 현지조사지역으로 하였다 샘플, . 영역 설정시 두 영상의 공간해상도의 차이를 고려하 여 위성영상은 3*3, 5*5, 7*7, 항공영상은 5*5, 12*12, 로 하였다 이후 수종분류 결과의 정확도를 검 17*17 .
증하기 위해 200개의 샘플을 랜덤으로 추출하여 오차 행렬표(Error Matrix)를 작성한후 제작자 정확도 사용, , 자 정확도 전체정확도를 산출하였다 마지막으로 우, . 연에 의한 일치 확률을 제거하기 위해 Cohen(1960)의
검정을 실시하였다
Kappa .
연구결과 3.
수종분류 결과 3.1
연구대상지의 현지조사 결과를 활용하여 고해상도 위성영상과 항공영상의 다중분광영상 칼라합성영상( ) 을 제작한 후 샘플영역의 크기 위성영상( : 3*3, 5*5,
항공영상 별로 최대우도분류
7*7, : 5*5, 12*12, 17*17)
법을 적용하여 감독분류를 수행하였다 그 결과는. 와 같으며 위성영상의 경우 의 샘플영역으
Fig. 4 3*3
로 수종분류한 결과 리기다소나무 밤나무 스트로브, , 잣나무 상수리나무 등의 순으로 많이 분포하였으며, , 는 밤나무 상수리나무 스트로브잣나무 느티나무
5*5 , , ,
의 순으로, 7*7의 샘플 영역을 설정한 영상은 느티나 무 상수리나무 밤나무 은행나무의 순으로 나타났다, , , . 항공영상의 경우, 5*5는 배나무 밤나무 리기다소, , 나무 느티나무의 순으로, , 12*12는 밤나무 상수리나, 무 느티나무 배나무, , , 17*17은 밤나무 느티나무 상, , 수리나무 은행나무의 순으로 분포하는 것으로 나타, 났다.
수종분류 정확도 검증 3.2
수종분류 정확도 검증은 위성영상과 항공영상으로 제작한 다중분광영상을 활용해 감독분류시 사용했던 샘플영역 200개를 무작위로 표본 추출하였으며 표본, 은 오차행렬표(Error Matrix)를 작성하여 전체정확도, 사용자 정확도 제작자 정확도를 산출하였다, (Table 4).
그 결과 모든 샘플영역의 건물과 나지에서 가장 높, 은 신뢰도를 보였다 하지만 이러한 단순 비교 검증. 의 경우 우연에 의한 일치 확률을 내재하고 있어 정 확한 검증에 문제가 발생할 요인을 배제하기 위해 의 검정을 실시하여 우연에 의해 Cohen(1960) Kappa
일치될 확률을 제거하였다. Table 5은 Kappa 통계값 에 대한 분류 정확도를 나타낸다.
각 영상의 샘플영역 크기별 정확도를 살펴보면 위 성영상은 3*3에서 전체정확도 84.7%, 5*5는 72.5%,
은 로 나타났으며 계수는
7*7 65% , Kappa 0.84, 0.7, 로 나타났다 또한 항공영상의 전체정확도는
0.62 . 5*5
에서 83%, 12*12는 70.2%, 17*17은 68.5%로 나타났 고 Kappa계수는 0.82, 0.68, 0.66으로 Table 5에 의한 분류정도는 전체적으로 양호한 것으로 나타났다 하. 지만 Kim(2005)의 연구에서는 토지피복분류 시 5*5, 의 샘플영역 9*9, 13*13, 17*17, 21*21, 25*25, 29*29
중 중간정도의 크기인17*17에서 가장 높은 정확도를 보여 본 연구의 결과인 가장 작은 크기의 샘플영역이 가장 높은 정확도를 보인 것과 상이하다 그 이유로. 는 수종분류는 토지피복분류보다 대상물의 크기가 작 아 그림자와 같은 외부요인의 간섭이 상대적으로 많 기 때문인 것으로 판단된다 따라서 정량적인 측면에. 서 아직 고해상도 영상을 이용한 토지피복분류의 정 확도에 비해 다소 낮은 정확도를 보이므로 추후 추가 적인 연구를 통해 세부적인 원인파악이 필요할 것으 로 사료된다.
(a) (b)
(c) (d)
(e) (f)
Fig. 4 Classification map of tree species by multi-spectral images. (a) GeoEye-1(3*3), (b) GeoEye-1(5*5), (c) GeoEye-1(7*7), (d) Aerial imagery(5*5), (e) Aerial imagery(12*12), (f) Aerial imagery(5*5). For species names, see table 1.
(A)
Field survey data (3*3)Gb Qa Rop Cac Prs Qm Pc Jch Ps Zs Qal Sk Pr Pp Building Barren land Total User's accuracy(%)
GeoEye-1 classification data
Gb 15 1 1 17 88.2
Qa 12 1 1 1 1 1 1 18 66.7
Rop 15 15 100
Cac 17 2 1 20 85
Prs 1 3 1 1 6 50
Qm 1 4 5 80
Pc 7 1 1 9 77.8
Jch 10 1 11 90.9
Ps 1 12 1 14 85.7
Zs 2 1 1 10 1 15 66.7
Qal 5 5 100
Sk 8 8 100
Pr 1 10 1 12 83.3
Pp 2 1 7 10 70
Building 20 20 100
Barren land 15 15 100
Total 15 15 15 20 5 5 10 10 15 15 5 10 15 10 20 15 200 84
Producer's
accuracy(%) 100 80 100 85 60 80 70 100 80 66.7 100 80 66.7 70 100 100 84 85
Table 4. Accuracy assessment of randomly selected 200 pixels.
(B)
Field survey data (5*5)Gb Qa Rop Cac Prs Qm Pc Jch Ps Zs Qal Sk Pr Pp Building Barren land Total User's accuracy(%)
GeoEye-1 classification data
Gb 11 2 13 84.6
Qa 10 2 1 1 1 2 17 58.8
Rop 2 12 1 2 17 70.6
Cac 1 10 11 90.9
Prs 2 3 1 6 50
Qm 1 3 1 1 6 50
Pc 1 7 1 9 77.8
Jch 7 1 3 1 12 58.3
Ps 1 1 9 3 14 64.3
Zs 2 2 2 1 1 1 12 2 23 52.2
Qal 1 2 3 66.7
Sk 2 1 10 13 76.9
Pr 1 8 2 11 72.7
Pp 2 1 6 9 66.7
Building 1 20 21 95.2
Barren land 15 15 100
Total 15 15 15 20 5 5 10 10 15 15 5 10 15 10 20 15 200 71
Producer's
accuracy(%) 73.3 66.7 80 50 60 60 70 70 60 80 40 100 53.3 60 100 100 70.2 72.5
(C)
Field survey data (7*7)Gb Qa Rop Cac Prs Qm Pc Jch Ps Zs Qal Sk Pr Pp Building Barren land Total User's accuracy(%)
GeoEye-1 classification data
Gb 10 1 11 90.9
Qa 10 1 2 1 1 1 1 17 58.8
Rop 2 11 1 1 2 17 64.7
Cac 1 1 8 1 1 1 13 61.5
Prs 1 3 2 6 50.0
Qm 3 3 100
Pc 5 1 6 83.3
Jch 2 1 5 1 9 55.6
Ps 1 1 4 1 7 57.1
Zs 2 1 4 2 2 3 3 11 4 32 34.4
Qal 1 3 2 6 33.3
Sk 1 1 10 12 83.3
Pr 1 1 2 8 1 13 61.5
Pp 2 2 1 1 1 7 14 50.0
Building 18 18 100
Barren land 1 15 16 93.8
Total 15 15 15 20 5 5 10 10 15 15 5 10 15 10 20 15 200 67.4
Producer's
accuracy(%) 66.7 66.7 73.3 40 60 60 50 50 26.7 73.3 40 100 53.3 70. 90 100 63.8 65
(D)
Field survey data (5*5)Gb Qa Rop Cac Prs Qm Pc Jch Ps Zs Qal Sk Pr Pp Building Barren land Total User's accuracy(%)
Aerial Imagery classification data
Gb 13 2 15 86.7
Qa 15 1 1 3 20 75
Rop 15 1 16 93.8
Cac 13 1 1 1 1 1 18 72.2
Prs 1 5 1 7 71.4
Qm 2 4 1 7 57.1
Pc 6 1 2 9 66.7
Jch 1 9 1 11 81.8
Ps 13 1 14 92.9
Zs 1 11 1 1 14 78.6
Qal 3 3 100
Sk 2 1 8 11 72.7
Pr 2 1 1 12 16 75.0
Pp 7 7 100
Building 19 19 100
Barren land 13 13 100
Total 15 15 15 20 6 6 10 10 15 16 5 10 15 10 19 13 200 82.7
Producer's
accuracy(%) 86.7 100 100 65 83.3 66.7 60 90 86.7 68.8 60 80 80 70 100 100 81.1 83
(E)
Field survey data (12*12)Gb Qa Rop Cac Prs Qm Pc Jch Ps Zs Qal Sk Pr Pp Building Barren land Total User's accuracy(%)
Aerial Imagery classification
data
Gb 15 1 1 17 78.6
Qa 12 1 1 1 1 1 1 18 57.9
Rop 15 15 92.9
Cac 17 2 1 20 82.4
Prs 1 3 1 1 6 44.4
Qm 1 4 5 66.7
Pc 7 1 1 9 66.7
Jch 10 1 11 87.5
Ps 1 12 1 14 87.5
Zs 2 1 1 10 1 15 63.2
Qal 5 5 75.0
Sk 8 8 90.0
Pr 1 10 1 12 64.3
Pp 2 1 7 10 75.0
Building 20 20 100.0
Barren land 15 15 100.0
Total 15 15 15 20 5 5 10 10 15 15 5 10 15 10 20 15 200 77.0
Producer's
accuracy(%) 77.3 73.3 86.7 70 80 40 60 77.8 93.3 80 60 90 60 60 100 75.3 84 78.5
(F)
Field survey data (17*17)Gb Qa Rop Cac Prs Qm Pc Jch Ps Zs Qal Sk Pr Pp Building Barren land Total User's accuracy(%)
Aerial Imagery classification data
Gb 11 1 1 13 84.6
Qa 9 2 1 2 14 64.3
Rop 13 1 2 16 81.3
Cac 2 11 1 1 1 16 68.8
Prs 2 3 1 1 7 42.9
Qm 3 4 7 42.9
Pc 1 4 1 1 1 8 50
Jch 1 1 1 7 2 2 14 50
Ps 1 3 12 5 21 57.1
Zs 1 1 2 1 9 3 1 18 50
Qal 1 2 1 4 50
Sk 3 1 7 11 63.6
Pr 1 1 1 9 12 75
Pp 1 1 2 4 50
Building 20 20 100
Barren land 15 15 100
Total 15 15 15 20 5 5 10 10 15 15 5 10 15 10 20 15 200 64.4
Producer's
accuracy(%) 73.3 60 86.7 55 60 60 40 70 80 60 40 70 60 20 100 100 64.7 68.5
Kappa Quality Kappa Quality
<0.00 Worst 0.40~0.60 Good
0.00~0.20 Poor 0.60~0.80 Very good 0.20~040 Reasonable 0.80 Excellent
Table 5. Grade of Kappa statistics.
결론 4.
본 연구는 효율적인 식생조사를 위해 고해상도 위 성영상(GeoEye-1)과 Ultra Cam XP로 촬영된 고해상 도 항공영상을 이용해 수종분류의 가능성을 제시하고 감독분류 시 샘플영역의 크기가 분류 정확도에 미치 는 영향을 객관적으로 알아보고자 수행하였다 그 결.
과 두 영상모두 샘플영역의 크기가 작아질수록 높은, 정확도를 보였다 하지만. Kim(2005)의 연구에서는 중 간치에 해당하는 샘플영역의 크기에서 가장 높은 정 확도를 보여 본 연구의 결과와 다소 상이하였다 그. 이유로는 대상체의 크기의 차이에 따른 것으로 수종, 분류 시 토지피복분류에 비해 그림자와 같은 외부요 인의 간섭이 상대적으로 많기 때문이다 따라서 정확. 한 내 외부 요인의 제거 및· Panchromatic 영상의 를 추출하여 분류하고 기여도가 높은 특징을
texture ,
추출하기 위해 퍼지 기반의 모델을 이용하여 분류 네트웍을 구성하고((Kwak et al., 1999) 분류하고자 하 는 영역의 발기 분포도, 텍스쳐 특징 그리고 NDVI(Normalized Difference Vegetation Index)(Choi 를 분류에 사용될 특징으로 선택한다 and Yang, 2012)
면 일정부분 정확도가 향상될 것으로 판단된다 또한.
감독분류시 본 연구에 사용된 다중분광영상은 분광흡 수 특성이 매우 상이한 지표물을 구분하기에는 충분 하지만 유사한 분광흡수특성을 가지는 식생의 수종 및 상태를 분석하기에는 한계가 있으므로(Lee, 2008), 다분광센서가 가지는 한계를 보완하고 가시광선에서 적외선 영역에 이르는 분광정보의 획득 및 이용을 위 해 밴드 수가 100개 이상이면서 밴드별 파장범위가 좁은 고분광영상을 활용한 수종분류 연구가 필요할 것으로 사료된다 그리고 더 많은 샘플영역의 크기를. 고려한 연구가 수행된다면 보다 객관적이고 정량적인 결과를 도출할 것으로 판단된다.
사사
본 연구는 환경부의 2012 차세대에코이노베이션기 술 개발사업의 지원으로 수행되었으며 이에 감사드립 니다.
참고문헌
Brandtberg, T (2002). Individual tree-based species classification in high spatial resolution aerial images of forests using fuzzy sets. Fuzzy Sets and Systems 132, pp. 287-371
Choi, HM, Yang, KC (2012). Classification of tree species using high-resolution QuickBird-2 satellite images in the valley of Ui-dong in Bukhansan National Park. J. of Ecology and Environment 35(2), pp. 91-98
Chung, SY (2011). Study on the estimation of forest biomass us- ing remote sensing data, Ph.D. Dissertation, Kookmin University, Seoul, Korea.
Cohen, J (1960). A coefficient of agreement for nominal scales.
Educational and Psychological Measurement 20, pp. 37-46 ERDAS (1997). ERDAS Field Guide. 4th Edtion. Erdas
Publisher, Atlanta, Georgia.
Ha, SR, Kyoung, CK, Park, SY, Park, DH (2002). Estimation of classification Accuracy of JERS-1 satellite imagery accord- ing to the acquisition method and size of training reference data. J. of Korean Association of Geographic Information Studies 5(1), pp. 27-37. [Korean Literature]
The Intergovernmental Panel on Climate Change (2007).
Climate Change 2007. Syntheis Report. IPCC Fourth Assessment Report. Geneva, Switzerland, 104p Jang, AJ, Yu, KY, Kim, YI, Lee, BK ( 2006) . Estimation of in-
dividual tree and tree height using color aerial photograph and LiDAR data. J. of Korean Remote Sensing 22(6), pp.
543-551. [Korean Literature]
Kang, NY, Park, JG, Cho, GS, Yeu, Y (2012). An analysis of land
cover classification methods using IKONOS saellite Image.
J. of the Korean Society for GeoSpatial Information System 20(3), pp. 65-71. [Korean Literature]
Kwak, JH, Rhee, HJ, Lee, JW (1999). Feature selection of training set for supervised classification of satellite imagery. J. of the Korean Society of Remote Sensing 15(1), pp. 39-50 [Korean Literature]
Katoh, M (2004). Classifying tree species in a northern mixed forest using high-resolution IKONOS data. The Japanese Forestry Society and Spring-Verlag Tokyo 9, pp. 7-14 Kim, ES ( 2005). A study on improvement of classification accu-
racy using the texture information of high resolution pan- chromatic image, Master's Thesis, Inha University, Incheon, Korea, 53pp. [Korean Literature]
Kwon, BK, Yamada, K, Niren, T, Jo, MH (2003). A study on the landcover classification using band rationing data of Landsat-TM. J. of Korean Association of Geographic Information Studies 6(2), pp. 80-91. [Korean Literature]
Korea environment institute (2008). Application of Hyperspectral Image Data for Vegetation Analysis.
KEI-2008-BA-06 , Korea environment institute. [Korean Literature]
Lee, HJ, Lu, JH, Kim, SY (2011). Land cover object-oriented base classification using digital aerial photo image. J. of the Korean Society for GeoSpatial Information System 19(1), pp.
105-113. [Korean Literature]
Nowongu (1999-2011). Nowon Statistical Yearbook.
51-3100000-000001-10, Nowongu, Seoul, Korea. [Korean Literature]
Oh, CY, Park, SY, Kim, HS, Lee, YW, Choi, CU (2010).
Comparison of landcover map accuracy using high reso- lution satellite imagery. J. of Korean Association of Geographic Information Studies 13(1), pp. 89-100. [Korean Literature]
Park, JG, Go, SY, Cho, GS (2013). Vegetation classification us- ing KOMPSAT-2 imagery and high-resolution airborne im- agery in urban Area. J. of the Korean Society for GeoSpatial Information System 21(4), pp. 21-27. [Korean Literature]
Whitesid, TG, Boggs, GS, Maier, SW (2011). Comparing ob- ject-bases and pixel-based classifications for mapping savannas. International J. of Applied Earth Observation and Geoinformation 13, pp. 884-893.
Zhang, Y (2004). Understanding image fusion. Photogrammetric Engineering and Remote Sensing 70(6), pp. 657-661.
논문접수일 : 2014년03월21일
○
심사의뢰일 : 2014년03월25일
○
심사완료일 : 2014년07월01일
○