Korean J. Environ. Biol. 36(3) : 345~351 (2018) https://doi.org/10.11626/KJEB.2018.36.3.345
INTRODUCTION
Polycyclic aromatic hydrocarbons (PAHs) are organic compounds with multiple fused aromatic rings (two to sev- en rings) generally released by various human activities in- cluding the burning of fossil fuels, the incomplete burning of carbon-containing materials (e.g. gasoline and coal), tire particles, motor oil spills, vehicle exhaust, and crumbling asphalt (WHO 2000). Therefore, the contamination of PAHs in the agricultural waterways in Korea can be predictable
since many of them are located between car roads and agri- cultural lands. PAHs do not biologically break down due to their aromatic ring structures and some PAHs (e.g. benzo(a) pyrene) are known to be carcinogenic and mutagenic (IARC 2010). In addition, noncarcinogenic PAHs including phen- athrene, fluoranthene and pyrene in water can react with nitrite (NO
2-) in the air and form nitrated PAHs (nitro-PAHs) known to be more toxic than the parent PAHs (Shailaja et al. 2006). It should be noted that the water from the water- ways is mainly used by Korean farmers to supply their crop and increasing vehicular traffic or air pollution may also cause increase in levels in PAHs around the waterway envi- ronment (Lin et al. 2015).
To prevent the serious contamination, it is important to
* Corresponding author: Sung-Eun Lee, Tel. 053-950-7768, Fax. 053-953-7233, E-mail. [email protected]
ⓒ 2018. Korean Society of Environmental Biology.
Analysis of Polycyclic Aromatic Hydrocarbons in Agricultural Waterways in Chungbuk and Gyeongbuk Provinces in Korea
Leesun Kim 1,† , Jong-Hwa Lee 2,† , Jeong-Han Kim 2, * and Sung-Eun Lee 1, *
1
School of Applied Biosciences, Kyungpook National University, Deagu 41566, Republic of Korea
2
Department of Agricultural Biotechnology, Seoul National University, Seoul 08826, Republic of Korea
Abstract - An efficient, quick and low-cost extraction and clean up method for the determination of 14 polycyclic aromatic hydrocarbons (PAHs) in the agricultural water samples was optimized using gas chromatography-tandem mass spectrometry (GC-MS/MS). The extraction of the target compounds in water sample was carried out with acetonitrile, followed by partitioning promoted by the addition of salt. As a clean-up procedure, dispersive solid phase extraction was employed to purify the analytes of interest for GC-MS/MS analysis. This method was successfully applied for the quantification of PAHs in real water samples collected for the purpose of monitoring from the waterways located in Chungbuk (15 sites) and Gyeongbuk (6 sites), S. Korea. Phenanthrene (0.54 to 2.53 μg L
-1) was detected in all the water samples collected from both the sites. Fluoranthene was detected in the water samples collected from the two sites in Gyeongbuk province, but other PAHs were not determined in these water sampling sites. Based on these results, the determined PAHs were conducted using an environmental risk assessment. The risk characterization ratios (RCRs) for phenanthrene ranged from 0.37 to 3.21. These RCR values referred to as risk was not controlled because RCR values of some sites were greater than 1. In conclusion, it is proposed that the optimized method in combination with GC-MS/MS could be successfully employed for the determination of PAHs in any environmental samples including water samples.
Keywords : gas chromatography tandem mass spectrometry, monitoring, phenantherene, Environmental risk assessment
<Original article>
†
These authors contributed equally to this paper as first author.
*These authors contributed equally to this paper as corresponding author.
* Corresponding author: Sung-Eun Lee, Tel. 053-950-7768,
Fax. 053-953-7233, E-mail. [email protected]
continuously monitor the levels of PAHs in the water envi- ronment using a more simplified and advanced analytical method. In many studies on monitoring and assessment of PAHs, conventional extraction methods combined with gas chromatography mass spectrometry (GC-MS) have been ad- opted to determine the concentration of PAHs in various en- vironmental samples (Maliszewska-Kordybach et al. 2008;
Huang et al. 2014). In this study, QuEChERS (quick, easy, cheap, effective, rugged and safe) extraction method com- bined with GC tandem mass spectrometry (GC-MS/MS) was modified for PAHs analysis. The QuEChERS method is effective but greatly reduces analysis time and costs much less than the traditional extraction method involved with the large amount of organic solvent, tedious concentration pro- cedures or cross contamination. This method was originally introduced for the determination of pesticide residues in agricultural produce (Anastassiades et al. 2003). It has been gradually extended to the analysis of organic contaminants such as mycotoxins (Jettanajit et al. 2016), veterinary drugs (Guo et al. 2015) and PAHs. Pesticide residues and PAHs in fresh herbs were determined using a modified QuEChERS method and GC-MS (Sadowska-Rociek et al. 2014).
GC-MS/MS were mainly used for multiresidue pesticide analysis (Zou et al. 2016) but it became the analytical tool of choice when target compounds are analyzed in a very complicated matrix (e.g. environmental samples and drug residues or metabolites in biological samples). The target analytes can be detected regardless of the sample matrix or other coeluted compounds of interest (or interferenc- es) since the selected precursor or parent ions from the first stage of MS/MS are induced to further dissociate by collision energy. In this manner, MS/MS can confirm the compounds at trace levels (ppb level) lower than single MS can detect (Hayward et al. 2015). Multiclass pesticides and PAHs in fatty fish were analyzed using GC-MS/MS at trace level and recoveries at 10, 25 and 50 μg kg
-1ranged from 60 to 120% with RSD < 11% (Chatterjee et al. 2016).
This study was aimed to optimize modified QuEChERS extraction and dispersive solid phase extraction (d-SPE) clean-up methods to extract and purify PAHs in water sam- ples for the GC-MS/MS analysis. The optimized analytical method was applied to evaluate the level of PAHs in the waterways in Chungbuk (15 sites) and Gyeongbuk (6 sites).
These results were also assessed associated with possible
PAHs sources. The determined PAHs were also assessed their environmental risks using ECOSAR. With these re- sults, safety in agricultural ecosystems will be kept from persistent organic pollutants including PAHs.
MATERIALS AND METHODS 1. Chemicals
Certified reference standards of each PAH had > 98%
purity and were purchased from Sigma Aldrich (US). Ace- tonitrile (ACN) was purchased from Merk (Darmstadt, Germany). QuEChERS salt packets (4 g anhydrous MgSO
4, 1g NaCl, 1g trisodium citrate dehydrate and 0.5 g disodium hydrogen citrate sesquihydrate) were purchased from Ultra Scientific (Seoul, Korea) and d-SPE tubes containing pri- mary secondary amine (PSA, 25 mg) and anhydrous mag- nesium sulphate (MgSO
4, 150 mg) were purchased from Restek
®(US).
2. Sample Preparations
ACN (10 mL) was added to water sample (10 mL) in 50 mL of poly propylene plastic tube and vigorously shaken for 1 min. While contacting crushed ice with an extraction tube in order to cool down the extract, the salt was added to the tube for the partitioning and vigorously shaken for 1 min and centrifuged for 5 min (3,500 rpm). For clean-up, 1 mL of each extract was added to 2 mL of d-SPE tube con- taining PSA and MgSO
4and vigorously shaken for 1 min.
After being centrifuged (15,000 rpm), 0.5 mL of extracts were taken into a GC vial and evaporated under the gentle stream of nitrogen gas. ACN (0.1 mL) was added to the vial for the GC-MS/MS analysis.
3. Instrumental Analysis
The sample analysis was carried out with Bruker SCION
TQ (Triple Quadrupole mass spectrometry) in SRM (se-
lected reaction monitoring) with CP-8400 autosampler. For
separation of the analytes, ZB-SemiVolatiles (30 m×0.25
mm×0.25 μm film thickness, Phenomenex) was used. The
injection volume was 2 μL with splitless pulsed pressure
mode at 250 kPa. The carrier gas was helium with constant
flow (1.0 mL min
-1) and inlet temperature was set at 300℃.
The initial oven temperature with 90℃ was held for 3 min, ramped into 170℃ at 25℃ min
-1and ramped into 300℃
at 5℃ min
-1(held for 4 min). Mass spectrometer was run with EI (electron-impact ionization) mode with 70 eV and transfer line and ion-source temperatures were set at 300 and 280℃, respectively.
4. Method Validation and Fortification Studies
Linearity, limits of quantification (LOQs), method de- tection limit (MDL), limits of detection (LODs), accuracy and precision were determined during validation of the analytical method. External standard method was employed for quantitative analysis. For accuracy and precision, the recovery and reproducibility experiments were performed by fortifying blank agricultural water sample (10 mL) in three replicates at two spiking levels: 10 and 50 μg L
-1. Using matrix matched standards, the quantification of each compound was carried out by plotting a calibration curve (1, 5, 10, 25, 50, 100, 250, and 500 μg L
-1) for linearity (R
2> 0.99). LOQs of the optimized method were calculated as the lowest concentration giving signal-to noise ratios of 10 (S/N=10) by injecting matrix matched calibration standard into GC-MS/MS. MDL was calculated by multiply LOQs by five, the concentration factor obtained in sample preparation.
5. Agricultural Water Sample Analysis
Water samples were obtained from Chungbuk (15 sites) (site 1: 37°02ʹ25.9ʺN 127°55ʹ31.5ʺE, 2: 37°02ʹ27ʺN
127°55ʹ1ʺE, 3: 37°02ʹ29ʺN 127°54ʹ45.0ʺE, 4: 37°02ʹ32.2ʺN 127°54ʹ34.9ʺE, 5: 37°02ʹ38.5ʺN 127°54ʹ20.0ʺE, 6: 37°02ʹ52.5ʺN 127°53ʹ29.9ʺE, 7: 37°02ʹ22.5ʺN 127°55ʹ46.8ʺE, 8: 37°02ʹ14.6ʺN 127°56ʹ12.2ʺE, 9: 37°02ʹ13.3ʺN 127°56ʹ46.0ʺE, 10: 37°02ʹ20.4ʺN 127°57ʹ03.2ʺE, 11: 37°02ʹ45.4ʺN 127°57ʹ27.1ʺE, 12: 37°05ʹ03.3ʺN 127°57ʹ22.5ʺE, 13: 37°05ʹ21.1ʺN 127°57ʹ35.0ʺE, 14: 37°04ʹ28.6ʺN 127°55ʹ50.3ʺE, 15:
37°02ʹ25.9ʺN 127°55ʹ31.5ʺE) and Gyeongbuk (6 sites) (1: 35°37ʹ44.9ʺN 128°26ʹ06.1ʺE, 2: 35°57ʹ19.6ʺN 128°20ʹ05.6ʺE, 3: 35°57ʹ00.7ʺN 128°19ʹ37.7ʺE, 4: 35°55ʹ57.1ʺN 128°34ʹ02.3ʺE, 5: 35°35ʹ58.4ʺN 128°28ʹ28.4ʺE, 6: 35°53ʹ07.3ʺN 128°36ʹ04.9ʺE). Replicate samples from Gyeongbuk were collected. All the samples were prepared using the analytical methods proposed in this study. For the quantitative analysis of water samples, matrix matched standards were prepared with blank agricultural water sample, pre-checked by the preliminary analysis.
Measured PAHs were evaluated for their environmental risks using risk characterization ratios (RCRs) in relation to predicted no-effect concentrations (PNEC) calculated by ECOSAR (version 2.0). If RCR value is greater than 1, risk is not controlled. Otherwise, risk is adequately controlled if the RCR value is less than 1.
RESULTS AND DISCUSSION 1. GC-MS/MS Analysis and Sample Preparation For the optimization of the MS parameters, all the ana-
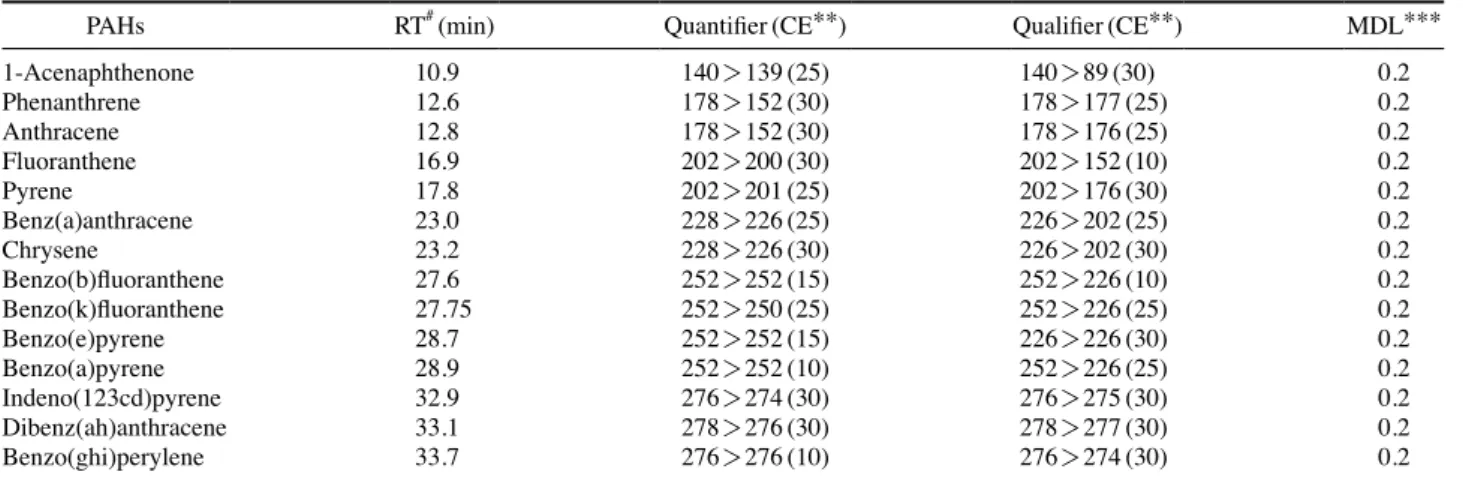
Table 1. Quantifier and qualifier with collision energy optimized for the GC-MS/MS analysis
PAHs RT
#(min) Quantifier (CE**) Qualifier (CE**) MDL***
1-Acenaphthenone 10.9 140 > 139 (25) 140 > 89 (30) 0.2
Phenanthrene 12.6 178 > 152 (30) 178 > 177 (25) 0.2
Anthracene 12.8 178 > 152 (30) 178 > 176 (25) 0.2
Fluoranthene 16.9 202 > 200 (30) 202 > 152 (10) 0.2
Pyrene 17.8 202 > 201 (25) 202 > 176 (30) 0.2
Benz(a)anthracene 23.0 228 > 226 (25) 226 > 202 (25) 0.2
Chrysene 23.2 228 > 226 (30) 226 > 202 (30) 0.2
Benzo(b)fluoranthene 27.6 252 > 252 (15) 252 > 226 (10) 0.2
Benzo(k)fluoranthene 27.75 252 > 250 (25) 252 > 226 (25) 0.2
Benzo(e)pyrene 28.7 252 > 252 (15) 226 > 226 (30) 0.2
Benzo(a)pyrene 28.9 252 > 252 (10) 252 > 226 (25) 0.2
Indeno(123cd)pyrene 32.9 276 > 274 (30) 276 > 275 (30) 0.2
Dibenz(ah)anthracene 33.1 278 > 276 (30) 278 > 277 (30) 0.2
Benzo(ghi)perylene 33.7 276 > 276 (10) 276 > 274 (30) 0.2
#
RT: retention time; *MW: molecular weight; **CE: collision energy; ***MDL: method development limit
lytes were initially monitored in full scan mode in the 50- 550 m/z ranges and then, one or two precursor ions (or parent ions) for each analyte were selected (by considering selectivity (specificity) and sensitivity. When the precursors (or parent ions) were dissociated once more by the collision energy, the best product ions were selected for each transi- tion in a multiple reaction monitoring (MRM) experiment.
The most intense transition of each analyte was selected
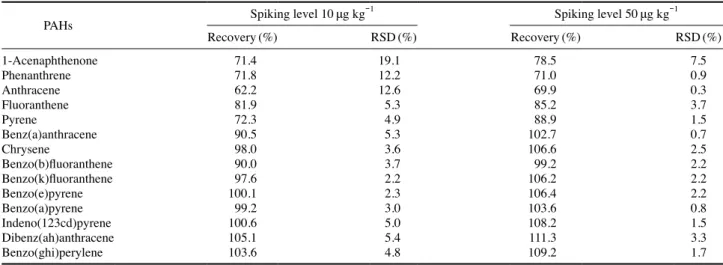
for the quantifier analysis and the second most intense for the qualifier analysis. Due to structural stability of aromatic rings (two to seven rings) in PAHs, high collision energies were required to produce product ions. The quantification and identification ions and collision energy for each PAH selected in MRM experiment are shown in Table 1. The consequential specific product ion spectrum confirmed the target compound identified by retention time of each Table 2. Recoveries with the relative standard deviation (RSD) at two spiking levels: 10 and 50 μg kg
-1PAHs Spiking level 10 μg kg
-1Spiking level 50 μg kg
-1Recovery (%) RSD (%) Recovery (%) RSD (%)
1-Acenaphthenone 71.4 19.1 78.5 7.5
Phenanthrene 71.8 12.2 71.0 0.9
Anthracene 62.2 12.6 69.9 0.3
Fluoranthene 81.9 5.3 85.2 3.7
Pyrene 72.3 4.9 88.9 1.5
Benz(a)anthracene 90.5 5.3 102.7 0.7
Chrysene 98.0 3.6 106.6 2.5
Benzo(b)fluoranthene 90.0 3.7 99.2 2.2
Benzo(k)fluoranthene 97.6 2.2 106.2 2.2
Benzo(e)pyrene 100.1 2.3 106.4 2.2
Benzo(a)pyrene 99.2 3.0 103.6 0.8
Indeno(123cd)pyrene 100.6 5.0 108.2 1.5
Dibenz(ah)anthracene 105.1 5.4 111.3 3.3
Benzo(ghi)perylene 103.6 4.8 109.2 1.7
Table 3. Ecological risk assessment of measured phenanthrene in the waterways of two provinces in Korea. PNEC values were calculated from ECOSAR v2.0 and the RCR values denote that risk is properly controlled if RCR value is less than 1
Sites Measured
concentration (μg L
-1)
PNEC
1values (μg L
-1) RCR
2values Green
algae Daphnid Fish Green
algae Daphnid Fish
Chungbuk 1 1.1
1.47 0.81 1.15
0.75 1.36 0.96
Chungbuk 2 0.9 0.61 1.11 0.78
Chungbuk 3 1.0 0.68 1.23 0.87
Chungbuk 4 1.5 1.02 1.85 1.30
Chungbuk 5 0.6 0.41 0.74 0.52
Chungbuk 6 0.9 0.61 1.11 0.78
Chungbuk 7 1.2 0.82 1.48 1.04
Chungbuk 8 1.7 1.16 2.10 1.48
Chungbuk 9 1.25 0.85 1.54 1.09
Chungbuk 10 1.1 0.75 1.36 0.96
Chungbuk 11 0.85 0.58 1.05 0.74
Chungbuk 12 0.9 0.61 1.11 0.78
Chungbuk 13 0.6 0.41 0.74 0.52
Chungbuk 14 0.7 0.48 0.86 0.61
Chungbuk 15 1.3 0.88 1.60 1.13
Gyeongbuk 1 0.6 0.41 0.74 0.52
Gyeongbuk 2 0.55 0.37 0.68 0.48
Gyeongbuk 3 0.68 0.46 0.84 0.59
Gyeongbuk 4 2.6 1.77 3.21 2.26
Gyeongbuk 5 0.7 0.48 0.86 0.61
Gyeongbuk 6 0.15 0.10 0.19 0.13
1
PNEC: Predicted no-effect concentration;
2RCR: Risk characterization ratio
compound. In this way, selectivity of MS/MS enhanced the signal to noise so low limit of detections (LODs) for the PAHs (e.g. LOD of phenanthrene is 1 μg L
-1) were achieved in this experiment. MDLs were 0.2 μg L
-1for all the target compounds. Some studies showed that LOD of phenan- threne ranged from 2.5 to 3.5 μg L
-1using GC-MS (Zhao et al. 2015; Zou et al. 2016). It was demonstrated that signal- to-noise ratios of PAHs determined using GC-MS/MS was much superior to those of them using GC-MS (Zou et al.
2016).
The QuEChERS extraction method is a streamlined ap- proach recently developed to separate organic compounds (pesticide residues or PAHs) in a complex matrix (Anas- tassiades et al. 2003). This technique provides an environ- mentally friendly alternative to conventional liquid-liquid and solid phase extractions, requiring the large amount of organic solvent. The procedure involves two simplified steps; sample extraction and d-SPE clean-up. In this study, the sample (10 mL) extraction and partitioning were carried out using a minimal amount of organic solvent (10 mL) and salt. Then, the target analytes in extract were purified using a 2 mL d-SPE tube containing PSA alone. The RSD data
validated that the proposed method was reproducible. Four- teen PAHs provided recoveries in the range of 60-110% at the two fortified levels of 10 and 50 μg L
-1associated with RSDs ( < 20%) (Table 2). Good linearity (R
2> 0.99) for all the target analytes was achieved for both solvent and matrix matched standards for quantification. Phenanthrene, anthra- cene and 1-acenaphthenone gave lower recoveries (approx.
70%) rates than other compounds (85-110%). These com- pounds must be lost during the evaporating procedure since they have lower molecular weight and more volatile than other PAHs (Vane et al. 2014).
2. Levels of PAHs in Water Samples
To determine the concentration of 14 PAHs in real water samples, water was sampled in the waterways located in Chungbuk (15 sites) and Gyeongbuk (6 sites), Korea. Ex- cept phenanthrene and fluoranthene, all the PAHs analyzed in the water samples were not detected. Phenanthrene was detected in all the water samples from both Chungbuk and Gyeongbuk areas. The concentration of phenanthrene ranged from 0.54 to 2.53 μg L
-1and the distribution of phenanthrene and fluoranthene in both places is shown in Table 4. Ecological risk assessment of measured fluoranthene in the waterways of two provinces in Korea. PNEC values were calculated
from ECOSAR (version 2.0) and the RCR values denote that risk is properly controlled if RCR value is less than 1
Sites Measured
concentration (μg L
-1)
PNEC
1values (μg L
-1) RCR
2values
Green
algae Daphnid Fish Green
algae Daphnid Fish
Gyeongbuk 1 0.13 0.66 0.29 0.39 0.19 0.44 0.33
Gyeongbuk 4 0.21 0.32 0.72 0.54
1
PNEC: Predicted no-effect concentration;
2RCR: Risk characterization ratio
1 2 3 4 5 6 Gyeongbuk sampling sites 1 2 3 4 5 6 7 8 9 10 11 12 13 14 15
Chungbuk sampling sites
Phenanthrene
3
2.5 2 1.5 1 0.5 0 3
2.5 2 1.5 1 0.5 0
Phenanthrene Fluoranthene