• 검색 결과가 없습니다.

Characteristics of Andong Dam Inflow during Non-rainfall Season

N/A
N/A
Protected

Academic year: 2021

Share "Characteristics of Andong Dam Inflow during Non-rainfall Season"

Copied!
7
0
0

로드 중.... (전체 텍스트 보기)

전체 글

(1)

1. Introduction 1)

The flow into the dam is very important in the supply of water resources to downstream areas so it is very important to understand the relationship between precipitation and runoff to provide stable water resources. The assessment of flow in water resources management is a very important consideration in the operation of multi-purpose dams.

The assessment of the flow rate is essential in terms of water resources management, such as efficient

water distribution and flood control. In particular, the relation between rainfall and runoff in the basin of a multi-purpose dam is related to its storage capacity, and the storage is closely related to its water supply.

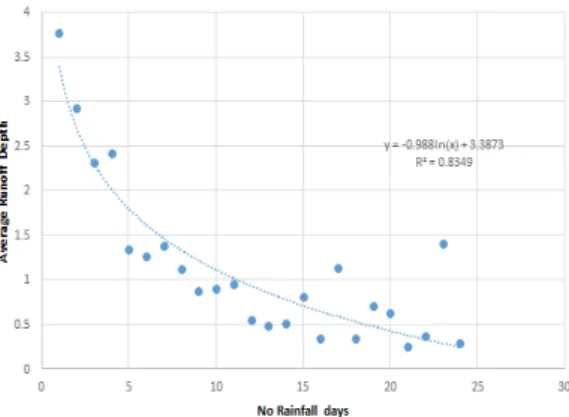
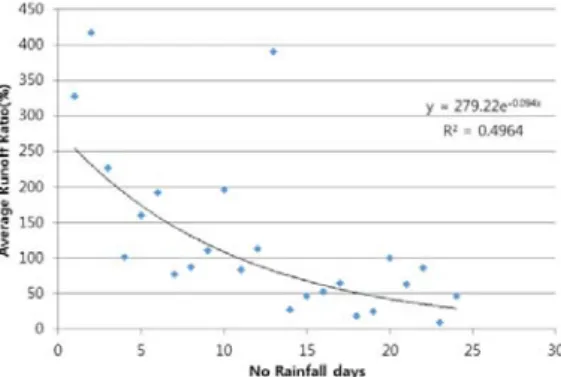
In the recent climate, the temporal and seasonal distribution of rainfall varies from year to year due to the impact of climate change, which is different from the historical rainfall patterns in Korea. Particular, the intensity of rainfall during heavy rains has increased, and the non-rainfall period when drought occurs has lengthened.

Received 4 October, 2018; Revised 22 October, 2018;

Accepted 23 October, 2018

*

Corresponding author: Ki-Bum Park, School of Construction Engineering, Kyungil University, Gyeongsan 38428, Korea Phone : +82-53-600-5422

E-mail : [email protected]

ⓒ The Korean Environmental Sciences Society. All rights reserved.

This is an Open-Access article distributed under the terms of the Creative Commons Attribution Non-Commercial License (http://

creativecommons.org/licenses/by-nc/3.0) which permits unrestricted non-commercial use, distribution, and reproduction in any medium, provided the original work is properly cited.

ORIGINAL ARTICLE

Characteristics of Andong Dam Inflow during Non-rainfall Season

Gey-Hwan Park, Ki-Bum Park

1)*

, In-Soo Chang

Department of Environment Engineering, Korea National University of Transportation, Chungju 27469, Korea

1)

School of Construction Engineering, Kyungil University, Gyeongsan 38428, Korea

Abstract

In this study, the runoff characteristics of the non-rainfall period were examined using daily rainfall data from 1977 to 2017 and the data of runoff into the dam. Results showed that, the mean runoff decreases with longer non-rainfall periods in the Andong dam basin. The correlation coefficient between non-rainfall days and average runoff reaches 0.85. The results of the analysis of the runoff characteristics during the non-rainfall period, based on the preceding rainfall of Andong dam are as follows. The runoff characteristics of the entire non-rainfall period, shows that, for a rainfall of 1.0 mm or less, the runoff height was larger than the rainfall size and the base runoff larger. The correlation between the antecedent rainfall and runoff height was reached as high as 0.9864 in the 30 ~ 50 mm interval of the antecedent rainfall period, and this is the interval where the linearity of rainfall and runoff was at its maximum in the Andong dam basin. The correlation between the antecedent rainfall and the runoff height reached 0.92 for rainfalls of 100.0 mm.

However, for rainfalls of 100.0 mm greater, the correlation between the antecedent rainfall and runoff height during the rainfall period was 0.64, which is relatively small. In this study, we investigated the runoff characteristics of the rainfall period in the Andong dam watershed. As a result, it was confirmed that the mean runoff decreased with rainfall duration. The linearity was found to be weak for rainfall events greater than 100.0 mm. The results of this study can be used as data for water balance analysis and for formulating a water supply plan to establish water resource management of Andong dam.

Key words : Non-rainfall duration, Andong dam, Runoff ratio

(2)

Studies to identify the relationship of runoff depending on precipitation have been carried out continuously. In the flood season, there have been many studies on the methods for calculating the appropriate runoff curve index for direct runoff and effective rainfall. There have also been many studies on the simulation on low flow to estimate the irrigation flux during the dry season. However, most modeling studies have focused improving the accuracy of the NRCS-CN (natural resources conservation service-curve number) runoff coefficients to the estimate effective rainfall in flood runoff and increasing the accuracy of model parameters to simulate low flow. In fact, there are only a few studies that have coverd the correlation between inflow to the dam and precipitation. Regarding the estimation of runoff and effective rainfall, there was a study on the effect of a river ecosystem using a hydrologic change index model that quantitatively analyzes the change in the flow rate(Richard et al., 1997).

It quantitatively analyzed hydrological change characteristics of daily flow data for eight multi-purpose dams in Korea (Kang et al., 2015).

Using the top model, it analyzed long-term runoff and examined the quantification and applicability of parameters (Cho et al., 2000). To estimate the effective rainfall for long-term runoff analysis, it conducted a study on the estimation of effective rainfall by modifying and applying the SCS (Soil Conservation Service) method which is an effective

basin(Im et al., 2012). To estimate the flood volume

of the ungagged basin, we evaluated the conceptual

rainfall runoff model and its application to basin

groups, based on the characteristics of the basin

characteristic(Chang and Lee., 2015). It has

examined the effect of previous rainfall on the

stability of slopes by analyzing the characteristics of

rainfall penetration in previous rains through a

one-dimensional rainfall penetration experiment

(Yoon et al., 2015). It has analyzed the temporal

correlation and volatility of river flow using a

previous rainfall index in mountainous sub-basins

and identified the correlation with each factor to

review the applicability of the previous rainfall index

model for mountain forest sub basin (Jung et al.,

2016). Taking into account previous rainfall, it

analyzed the runoff characteristics of the Jeju River

area. In this analysis, it calculated the runoff ratio for

short-term rainfall events and determined the lag

time, depending on the existence of heavy rain

events, such as typhoons. The analysis showed that

the event-specific runoff compared with the annual

mean runoff may be different depending on the

amount of previous rainfall and rainfall. If annual

average runoff ratio is applied to a single heavy rain

event, the fluctuation rate of the runoff ratio would be

large, depending on the rainfall scale (Yang et al.,

2014). For the application of the NRCS effective

rainfall calculation method to domestic basins, we

studied the method of determining the appropriate

number of previous rainfall days and proposed that

(3)

the application of the previous two-day rainfall was appropriate for the 13 rainfall events, as a result of flood runoff analysis (Lee et al., 2005). A study was conducted to predict the change in soil water storage by analyzing the relation between the soil water storage and the previous precipitation index measured in the forest area for three years (Gawk et al., 2016). To predict the soil moisture, it used exponential and linear precipitation indices to evaluate the previous precipitation index (Saxon and Lenz., 1967). The soil moisture was predicted and evaluated by applying a simple relationship between the previous rainfall index and relative soil moisture data (Zhao et al., 2011).

Therefore, in this study the runoff ratio duration is calculated and compared runoff based on previous rainfall data of the Andong dam.

2. Analysis method

2.1. Basin characteristics

The target area of this study is the Andong dam and the basin area is 1,584 . In terms of the hydrological soil classification type D was the most distributed, with 76.93 %, of the total area and hydrologic soil type A with good drainage was found

to be the least distributed, at 0.78% of the total area.

The location of Andong dam is shown in Fig. 1.

2.2. Analysis method

Based on the hydrological information of the dam basin provided by a comprehensive water resource website [www.wamis.go.kr], we collected and analyzed the amount of daily inflow into the Andong dam basin. A total of 40 years of daily data from January 1, 1977 to December 31, 2017 was collected and analyzed.

3. Analysis results

3.1. Analysis of characteristics of non-rainfall periods

An analysis of non-rainfall period days of the Andong dam basin from 1977 to 2017 showed that the most frequent case was a non-rainfall period of 1 day, while non-rainfall periods appeared for up to 45 days.

The analysis showed that the 1-day period was the most frequency with 537 days, followed by the 2-days period and periods of up to 45 days of non-rainfall days occurred.

Fig. 1. Location of Andong dam. Fig. 2. Andong dam daily inflow (1977-2017).

(4)

3.2. Runoff characteristics according to the duration of non-rainfall period

The mean runoff depth based on non-rainfall periods of the Andong dam basin was analyzed, as shown in Table 1. As a result, it was determined that the mean runoff depth tends to decrease with length of non-rainfall period.

This means that as drought continues, the inflow to Andong dam decreases, and as the non-rainfall period increases, the number of inflows to Andong dam decreases, and the inflow to Andong dam decreases.

Thus the reservoir function of Andong dam may be deepened. From 1977 to 2017, the runoff depth of the Andong dam basin as a function of non-rainfall period, was analyzed, revealing that the average runoff depth decreases with non-rainfall period days, as shown in Fig. 4. The correlation of mean runoff depth with the non-rainfall period was 0.85.

3.3. Non-rainfall period runoff characteristics of Andong dam basin

The result of the analysis of dependency of the runoff ratio on non-rainfall period from 1977 to 2017 at the Andong dam basin showed that the mean runoff ratio tends to decrease with the non-rainfall period, as shown in Fig. 5.

Nonrainfall days Average runoff

depth(mm) Days

1 3.774 537

2 2.930 415

3 2.312 272

4 2.420 196

5 1.337 154

6 1.270 130

7 1.376 74

8 1.122 73

9 0.877 55

10 0.906 42

11 0.958 44

12 0.551 29

13 0.492 24

14 0.514 20

15 0.811 16

16 0.339 16

17 1.132 9

18 0.349 5

19 0.707 9

20 0.633 4

21 0.259 4

22 0.374 4

23 1.413 3

24 0.288 5

Table. 1. Average runoff depth for the non-rainfall days

Fig. 3. Graph of non rainfall period days. Fig. 4. Average runoff depth for the non-rainfall days.

(5)

In this study, the runoff ratio shows the comparison between the previous rainfall and non-rainfall outflow depth. The analysis a smaller the amount of

previous rainfall, corresponded to a smaller runoff ratio, as shown in Fig. 6. The runoff ratio was shown to be larger for a previous rainfall of 1.0 mm or less, Fig. 5. Average runoff ratio for the non-rainfall days. Fig. 6. Average runoff ratio for the previous rainfall.

Fig. 7. Average runoff ratio for the previous rainfall (Under 1.0 mm).

Fig. 8. Average runoff ratio for the previous rainfall (30.0~50.0 mm).

Fig. 9. Average runoff ratio for the previous rainfall (50.0~100.0 mm).

Fig. 10. Average runoff ratio for the previous rainfall

(over 100.0 mm).

(6)

less was 0.60. The reason for the high runoff ratio despite a previous rainfall of 1.0 mm or less was that it was affected by the rainfall before the rainfall occurred. The analysis results of the previous rainfall by interval showed that the interval with the highest correlation between the runoff depth and the runoff ratio is the 30.0 50.0 mm interval, whose correlation between the runoff depth and the runoff ratio was found to be high, 0.9864 as shown in Fig. 8.

Fig. 9, shows the 50.0 100.0 mm previous rainfall interval and the correlation between the runoff depth and runoff ratio was found to be high, 0.92. The correlation between the runoff ratio and the runoff depth for a previous rainfall of 100.0 mm or less was found to be 0.64, as shown in Fig. 10. The analysis results of the previous rainfall by interval showed that the increase in a previous rainfall has some effect on the increase in the runoff ratio during the non-rainfall period.

4. Conclusion

In this study, the runoff characteristics of the non-rainfall period were examined using the daily rainfall data from 1977 to 2017 and the data of runoff into the dam. As a result, the following conclusions were obtained. The mean runoff depth was found to decrease with longer non-rainfall period in the Andong dam basin. The correlation coefficient between non-rainfall period and average runoff depth was found to be 0.85.

reached a maximum at 0.9864 for the 30 ~ 50 mm interval of the previous rainfall period, and this is the interval where the linearity of rainfall and runoff is the largest in the Andong dam basin. The correlation between the previous rainfall and runoff depth reached a maximum of 0.92 for the 50.0~100.0 mm interval. However, for rainfalls of 100.0mm or more, the correlation between the previous rainfall and runoff depth during the non-rainfall period was 0.64, which is relatively small. In this study, we investigated the runoff characteristics of the non-rainfall period in the Andong dam watershed. As a result, it was confirmed that the mean runoff decreased as with non-rainfall duration. For rainfalls of 30.0 100.0 mm, the average runoff and linearity during the non-rainfall period was large, and the linearity was found to be weak for rainfalls of greater than 100.0 mm. The results of this study can be used as data for water balance analysis and for formulating q water supply plan to establishing water resource management of Andong dam.

- This research is a reorganization of the doctoral dissertation

REFERENCES

Chang, H. J., Lee, H. S., 2015, “Assesment of continuous simulations of rainfall runoff models based on soil moisture accounting models at Guem River catchments, Korea”, J. KOSHAM, 15, 231-242.

Cho, H. J., Kim, J. S., Lee, K. B., 2000, “Long-term runoff

analysis using the TOPMODEL”, J. KWRA, 33,

(7)

393-405.

Gawk, Y. S., Kim, S. J., Lee, E. H., Hamm, S. Y., Kim, S.

H., 2016, “Soil water storage and antecedent precipitation index at Gwangneung Humid-Forested Hillslope”, J. Kor. Agri. and Forest met. 18, 30-41.

Im, S. S., Yoo, D. G., Kim, J. H., 2012, “Improvement of GR4J model applying soil moisture accounting process and its application in Korea Basin”, J.

KOSHAM, 12, 255-262.

Jung, Y. Y., Koh, D. C., Han, H. S., Kwon, H. I., Kim, E.

K., 2016, “Estimation of stream discharge using antecedent precipitation index models in a small mountainous forested catchment : Upper Reach of Yongsucheon Stream, Gyeryongsan Mountain”, J. soil and groundwater envi., 21, 36-45.

Kang, H. Y., Lee, S. H., Kim, J. S., 2015, “Characteristics changes of hydrologic variability at multi-purpose dams in Korea”, J. KOSHAM, 15, 123-130.

Kim, T. C., Ahn, B. K., Park, S. K., 1989, “Estimation of effective rainfall for daily streamflow”, J. KSAE, 31, 116-124.

Lee, M. W., Yi, C. S., Kim, H. S., Shim, M. P., 2005,

“Determination of suitable antecedent precipitation day for the application of NRCS method in the Korean Basin”, J. Kor. Wet. Soc., 7, 41-48.

Richard, B. D., Baumgather, J. V., Wigniton, R. Braunm, D, P., 1997, “How much water does a river need?”, Freshwater Biologyy, 37, 231-249.

Saxon, K. E., Lenz, A. T., 1967, “Antecedent retention indexes predict soil moisture”, J. Hydrau. Div. 93, 223-244.

www.wamis.go.kr

Yang, S. K., Kim, D. S., Jung, W. Y., 2014, “Rainfall -runoff characteristics in a Jeju Stream considering antecedent precipitation”, J. Envir. Sci. Inter., 23, 553-560.

Yoon, G. N., Shin, H. S., Kim, Y. T., 2015, “Effect of antecedent rainfall on infiltration characteristics in unsaturated Soil”, J. Kor. Geoth. Soc., 31, 5-15.

Zhao, Y., F, Wei., H, Yang., Jiang, Y., 2011, “Discussion

on using antecedent precipitation index to supplement

relative soil moisture data series”, Proce. Envi. Sci. 10,

1489-1495.

수치

Fig. 1. Location of Andong dam.  Fig. 2. Andong dam daily inflow (1977-2017).
Fig. 3.  Graph of non rainfall period days. Fig. 4.  Average runoff depth for the non-rainfall days.
Fig. 8.  Average runoff ratio for the previous rainfall  (30.0~50.0 mm).

참조

관련 문서

It is expected to be used for forecasting and analysis of precipitation structure and characteristics of mesoscale system causing heavy rainfall using the

In order to investigate the characteristics of Al/CFRP using friction spot joining, plunge depth, the rotation speed, and the dwell time were selected as parameters..

A Study on the Meteorological Characteristics Associated with Heavy Rainfall Case of July 9, 2009 Using KLAPS Reanalysis Data..

As a result of comparing the number of treatments per person by treatment behavior, the fluoride application during the preventive dental operation period was significantly

The Analysis of Characteristics of Heavy Rainfall over the Korean Peninsular, through Case Studies of Heavy Rainfall Events.. during the On - and Off -

This research is to conduct comparative analysis on the rain intensity of expected rainfall depth of the research-use X-band dual-polarimetric radar with that of actually

1 John Owen, Justification by Faith Alone, in The Works of John Owen, ed. John Bolt, trans. Scott Clark, "Do This and Live: Christ's Active Obedience as the

The concentration of the dissolved metal as well as that of the adsorbed to solid particles depends mainly on the concentration of the metal in the inflow water