Phorbol Ester Up-regulates Phospholipase D1 but Not Phospholipase D2 Expression through a PKC/Ras/ERK/
NF B-dependent Pathway and Enhances Matrix
Metalloproteinase-9 Secretion in Colon Cancer Cells *
□SReceived for publication, September 4, 2007, and in revised form, December 6, 2007Published, JBC Papers in Press, December 15, 2007, DOI 10.1074/jbc.M707416200
Dong Woo Kang‡, Mi Hee Park‡, Young Jun Lee§, Hyung Sik Kim§, Taeg Kyu Kwon¶, Won-Sang Park储, and Do Sik Min‡1
From the‡Department of Molecular Biology, College of Natural Science, and§College of Pharmacy, Pusan National University, Busan 609-735, Republic of Korea, the¶Department of Immunology, School of Medicine, Keimyung University,
194 Daegu 700-712, Republic of Korea, and the储Department of Pathology, College of Medicine, The Catholic University of Korea, Seoul 137-701, Republic of Korea
Despite its importance in cell proliferation and tumorigene- sis, very little is known about the molecular mechanism under- lying the regulation of phospholipase D (PLD) expression. PLD isozymes are significantly co-overexpressed with cancer marker genes in colorectal carcinoma. Phorbol 12-myristate 13-acetate (PMA) treatment, as a mitogenic signal in colon cancer cells, selectively increases PLD1 expression in transcription and post- transcription. Moreover, experiments using intraperitoneal injection of PMA into mice showed selective PLD1 induction in the intestine and lung tissues, which suggests its physiological relevance in vivo. Therefore, we have undertaken a detailed analysis of the effects of PMA on the promoter activity of PLD genes. Protein kinase C inhibitors, but not a protein kinase A inhibitor, were found to suppress the up-regulation of PLD1 but not PLD2. Dominant-negative mutants of Ras, Raf, and MEK suppressed the induction and activity of PLD1. Moreover, depletion of the supposedly involved proteins reduced the endogenous PLD1 protein level. An important role for NFB as a downstream target of ERK in PMA-induced PLD1 induction was also demonstrated using the inhibitor, small interfering RNA, chromatin immunoprecipitation assay, and site-specific mutagenesis. Furthermore, inhibitors of these signaling pro- teins and depletion of PLD1 suppressed PMA-induced matrix metalloproteinase-9 secretion and PLD1 induction. In conclu- sion, we demonstrate for the first time that induction of PLD1 through a protein kinase C/Ras/ERK/NFB-dependent pathway is involved in the secretion of matrix metalloproteinase-9 in colorectal cancer cells.
Colorectal cancer (CRC)2is one of the leading causes of can- cer death in much of the developed world, despite the facts that colonic malignancies can be effectively managed when detected early and that chemoprevention has shown some success in reducing the severity of the disease (1). Dysregulation of prolif- eration and apoptosis frequently occurs in the development of various human cancers. The unraveling of growth-regulatory pathways and the process of tumorigenesis has revealed new diagnostic and prognostic markers of disease as well as poten- tial targets for therapeutic intervention. Therefore, the discov- ery of new cancer-associated genes and their mechanisms of action is important for overcoming CRC.
Phospholipase D (PLD) has emerged as a critical regulator of cell proliferation and survival (2). Abnormalities in PLD expres- sion and activity have been observed in many human cancers (2). PLD hydrolyzes phosphatidylcholine, the predominant membrane phospholipid, and produces phosphatidic acid and free choline. Two mammalian isozymes of phosphatidylcho- line-specific PLD (PLD1 and PLD2) have been identified and are differentially regulated. PLD1 is activated by protein kinase C (PKC) and small G proteins of the Rho and ADP-ribosylation factor families, whereas PLD2 is not directly activated by these regulators (3). We have reported that overexpression of the PLD isozymes causes anchorage-independent growth and neo- plastic transformation of mouse fibroblasts (4). PLD1 has been reported as a critical downstream mediator of H-Ras-induced transformation (5). Mutation in the Ras oncogene is found in many human cancers (6) and can lead to the deregulated acti- vation of PLD and important downstream signaling pathways, including Raf/MEK/ERK (7) and PI3K/Akt (8). Moreover, PLD has been shown to be involved in the resistance of cancer cells to chemotherapeutic drugs (9, 10). Despite gathering evidence regarding the regulation of PLD activity in cell function, little is
*This study was supported by the Nation R&D Program for Cancer Control, Republic of Korea, Grant 0620040. The costs of publication of this article were defrayed in part by the payment of page charges. This article must therefore be hereby marked “advertisement” in accordance with 18 U.S.C.
Section 1734 solely to indicate this fact.
□S The on-line version of this article (available at http://www.jbc.org) con- tains supplemental Fig. S1.
1To whom correspondence should be addressed: Dept. of Molecular Biology, College of Natural Science, Pusan National University, 30 Jangjeon dong, Geumjeong gu, Busan 609-735, Republic of Korea. Tel: 82-51-510-3682;
Fax: 82-51-513-9258; E-mail: [email protected].
2The abbreviations used are: CRC, colorectal cancer; PLD, phospholipase D;
PMA, phorbol-12-myristate-13-acetate; DAG, diacylglycerol; PKC, protein kinase C; ChIP, chromatin immunoprecipitation; MMP-9, matrix metallo- protease-9; RT, reverse transcription; GAPDH, glyceraldehyde-3-phos- phate dehydrogenase; PI3K, phosphatidylinositol 3-kinase; MEK, mito- gen-activated protein kinase/extracellular signal-regulated kinase kinase;
ERK, extracellular signal-regulated kinase.
at KEIMYUNG UNIV MED LIB on January 10, 2016http://www.jbc.org/Downloaded from at KEIMYUNG UNIV MED LIB on January 10, 2016http://www.jbc.org/Downloaded from at KEIMYUNG UNIV MED LIB on January 10, 2016http://www.jbc.org/Downloaded from at KEIMYUNG UNIV MED LIB on January 10, 2016http://www.jbc.org/Downloaded from at KEIMYUNG UNIV MED LIB on January 10, 2016http://www.jbc.org/Downloaded from at KEIMYUNG UNIV MED LIB on January 10, 2016http://www.jbc.org/Downloaded from
known about the functional role and regulatory mechanisms of PLD expression.
Phorbol esters, such as phorbol-12-myristate-13-acetate (PMA), can substitute for diacylglycerol (DAG; the endogenous PKC activator) and function as tumor promoters. Phorbol esters have been reported to modulate diverse cellular responses, such as gene transcription, mitogenesis, and differ- entiation, tumor promotion, and apoptosis, through the PKC signaling pathway (11, 12). PMA protects cells from stimuli- induced apoptosis through a mechanism that is dependent on the activation of PKC (13). However, the signaling pathways involved in PMA-induced PLD expression have not been defined. HCT116 human colon cancer cells contain the most common K-ras mutation type found in colorectal cancers, the glycine to aspartate mutation at codon 12 (14). Because many growth factors utilize Ras-dependent signaling pathways, this cell line serves as a model system for studying alterations in gene expression that occur during the progression of CRC.
Secretion of matrix metalloproteinases (MMPs) from cancer cells is an important stage of metastatic spread. MMPs hydro- lyze components of the extracellular matrix and allow the inva- sion of cancer cells from their primary site to the circulation and secondary sites (15–17). Various stimuli, including PMA, have been shown to induce the secretion of MMP-9 from can- cer cell lines (18), including human fibrosarcoma line HT 1080 (19, 20). Thus, we investigated the involvement of PLD1 induc- tion in PMA-stimulated MMP-9 secretion.
The present study was conducted to define the cellular mechanisms that regulate the expression of PLD isozyme in human colon cancer cells. Here, we demonstrate for the first time that induction of PLD1 through the PKC/Ras/ERK/NFB- dependent pathway is involved in the secretion of MMP-9 in colorectal cancer cells.
EXPERIMENTAL PROCEDURES
Materials—PMA and DAG were purchased from Sigma.
Various inhibitors were obtained from Calbiochem. The oli- gonucleotides of NFB-binding sites were purchased from Genotech (Daejeon, Republic of Korea). The siRNA of human PLD1 (nucleotides 1486 –1506, AAGGUGGGAC- GACAAUGAGCA) and PLD2 (nucleotides 2665–2685, AAUGGGGAUGCGGAUAAAGGC) were purchased from Dharmacon Research Inc. (Lafayette, CO). The siRNAs of PKC␣, Ras, and ERK were obtained from Cell Signaling Inc.
(Beverly, MA). Dual luciferase assay kits were purchased from Promega (Madison, WI). Polyfect transfection reagent was pur- chased from Qiagen.
Cell Culture—Human colon cancer cells (HCT116, DLD1, LS174T, RKO, CaCO2, and SNU-C5) and breast cancer cells (SK-BR3, MCF7) were purchased from ATCC (Manassas, VA).
HCT116, DLD1, SNU-C5, and MCF7 were incubated in RPMI 1640 medium containing 10% heat-inactivated fetal bovine serum with penicillin/streptomycin (Invitrogen). LS174T, RKO, CaCO2, and SK-BR3 cells were grown in Dulbecco’s modified Eagle’s medium supplemented with 10% fetal bovine serum.
Animals and Treatments—ICR female mice (6 weeks of age, weighing⬃18–21 g) were obtained from Oriental Laboratories
(Seoul, Republic of Korea). During this study, the mice received standard rodent chow and acidified tap water ad libitum. After acclimatization for 1 week, female mice were injected intraperi- toneally with PMA three times at doses of 0.015 or 0.15 mg/kg over the course of 1 week (n⫽ 5 samples). Controls received an equal volume of corn oil in the same manner.
Preparation of Human CRCs Samples and Immuno- histochemistry—Formalin-fixed and paraffin-embedded sam- ples were obtained from surgical resections of 122 colorectal cancers. The tumor stage was classified according to Dukes’
criteria (21). There were 12, 47, 55, and eight cases with stage A, B, C, and D, respectively. Two pathologists screened histologi- cal sections and selected areas of the representative tumor cells.
Three tissue cores (0.6 mm in diameter) were taken from each tumor sample and placed in a new recipient paraffin block using a commercially available microarray instrument (Beecher Instruments, Micro-Array Technologies, Silver Spring, MD) according to established methods (22). One cylinder of normal colonic mucosa adjacent to each tumor was also transferred to the recipient block. Immunohistochemical analysis was per- formed as described previously (23).
Cloning of the Promoter Regions of Human PLD1 and PLD2—
Approximately 1.9- and 2.6-kb genomic DNA fragments cov- ering the 5⬘ upstream regulatory sequences of human PLD1 or PLD2, respectively, were amplified from human genomic DNA and cloned into a pGL4.14b luciferase reporter plasmid (Pro- mega, Madison, WI) and were then used for promoter analysis.
For further detail, see supplementaldata.
Transient Transfection, Luciferase Assays—Cells were seeded onto 24-well plates at 1⫻ 105cells/well and grown to 50 – 60% confluence. Transfection and luciferase assays were performed as described previously (12).
RNA Isolation and Reverse Transcription PCR (RT-PCR)—
Total RNA was isolated from cells using TRIzol reagent (Sigma). First strand cDNA was synthesized using 5g of total RNA with Moloney murine leukemia virus reverse tran- scriptase (Promega, Mannheim, Germany). The reaction was incubated at 80 °C for 5 min and 42 °C for 90 min, and Moloney murine leukemia virus reverse transcriptase was inactivated at 95 °C for 5 min. The synthesized cDNA was amplified using PLD1, PLD2, and GAPDH primers with an Eppendorf thermo- cycler (Eppendorf Scientific, Westbury, NY). PCR products were analyzed by 1.5% agarose gel electrophoresis with ethidium bromide staining. For PCR conditions and primer sequences, see supplemental data.
Immunoprecipitation and Western Blotting—The cells or tis- sues were analyzed by immunoblotting or immunoprecipita- tion as described previously (24). ECL was used to detect the signal. The following antibodies were used: anti--tubulin (Sigma); anti-NFB (p65) antibody (Santa Cruz Biotechnolo- gy); anti-PKC␣ antibody (Santa Cruz Biotechnology); and anti- ERK antibody (Cell Signaling Inc., Beverly, MA). Rabbit poly- clonal anti-PLD antibody that recognizes both PLD1 and PLD2 was generated as described previously (4).
Chromatin Immunoprecipitation (ChIP) Assay—ChIP experiments were essentially performed as described previ- ously (25), with minor modifications. For further details, see supplemental data.
at KEIMYUNG UNIV MED LIB on January 10, 2016http://www.jbc.org/Downloaded from
PLD Activity Assay—PLD activity was assessed by measuring the formation of [3H]phosphatidylbutanol, the product of PLD- mediated transphosphatidylation, in the presence of 1-butanol as described previously (24).
Zymography—HCT116 cells were seeded in 12-well plates at 1⫻ 105cells/ml and were washed and refreshed with serum- free Dulbecco’s modified Eagle’s medium for 24 h. The condi- tioned media of the cells were determined by 0.1% casein zymography. Zones of caseinolytic activity were detected as clear bands against a blue background.
Measurement of Cell Viability and Apoptosis—For the cell viability assay, a 3-(4,5-dimethylthiazol-2-yl)-2,5-diphenyltet- razolium bromide assay was performed. Absorbance was meas- ured using a spectrophotometer at 540 nm, and viability was expressed relative to the control. Cell apoptosis was measured using an Annexin V binding assay (Molecular Probes), which was performed according to the protocol of the manufacturer.
Annexin V-positive cells were quantitated. More than 200 cells were counted for each variable per experiment using fluores- cence microscopy (Axiovert 200M, Zwiss, Germany).
Statistics—The results are expressed as means⫾ S.E. of the number of determinations indicated. Statistical significance of differences was determined by analysis of variance. The correlation between PLD expression and various clinico- pathologic parameters and Ki-67,-catenin, and phospho- Akt expression were assessed using the2and Bartholomew tests. A p value less than 0.05 was considered to indicate statistical significance.
RESULTS
PLD Isozymes Are Significantly Co-overexpressed with Can- cer Marker Genes in Human Colorectal Cancer—The expres- sion and activity of PLD isozymes have been reported to be highly up-regulated in many cancer tissues (2), but the number of cases in each study was small. Thus, using a tissue microarray containing 122 CRCs obtained from surgery, we attempted to investigate the expression of PLD isozymes and their associa- tion with clinicopathological parameters involving tumor stage, lymph node metastasis, and other cancer marker genes, which are important factors in prognosis. The expression level of PLD isozymes was assessed by immunohistochemistry. As shown in Fig. 1A, using the antibody to PLD that recognizes both PLD1 and PLD2, PLD expression was detected as faint or negative in normal colonic mucosa. Occasional weak staining of PLD was observed in inflammatory cells in lamina propria. No immuno- reactivity was observed in connective tissues; thus, these tissues served as internal negative controls. Immunopositivity for PLD protein was clearly marked in colorectal tumor cells (Fig. 1B).
The tumors were interpreted as negative when immuno- staining was weak, as in the corresponding normal colonic mucosa, or when immunopositive cells represented⬍5% of the cancer cells. Table 1 summarizes the relationship between clin- FIGURE 1. Expression of PLD, Ki-67,-catenin, and p-Akt in normal
colonic mucosa and cancers. A tissue microarray containing 122 human colorectal cancer tissues was subjected to immunohistochemical analyses with primary antibodies. A positive immunohistochemical reaction is indi- cated by diaminobenzidine (brown staining), and hematoxylin was used as a nuclear counterstain. Representative images from normal colonic mucosa and cancer tissue are shown. A, normal colonic mucosa. Note that immuno- reactivity for PLD is not present in the normal colonic mucosal epithelial cells.
Inflammatory cells in lamina propria demonstrate negative to weak staining.
B, colon cancer. Note that tumor cells demonstrate strong labeling for PLD, whereas connective tissues in the stroma of cancer specimens are not stained for PLD. C, normal colonic mucosa showed immunonegativity for Ki-67.
D, colon cancer cells showing strong nuclear staining for Ki-67. E, in normal colonic mucosa,-catenin was lightly stained in the membranes of the colonic epithelial cells. F, colon cancers showed strong nuclear and/or cyto- plasmic staining for-catenin. G, normal colonic mucosa was immunonega- tive for p-Akt. H, colon cancer cells demonstrated strong cytoplasmic staining for p-Akt protein (original magnification was⫻200).
TABLE 1
Relationship of PLD expression detected by immunohistochemistry and clinicpathological parameter in colorectal carcimoma
The correlation between PLD overexpression and clinicopathologic parameters involving tumor stage and lymph node metastasis was analyzed by immunohisto- chemistry using a tissue microarray containing 122 human colorectal carcinomas.
In addition, the correlation between PLD expression and the expression of Ki-67,
-catenin, or p-AKT in these cancer samples was also analyzed for examination of proliferative capacity in CRCs with overexpression of PLD. A positive or negative sign means strong immunostained tissues and faint or negative immunostained tissues, respectively. L/N, lymph node.
PLD p value
ⴙ ⴚ
Stage ⬎0.05a
A 6 6
B 29 18
C 33 22
D 6 2
L/N metastasis 0.4583b
⫹ 39 22
⫺ 35 26
Ki-67 0.0019b
⫹ 63 29
⫺ 11 19
-Catenin 0.0000b
⫹ 64 24
⫺ 10 24
p-Akt 0.0000b
⫹ 43 10
⫺ 31 38
aBartholomew test.
b2test.
at KEIMYUNG UNIV MED LIB on January 10, 2016http://www.jbc.org/Downloaded from
icopathological features and PLD expression in colorectal car- cinoma. Overexpression of PLD isozymes was detected in 74 (60.1%) of 122 colorectal cancers (Table 1). However, no signif- icant association was found between the PLD expression level and tumor stage or lymph node metastasis (Table 1). Addition- ally, to determine the proliferative capacity in CRCs with over- expression of PLD, we also examined the correlation between the expression of PLD and the expression of Ki-67,-catenin, or p-AKT in cancer samples. We compared the expression pat-
tern of the proteins in tumor cells and corresponding normal cells and interpreted results as being positive or showing overexpression when immunostaining was stronger than that of corresponding normal cells.
In immunohistochemical analyses, corresponding normal colonic mucosa showed negative or weak staining for-catenin, Ki-67, and p-Akt (Fig. 1, C, E, and G). PLD isozymes were significantly co- overexpressed with early stage cancer marker genes, such as Ki-67,-catenin, or p-Akt in colo- rectal carcinoma (Fig. 1, B, D, F, and H, and Table 1). These find- ings suggest that PLD plays an important role in the progression of early stages of development of colon carcinogenesis.
PMA Up-regulates the Expression of PLD1, but Not PLD2, in Human Colon Cancer Cells and Mice—To investigate the signaling pathways responsible for PLD expression in CRC, we examined the effects of PMA on PLD expression in HCT116 cells. Treatment with PMA markedly increased PLD1 mRNAexpressioninatime-anddose- dependent manner (Fig. 2A). In contrast, PLD2 isozyme was not sig- nificantly affected by PMA. In addi- tion, the induction of PLD1 mRNA levels by PMA resulted in the corre- sponding induction of PLD1 protein (Fig. 2B). Moreover, DAG increased the expression of PLD1 protein, but not PLD2, in a dose-dependent manner (Fig. 2C). To assess the physiological relevance in vivo, we examined the PLD expression after intraperitoneal injection of PMA into five different mice. Strikingly, PMA treatment significantly induced the expression of PLD1 in the intestine and lung tissues, com- pared with vehicle (Fig. 2D). How- ever, PLD2 expression in these tissues was not detected by anti- PLD antibody, which recognizes both PLD1 and PLD2. Taken together, these results demonstrate that PMA, which is known to activate PKC and then PLD, selectively up-regulates the expression of PLD1 in HCT116 cells as well as mice.
Cloning of the Promoter Region of Human PLD1 and PLD2 Genes—To determine how PMA is able to regulate PLD gene expression and what its transcriptional mechanism might be, we have cloned the promoter regions of human PLD1 (pGL4- FIGURE 2. PMA selectively up-regulates the expression of PLD1 in HCT116 cells and mice. A, HCT116 cells
were treated with vehicle or PMA (100 nM) for the indicated times or with various concentrations of PMA for 24 h. Expression of PLD isozymes and GAPDH was analyzed by RT-PCR. The levels of PLD expression were determined by densitometer analysis. The cells were treated with PMA (100 nM) for various times (B) or treated with various concentrations of DAG for 24 h (C). PLD expression was analyzed by immunoprecipitation and Western blot analysis. These blots are representative of results obtained from three experiments. D, mouse tissues obtained after peritoneal injection of PMA were analyzed for PLD expression using Western blot anal- ysis. These blots are representative of results obtained from three experiments.
at KEIMYUNG UNIV MED LIB on January 10, 2016http://www.jbc.org/Downloaded from
PLD1; 1.9 kb) transcribed from exon 2 among two alternate transcripts of PLD1 to be transcribed at two different transcrip- tion sites (exons 1 and 2) and human PLD2 (pGL4-PLD2; 2.6 kb) transcribed from exon 1, on the basis of human genome data from the NCBI data base. Supplemental Fig. S1shows the schematic diagrams of genomic DNA structure and the pro- moter regions of the human PLD1 and PLD2 genes.
PMA Increases the Transcriptional Activity of PLD1 Pro- moter—To investigate whether PMA increases the transcrip- tional activities of PLD genes, HCT116 cells were transiently transfected with PLD-luc and treated with PMA. PMA increased the promoter activity of PLD1 in a time- and dose- dependent manner but did not increase the promoter activity of PLD2(Fig. 3, A and B). The PLD2 promoter showed higher basal activity compared with that of PLD1. These results dem- onstrate that PMA selectively up-regulates the transcriptional activity of PLD1 but not that of PLD2.
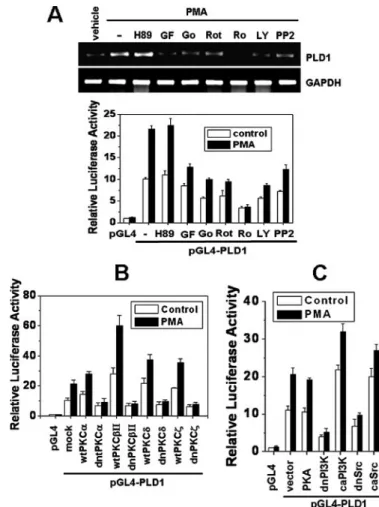
PMA-stimulated PLD1 Induction Is Mediated via the PKC Pathway—Therefore, to examine the signaling pathways lead- ing to PMA-mediated PLD1 induction, HCT116 cells were pre- treated with various PKC inhibitors (GF109203x, Go6976,
Ro-31-8220, Rottlerin) and PI3K inhibitor (LY294001) or a pro- tein kinase A inhibitor (H89) prior to the addition of PMA. As shown in Fig. 4A, PMA-induced PLD1 mRNA expression was blocked by all of the PKC inhibitors, inhibitors of PI3K, and Src tyrosine kinase but not by a protein kinase A inhibitor. Further- more, the effects of these inhibitors on mRNA expression of PLD1were correlated with the results obtained from the PLD1 promoter assay, which suggests that the effects are mediated through an increase in transcription (Fig. 4A). To further con- firm this observation, the cells were transfected with various constructs with PLD1-luc. Wild-type PKC-␣, -II, -␦, or -
stimulated PLD1 promoter activity, but its dominant negative mutants suppressed both basal and PMA-stimulated promoter activities (Fig. 4B). Furthermore, dominant negative PI3K (p85) and Src, but not protein kinase A, inhibited PMA-stimulated PLD1promoter activity (Fig. 4C). However, dominant active PI3K (p110) and Src enhanced its activity. Taken together, these results, which utilized complementary approaches, dem- FIGURE 3. PMA selectively stimulates the promoter activity of PLD1 but
not that of PLD2. HCT116 cells were transiently transfected with the reporter constructs and treated with vehicle or 100 nMPMA for the indicated times (A) or with various concentrations of PMA (10, 20, 50, 100 nM) for 24 h (B), and luciferase activity was subsequently measured. A Renilla luciferase control vector was co-transfected to normalize the transfection efficiency. Values represent averages of four independent assays, and S.D. values are shown by error bars.
FIGURE 4. PMA-induced PLD1 expression is dependent on PKC, PI3K, and Src. A, HCT116 cells were pretreated with various inhibitors and treated with or without 100 nMPMA. The expression of PLD1 and GAPDH was determined by RT-PCR analysis (top). The cells were transfected with pGL4-PLD1 reporter construct and pretreated with the indicated inhibitor for 1 h, followed by treatment with 100 nMPMA for 20 h (bottom). The concentrations of inhibi- tors used are as follows: 10MH89, 2MGF109203x (GF), 10MGo¨-6976 (Go), 5MRotterin (Rot), 5MR0-31-8220 (Ro), 20MLY294002 (LY), 10MPP2.
B and C, the cells were co-transfected with pGL4-PLD1 and the indicated expression vectors, treated with 100 nMPMA for 24 h, and then measured for luciferase activity. wt, wild type; dn, dominant negative; ca, catalytically active. Results shown are means⫾ S.E. of three independent experiments.
at KEIMYUNG UNIV MED LIB on January 10, 2016http://www.jbc.org/Downloaded from
onstrate a contributory role for these PKCs, PI3K, or Src in PMA-mediated PLD1 induction.
PMA-induced PLD1 Expression Occurs in Other Human Cancer Cell Lines—To examine whether PMA-induced expres- sion of PLD1 is specific to the HCT116 cells or also occurs in other human cancer cells, the colon cancer cells (HCT116, CaCo2, LS174T, RKO, DLD1, and SNU-C5) and breast cancer cells (SK-BR3, MCF7) were treated with PMA, and PLD1 expression was analyzed by RT-PCR and Western blot analysis (Fig. 5A). The induction of PLD1 mRNA and protein was observed in the HCT116, CaCo2, SNU-C5, SK-BR3, and MCF7 cancer cells and was blocked by Ro31– 8220. In contrast, PMA- induced PLD1 expression was not detected in LS174T, RKO, and DLD1 cells. Using antibody to pan-phospho-PKC, we found that the cells that were responsive to PMA (except for MCF7 cells) showed relatively low basal PKC activation com- pared with that of the cells that were unresponsive to PMA (Fig.
5B). For DLD1 cells, the PKC inhibitor did not greatly affect PLD1 expression. Although responsiveness to PMA may be partly related to the extent of basal PKC activation in different cancer cells, it is possible that these cell-specific differences in PMA-induced PLD1 expression might be related to differences in the genetic profiles of these tumors.
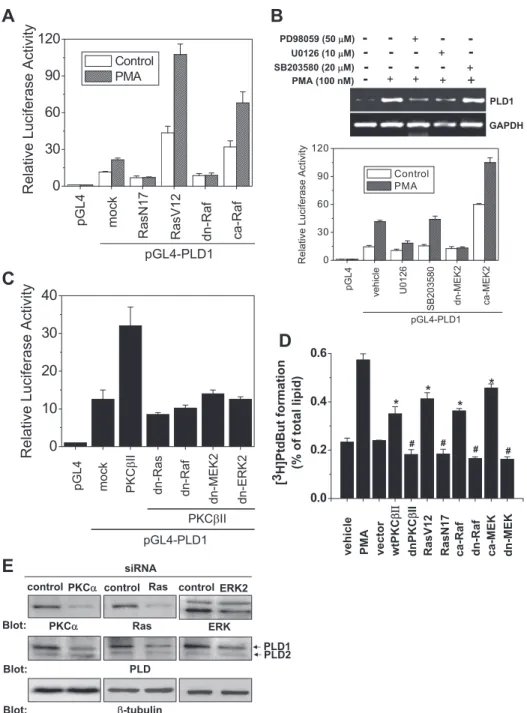
Ras/Raf/ERK Pathways Are Required for the Induction of PLD1 by PMA—We next investigated whether Ras, a down- stream target of PKC (26), is also involved in the signaling cas-
cade. As shown in Fig. 6A, expression of Ras-N17 (inactive mutant) significantly suppressed both basal and PMA-stimu- lated PLD1 promoter activity. Conversely, expression with Ras- V12 (active mutant) significantly stimulated its promoter activ- ity. Ras activates multiple parallel pathways that involve Raf, MEK, and ERK kinases (26). Like Ras, Raf enhanced PLD1 pro- moter activity in a similar pattern (Fig. 6A). These results indi- cate that Ras and Raf are involved in PMA-induced PLD1 up- regulation. Moreover, we investigated the role of MEK/ERK, acting downstream of Ras, in the regulation of PLD1 expres- sion. Pretreatment with MEK inhibitors (PD98059, U0126) and overexpression of the dominant negative mutant of MEK2, but not p38 inhibitor (SB203580), significantly blocked PMA-me- diated PLD1 expression, as measured by RT-PCR and a pro- moter assay (Fig. 6B). The JNK inhibitor had no effect on the induction of PLD1 (data not shown). PKCII-stimulated PLD1 induction was suppressed by the expression of dominant nega- tive mutants of Ras, Raf, MEK2, and ERK2 (Fig. 6C). Further- more, we examined the relationship between enhanced PLD1 expression and PLD activity. As shown in Fig. 6D, transfection of PKC-II, Ras-V12, catalytically active Raf, and MEK, but not its dominant negative mutant, enhanced PLD activity, which suggests that PKC and these proteins are responsible for an increase in PLD activity in the colon cancer cells. In addition, PMA increased the phosphorylation of ERK, Akt, and Src kinase in a time-dependent manner (data not shown). More- over, we investigated whether depletion of the supposedly involved protein affects PLD1 expression. Using siRNA, the depletion of PKC␣, Ras, and ERK2 reduced the endogenous PLD1 protein level (Fig. 6E). Taken together, these results sug- gest that PMA stimulated the induction of PLD1, and thus, the activity might be mediated via PKC/Ras/Raf/MEK/ERK signal- ing pathways in HCT116 colon cancer cells.
NFB Induces PMA-mediated PLD1 Expression, but Not PLD2 Expression, and Increases PLD Activity—PMA is known to activate NFB, which has been shown to be a downstream target gene of MEK/ERK (27). Thus, we investigated whether NFB plays a role in PMA-stimulated PLD1 induction. As shown in Fig. 7A, pretreatment with PDTC, an NFB inhibitor, and overexpression of the dominant negative mutant of IB␣
(S32A/S36A) significantly blocked PMA-mediated PLD1 tran- scriptional expression. However, ectopic expression of NFB (p65) enhanced the promoter activity, protein expression, and enzymatic activity of PLD1 in a dose-dependent manner but did not significantly affect those of PLD2 (Fig. 7, B–D). Further- more, transfection of siRNA for NFB (p65) decreased PMA- stimulated PLD1 protein expression (Fig. 7E). Taken together, these results demonstrate that NFB is required for the PMA- induced expression and activation of PLD1.
Identification of NFB-binding Sites Responsible for PMA- induced PLD1 Expression—Next, we attempted to examine the regions that are responsible for PMA-induced PLD1 expres- sion. Treatment with PMA and ectopic expression of NFB enhanced the promoter activity of PLD1 in all of the deletion constructs (Fig. 8A). We found four putative NFB-binding sites in the PLD1 promoter using bioinformatics (Fig. 8B). To determine if NFB (p65) could directly bind to the PLD1 pro- moter in vivo and to further define the NFB response elements FIGURE 5. Cell-specific differences in PMA-mediated PLD1 induction.
A, various cancer cells were pretreated with Ro31-8220 (5M) and stimulated with PMA (100 nM) for 24 h. The proteins were extracted and analyzed by Western blotting using antibody to PLD1 or -tubulin. Total RNA was extracted, and expression for PLD1 and GAPDH was determined by RT-PCR.
B, to examine the endogenous PKC activation states, lysates from these cells were analyzed by immunoblotting using anti-pan-phospho-PKC antibody.
These blots are representative of results obtained from three experiments.
at KEIMYUNG UNIV MED LIB on January 10, 2016http://www.jbc.org/Downloaded from
to the promoter, a chromatin immunoprecipitation assay was carried out after treatment with PMA. PCR was performed using primers designed to amplify the four putative NFB- binding regions, as shown in Fig. 8B. PMA enhanced the bind- ing of p65 to the two NFB-binding sites of the PLD1 promoter
(NFB-1 and NFB-4), showing especially strong binding of NFB to the NFB-1 site. These results are comparable with those of the dele- tion promoter assay. As a positive control, the binding of NFB to the promoter of c-IAP2 was enhanced by PMA (28). These data suggest that NFB may play a role as an acti- vator of the transcription of PLD1.
Furthermore, mutagenesis of NFB-1 and NFB-4 sites attenu- ated PMA-induced PLD1 promoter activity (Fig. 8C). These findings demonstrate the functional impor- tance of NFB in the PMA-induced induction of PLD1 in HCT116 cells.
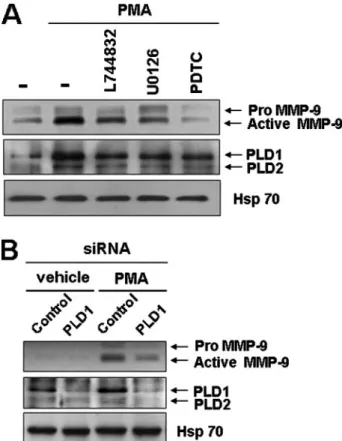
PMA-induced PLD1 Induction Is Involved in the Secretion of MMP-9 via Ras/ERK/NFB in Colon Cancer Cells—MMPs are well known to be involved in the invasion of tumor cells. PLD has been shown to be essential for the induction of MMP-9 expression by several stim- uli (29 –31). Thus, we examined whether PMA-induced PLD1 induction is involved in the secretion of MMP-9 in HCT116 colon cancer cells. As shown in Fig. 9A, inhibitors that were specific for Ras (L744832), ERK (U0126), and NFB (PDTC), which are involved in the induction of PLD1 by PMA, suppressed PMA-in- duced MMP-9 secretion and PLD1 induction. Moreover, depletion of PLD1 inhibited PMA-induced MMP-9 secretion, as analyzed by zymography. Taken together, these results suggest that PMA-induced expression of PLD1 via a Ras/ERK/
NFB pathway might mediate inva- siveness associated with the secre- tion of MMP-9 in HCT116 cells.
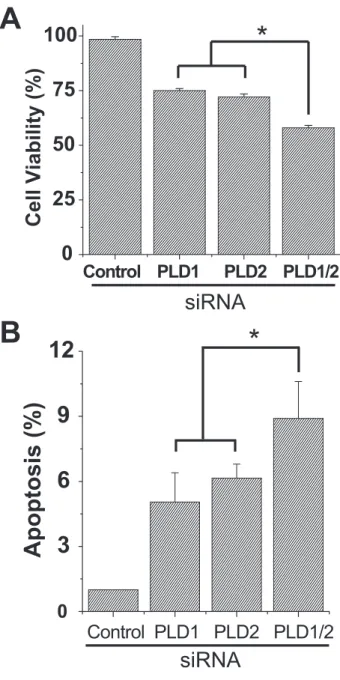
Depletion of PLD Decreases Cell Viability and Increases Apoptosis—
Furthermore, we attempted to inves- tigate the effect of the depletion of PLD isozyme on cell viability and apo- ptosis in cancer cells. As shown in Fig.
10, the depletion of PLD1 or PLD2 using siRNA decreased cell viability and increased apoptosis compared with those of control siRNA, as measured by 3-(4,5-dimethylthi- azol-2-yl)-2,5-diphenyltetrazolium bromide assay and Annexin V binding assay. Depletion of both PLD1 and PLD2 significantly sup- pressed cell viability and enhanced apoptosis compared with that of either PLD isozyme. Taken together, these results suggest that 0
30 60 90 120
Relative Luciferase Activity
Control PMA
pGL4 mock RasN17 RasV12 dn-Raf ca-Raf
pGL4-PLD1
A
- + + + +
PD98059 (50 µM)
PMA (100 nM) U0126 (10 µM) SB203580 (20 µM)
- - -
- - -
+- -
-
+
- - -
+
PLD1 GAPDH
B
0 30 60 90 120
Relative Luciferase Activity
Control PMA
pGL4 U0126 SB203580 dn-MEK2 ca-MEK2
pGL4-PLD1
vehicle
C
0 10 20 30 40
Relative Luciferase Activity pGL4 mock PKCβII dn-Ras dn-Raf dn-MEK2 dn-ERK2
pGL4-PLD1 PKCβII
D
vehicle PMA vector wtPKCβΙΙ dnPKCβII RasV12 RasN17 ca-Raf dn-Raf dn-MEKca-MEK
0.0 0.2 0.4 0.6
# #
#
*
* *
[3H]PtdBut formation (% of total lipid)
*
#
siRNA
control PKCα control Ras controlERK2
PKCα Ras ERK
PLD1PLD2 Blot:
Blot: PLD
Blot: β-tubulin
E
FIGURE 6. PMA-induced PLD1 expression is mediated by a Ras/Raf/ERK pathway. A, HCT116 cells were cotransfected with pGL4-PLD1 and the indicated expression vectors. After 16 h of transfection, the cells were treated with 100 nMPMA for 20 h, and the luciferase activity was then measured. B, the cells were pretreated with the indicated inhibitors and treated with PMA for 24 h. Expression of PLD1 and GAPDH was analyzed by RT-PCR (top). The cells were transfected with pGL4-PLD1, pretreated with the indicated inhibitors, and treated with PMA for 20 h. After 16 h of cotransfection with pGL4-PLD1 plus the dominant negative or active mutant of MEK2, the cells were treated with 100 nMPMA for 20 h, and the luciferase activity was then measured (bottom).
C, HCT116 cells were cotransfected with pGL4-PLD1 and the indicated expression vector. Activities were nor- malized to the reading for the Renilla luciferase internal control and are shown as the average of four assays with S.D. value shown as error bars. D, the cells were transfected with various constructs for 24 h, labeled with [3H]myristate for 12 h, and treated with or without PMA (100 nM) for 1 h, and the PLD activity was then measured as described under “Experimental Procedures.” Results shown are means⫾ S.E. of three independ- ent experiments. *, p⬍ 0.01; #, p ⬍ 0.05 compared with mock transfectants. E, the cells were transfected with siRNA specific for PKC␣, K-Ras, and ERK2 or control siRNA for 48 h. The lysates were immunoblotted with the indicated antibodies. These blots are representative of results obtained from three experiments.
at KEIMYUNG UNIV MED LIB on January 10, 2016http://www.jbc.org/Downloaded from
PLD might play some roles in the cell survival and antiapoptotic functions in cancer cells.
DISCUSSION
Abnormalities in the expression and activity of PLD have been reported in various human cancers using small numbers
of tumor samples, but its clinico- pathological significance remains unclear. In this study, using 122 colorectal carcinomas obtained from surgery, we found that PLD overexpression was detected in 74 (60.1%) of 122 colorectal cancers.
However, no significant association was found between the PLD expres- sion level and tumor stage or lymph node metastasis. Our observations indicated that PLD isozymes are significantly co-overexpressed in human CRCs with Ki-67,-catenin, or p-Akt, which are involved in the early stages of the development of colon cancer. Thus, it is suggested that PLD may contribute to the pro- gression of colorectal carcinoma in the clinical setting.
Despite extensive information regarding the regulation of PLD activity in cell function, the signal- ing mechanisms that regulate PLD expression in cancer remain unde- fined. In the present study, we dem- onstrate for the first time that acti- vation of PKC by PMA enhances the expression of PLD1, but not that of PLD2, via an NFB-dependent pathway in colon cancer cells and suppresses apoptosis. Selective induction of PLD1 by PMA was also confirmed in the tissues of mice injected with PMA, thus suggesting its physiological relevance. Moreover, PMA-induced expression of PLD1 was not noted in all of the cancer cell lines examined. The specificity of PLD1 induction in certain cancer cells might be partly associated with endogenous PKC activation states, depending on cell types, but there are the other possible explanations for this phenomenon, including different genetic profiles of cancer cells or the sensitivity of the assays.
In this study, we found for the first time that PMA selectively up- regulates the induction of PLD1, but not PLD2, via a Ras/Raf/MEK/ERK/
NFB signaling pathway in HCT116 colorectal cancer cells. Elevated expression of these induced proteins also enhanced PLD activ- ity. Moreover, depletion of these supposedly involved proteins reduced the PLD1 protein level. Recently, Kikuchi et al. (32) reported that Ewing’s sarcoma fusion protein induces the expression of the PLD2 gene but not that of the PLD1 gene.
FIGURE 7. NFB is required for the transcriptional activation of PLD1 by PMA. A, HCT116 cells were preincu- bated for 30 min with PDTC (50M) and then treated with PMA (100 nM) for 24 h. Cells were transfected with the indicated expression vector. After 12 h, cells were treated with PMA or vehicle (top). The expression of PLD isozymes was examined using RT-PCR. The same methods were performed after transfection of pGL4-PLD1, and the luciferase activity was measured (bottom). B, the cells were cotransfected with NFB (p65) at various doses (0, 50, 100, 200, 400, and 600 ng) and with pGL4-PLD, and the luciferase activity was then measured. C, HCT116 cells were transfected with NFB (p65) at various doses (0, 0.5, 1, and 2 g), and the lysates were immunoprecipitated or immunoblotted with antibodies to the indicated antibodies. D, the cells were transfected with NFB (p65) at various doses for 24 h, labeled with [3H]myristate for 12 h, and treated with or without PMA (100 nM) for 1 h, and the PLD activity was then measured as described under “Experimental Procedures.” Results shown are means⫾ S.E. of three independent experiments. #, p⬍ 0.05 versus vector; *, p ⬍ 0.05 versus PMA treatment. E, the cells were transfected with siRNA specific for NFBorcontrolsiRNA(NS,nonspecific)andweretreatedwithorwithout100nMPMA for 24 h. The lysates were immunoprecipitated and immunoblotted with anti-PLD antibody. The levels of PLD expression were deter- mined by densitometer analysis. The expression levels of NFB (p65) and -tubulin proteins were determined by Western blot analysis. These blots are representative of results obtained from three experiments.
at KEIMYUNG UNIV MED LIB on January 10, 2016http://www.jbc.org/Downloaded from
NFB has been reported to regulate transcription of a num- ber of target genes related to tumorigenesis and cell survival, including TRAF1, TRAF2, cIAP-1, cIAP-2, and FLIP (28, 33, 34). Analysis of the PLD1 promoter shows the presence of two functional NFB sites; the binding of these sites to the PLD1 promoter is enhanced by PMA, and the mutation of these sites suppresses PMA-induced PLD1 expression. NFB plays a role in the enhanced survival of colon cancer cells, and inhibition of NFB sensitizes colon cancers that are resistant to chemother- apy-induced apoptosis (35). These results suggest that NFB activation is a critical step in the tumor-promoting effect of PMA. Despite these important findings, the signaling pathways involved in PMA regulation of genes that are directly involved in cell death or death resistance remain largely unknown. Our current study shows that expression of PLD1 is regulated through the PKC-stimulated activation of NFB.
The secretion of MMP-9 from cancer cells (36, 37) leads to hydrolysis of the extracellular matrix, thus enabling cells to
-1930 -1530
-1230 -930
-633 -330
LUC LUC LUC LUC LUC LUC
LUC
0 30 60 90 120 150 180
NF-κ B(p65)/PMA NF-κ B(p65) pcDNA3/PMA
pcDNA3
Relative Luciferase Activity (Fold of pGL4 control)
pGL4 pGL4-PLD1
A
IgG Input p65
PMA - + - + - +
NFκB-1 NFκB-2
NFκB in c-IAP2 promoter NFκB-3
NFκB-4
B
X Y Z [
(-1640/-1251) (-1321/-1071) (-1024/-510) (-210/+113)
NFκB-1 NFκB-2 NFκB-3 NFκB-4
C
wt-NFκB-1 mt-NFκB-1 mt-NFκB-4 mt-NFκB-1/4
NFɄB-1 NFɄB-4 Luc
NFɄB-4
NFɄB-1 Luc
NFɄB-1 NFɄB-4 Luc
pGL4-PLD1
NFɄB-4 Luc
NFɄB-4
pGL4
pGL4-PLD1
mtNFκB-1 mtNFκB-4 mtNFκB-1/4
wtNFκB
0 10 20 30 40
Relative Luciferase Activity
Vehicle PMA
FIGURE 8. Identification of NFB elements responsive for PMA-induced PLD1 expression. A, deletion analysis of pGL4-PLD1 in HCT116 cells. A sche- matic representation of pGL4-PLD1 reporter constructions containing vari- ous lengths is shown. The cells were cotransfected with pGL4-PLD1 and NFB and were then stimulated with 100 nMPMA for 24 h. B, HCT116 cells were
treated with 100 nMof PMA for 6 h. A ChIP assay using the indicated primers and antibodies was performed for identification of NFB-binding sites pres- ent in the PLD1 promoter. A ChIP analysis of c-IAP2 promoters was performed as a control. C, HCT116 cells were transfected with wild-type pGL4-PLD1 or mutant pGL4-PLD1 and were then treated with or without 100 nMPMA for 24 h. The luciferase activity was measured. Results shown are means⫾ S.E. of three independent experiments.
FIGURE 9. PMA-induced PLD1 induction is involved in the secretion of MMP-9 via Ras/ERK/NFB in colon cancer cells. A, HCT116 cells were pre- treated with or without L744832 (10M), U0126 (10M), and PDTC (50M) and treated with 50 nMPMA for 24 h. B, the cells were transfected with siRNA for control or PLD1 and were then treated with or without 50 nMPMA for 24 h.
The conditioned media were collected and subjected to casein zymography.
The expression levels of proteins in the cell lysates were determined by West- ern blotting using the indicated antibodies. Data are representative of three independent experiments.
at KEIMYUNG UNIV MED LIB on January 10, 2016http://www.jbc.org/Downloaded from
break out of their primary site into the circulation and from there to secondary sites. MMP-9 secretion is induced by various agonists that differ among cell lines (36). MMP-9 is secreted in response to PMA. PLD is known to be essential for the induc- tion of MMP-9 secretion by several stimuli, including PMA. We found that inhibition of the proteins (Ras/ERK/NFB) involved in the PMA-stimulated induction of PLD1 suppresses PMA- induced MMP-9 secretion and PLD1 protein level. Reduced expression of PLD1 using siRNA also inhibited PMA-stimu- lated secretion of MMP-9. Furthermore, depletion of PLD decreased cell viability and increased apoptosis, thus suggesting the involvement of PLD in survival and anti-apoptosis.
In conclusion, we demonstrate selective induction of PLD1 in human colon cancer cells and mice by PMA. Taken together, our current study is, to our knowledge, the first to demonstrate that the induction of PLD1 through a PKC/Ras/ERK/NFB pathway is involved in the secretion of MMP-9 associated with invasiveness in colon cancer cells. In addition, our finding iden- tifies PLD1 as a novel downstream target molecule of NFB, which contributes to tumorigenesis. Since PLD has emerged as a critical regulator of cell proliferation and invasion, the selec- tive modulation of PLD expression levels in certain cancers might be useful in sensitizing resistant cancers to the effects of anti-cancer drugs.
REFERENCES
1. Gustin, D. M., and Brenner, D. E. (2002) Cancer Metastasis Rev. 21, 323–348
2. Foster, D. A., and Xu, L. (2003) Mol. Cancer Res. 1, 789 – 800 3. Exton, J. H. (1999) Biochim. Biophys. Acta 1439, 121–133
4. Min, D. S., Kwon, T. K., Park, W. S., Chang, J. S., Park, S. K., Ahn, B. H., Ryoo, Z. Y., Lee, Y. H., Lee, Y. S., Rhie, D. J., Yoon, S. H., Hahn, S. J., Kim, M. S., and Jo, Y. H. (2001) Carcinogenesis 22, 1641–1647
5. Buchanan, F. G., McReynold, M., Couvillon, A., Kam, Y., Holla, V. R., DuBois, R. N., and Exton, J. H. (2005) Proc. Natl. Acad. Sci. U. S. A. 102, 1638 –1642
6. Bos, J. L. (1989) Cancer Res. 49, 4682– 4689
7. Robinson, M. J., and Cobb, M. H. (1997) Curr. Opin. Cell Biol. 9, 180 –186 8. Rodriguez-Viciana, P., Warne, P. H., Khwaja, A., Marte, B. M., Pappin, D., Das, P., Waterfield, M. D., Ridley, A., and Downward, J. (1997) Cell 89, 457– 467
9. Chen, Y., Zheng, Y., and Foster, D. A. (2003) Oncogene 22, 3937–3942 10. Kim, J., Lee, Y., Kwon, T., Chang, J., Chung, K., and Min, D. S. (2006)
Cancer Res. 66, 784 –793
11. Blobe, G. C., Obeid, L. M., and Hannum, Y. A. (1994) Cancer Metastasis Rev. 13,411– 431
12. Meng, X. W., Heldebrant, M. P., and Kaufmann, S. H. (2002) J. Biol. Chem.
277,3776 –3783
13. Herrant, M., Luciano, F., Loubat, A., and Auberger, P. (2002) Oncogene 21, 4957– 4968
14. Moerkerk, P., Arends, J. W., Van-Driel, M., De-Bruine, A., De-Goeij, A., and Ten-Kate, J. (1994) Cancer Res. 54, 3376 –3378
15. Liotta, L. A., Tryggvason, K., Garbisa, S., Gehron-Robey, P., and Abe, S.
(1981) Biochemistry 20, 100 –104
16. Liotta, L. A., Abe, S., Gehron-Robey, P., and Martin, G. R. (1979) Proc.
Natl. Acad. Sci. U. S. A. 76,2268 –2272
17. Ballin, M., Gomez, D. E., Sinha, C. C., and Thorgeirsson, U. P. (1988) Biochem. Biophys. Res. Commun. 154,832– 838
18. Geyer, R. K., Yu, Z. K., and Maki, C. G. (2000) Nat. Cell Biol. 2, 569 –573 19. Pospisilova, S., Brazda, V., Kucharikova, K., Luciani, M. G., Hupp, T. R., Skladal, P., Palecek, E., and Vojtesek, B. (2004) Biochem. J. 378, 939 –947 20. Abbas, T., White, D., Hui, L., Yoshida, K., Foster, D. A., Bargonetti, J.
(2004) J. Biol. Chem. 279, 9970 –9977
21. Astler, V. B., and Coller, F. A. (1954) Ann. Surg. 139, 846 – 851
22. Kononen, J., Bubendorf, L., Kallioniemi, A., Barlund, M., Schraml, P., Leighton, S., Torhorst, J., Mihatsch, M. J., Sauter, G,., and Kallioniemi, O. P. (1998) Nat. Med. 4, 844 – 847
23. Park, W. S., Oh, R. R., Park, J. Y., Lee, J. H., Shin, M. S., Kim, H. S., Lee, H. K., Kim, Y. S., Kim, S. Y., Lee, S. H., Yoo, N. J., and Lee, J. Y. (2000) Gastroen- terology 119,691– 698
24. Ahn, B. H., Kim, S. Y., Kim, E. H., Choi, K. S., Kwon, T. K., Lee, Y. H., Chang, J. S., Kim, M. S., Jo, Y. H., and Min, D. S. (2003) Mol. Cell Biol. 23, 3103–3115
25. Caretti, G., Salsi, V., Vecchi, V., Imbriano, C., and Mantovani, R. (2003) J. Biol. Chem. 278, 30435–30440
26. Vojtek, A. B., and Der, C. J. (1998) J. Biol. Chem. 273, 19925–19928 27. Kurland, J. F., Voehringer, D. W., and Meyn, R. E. (2003) J. Biol. Chem. 278,
32465–32470
*
Control PLD1 PLD2 PLD1/2 0
3 6 9 12
Apoptosis (%)
siRNA
*
Control PLD1 PLD2 PLD1/2 0
25 50 75 100
Cell Viability (%)
siRNA
A
B
FIGURE 10. Depletion of PLD increases apoptosis and reduces cell viabil- ity. HCT116 cells were transfected with control siRNA or siRNA specific for PLD1 or PLD2. A, cell viability was measured by a 3-(4,5-dimethylthiazol-2-yl)- 2,5-diphenyltetrazolium bromide assay, as described under “Experimental Procedures.” *, p⬍ 0.05 versus either small interfering PLD transfection.
B, apoptosis was measured using an Annexin V staining kit. Results shown are means⫾ S.E. of four independent experiments. *, p ⬍ 0.05 versus either siPLD transfection.
at KEIMYUNG UNIV MED LIB on January 10, 2016http://www.jbc.org/Downloaded from
28. Wang, Q., Wang, X., and Evers, B. M. (2003) J. Biol. Chem. 278, 51091–51099
29. Wakelam, M. J., Martin, A., Hodgkin, M. N., Brown, F., Pettitt, T. R., Cross, M. J., De Takats, P. G., and Reynolds, J. L. (1997) Adv. Enzyme Regul. 37, 29 –34
30. Williger, B. T., Ho, W. T., and Exton, J. H. (1999) J. Biol. Chem. 274, 735–738
31. Kato, Y., Lambert, C. A., Colige, A. C., Mineur, P., Noe¨l, A., Frankenne, F., Foidart, J. M., Baba, M., Hata, R., Miyazaki, K., and Tsukuda, M. (2005) J. Biol. Chem. 280,10938 –10944
32. Kikuchi, R., Murakami, M., Sobue, S., Iwasaki, T., Hagiwara, K., Takagi, A., Kojima, T., Asano, H., Suzuki, M., Banno, Y., Nozawa, Y., and Murate, T.
(2007) Oncogene 26, 1802–1810
33. Wang, Q., Wang, X., Zhou, Y., and Evers, B. M. (2006) Int. J. Cancer 118, 326 –334
34. Wang, X., Wang, Q., Hu, W., and Evers, B. M. (2004) Oncogene 23, 1885–1895
35. Thomas, R. P., Farrow, B. J., Kim, S., May, M. J., Hellmich, M. R., and Evers, B. M. (2002) Surgery 132, 127–134
36. Mackay, A. R., Ballin, M., Pelina, M. D., Farina, A. R., Nason, A. M., Hartzler, J. L., and Thorgeirsson, U. P. (1992) Invasion Metastasis 12, 168 –184
37. Okada, Y., Gonoji, Y., Naka, K., Tomita, K., Nakanishi, I., Iwata, K., Ya- mashita, K., and Hayakawa, T. (1992) J. Biol. Chem. 267, 21712–21719
at KEIMYUNG UNIV MED LIB on January 10, 2016http://www.jbc.org/Downloaded from
Supplementary Methods
Rapid amplication of 5′ complementary DNA ends
The transcription start sites of the hPLD1 were mapped by using the CapFishing
TMFull- length cDNA Premix Kit (Seegene, Korea) according to the manufacturer's instructions.
This technique involved the incorporation of a “CapFishing™ adaptor” onto the 5′ end of the reverse-transcribed cDNA for the 5′ RACE analysis. The 5′ end of hPLD1 was then amplified by using a standard PCR protocol. Primers were designed so that a relatively large section of the coding region (120 ~ 280 bp) was amplified during the nested PCR, along with the 5′ UTR. Reaction products were analyzed by 1.5% agarose gel electrophoresis, purified using the QIAquick gel extraction kit (Qiagen, Valencia, CA). A purified 5′ RACE fragment was cloned into the pGEM-T Easy vector (Promega) and sequenced.
Cloning of promoter regions of exon 2 from hPLD1 and site-directed mutagenesis A 1930-bp promoter region of hPLD1 transcribed from exon 2 was amplified by PCR using primers based on the genomic DNA sequence of the hPLD1 gene. The PCR product was purified using gel extaction Kit (Qiagen) and subcloned into the KpnI/BglII site in pGL4-14b-basic reporter vector with luc reporter gene (Promega, Madison, WI, USA). The PCR-based method was used to clone serially deleted PLD1 promoter constructs into the pGL4-14b reporter vector at the KpnI and BglII site. The primers were used as follow :
-1530 5′- GGGTACCCACCAGCGAGGTGCATTCTAAAC -3′, -1230 5′- GGGTACCCGAGACTCATTGAGTTATAATAAGGGC -3′,
-930 5′- GGGTACCGATTTGCAGTAAGAAAGGAACATGTGGC -3′, -630 5′- GGGTACCGTCTTTCGGAATAGGTATATTAATCAATTT -3′, -333 5′- GGGTACCGCTTTCCCAAACCAATCTCCCTTG -3′
The same antisense oligonucleotide primer that corresponded to +1 (5′-
GAAGATCTTAGGAAAGAAGAAAACGGTTACAAAGACTTAG -3′) was used for
the generation of the clones. All PCR products were sequenced in both directions by
TTT TTC AAT TTA GAA ACA CAG TCT CTT TCT C -3′ and reverse primer, 5′- GAG AAA GAG ACT GTG TTT CTA AAT TGA AAA ATG GGA GCG AAG G -3′;
for mtNFκB4 forward primers, 5′- GTC TGG ATT CAA ATT GTG CAA TAG AGT TTT ATG TTA TCA AAA TGC -3′ and reverse primer, 5′- GCA TTT TGA TAA CAT AAA ACT CTA TTG CAC AAT TTG AAT CCA GAC -3′ binding sites on PLD1 promoter by Quick Change Site-Directed Mutagenesis Kit (Stratagene, LaJolla, CA) according to the manufacturer’s instructions.
Cloning of the hPLD2 promoter region
A 2,671-bp of hPLD2 promoter region was amplified by PCR using primers based on the genomic DNA sequence of the hPLD2 gene. The PCR product was purified gel extaction Kit (Qiagen) and subcloned into the Kpn I/Bgl II site in pGL4-14b reporter vector with luc reporter gene (Promega, Madison, WI, USA) and then sequenced in both directions by using primers designed from a known sequence.
RT-PCR analysis.
PCR reactions were cycled as follows: initial denaturation at 95°C for 2 min and then 30 cycles for PLD1, PLD2 and GAPDH at 95°C for 40 sec, 58°C for 40 sec, and 72°C for 40 sec. Forward primer of GAPDH was 5´- GTG GTC TCC TCT GAC TTC AAC -3´, and the reverse primer was 5´- TCT CTT CCT CTT GTG CTC TTG -3´ with 197 bp amplified fragments. The forward primer of PLD1 gene was 5´- TGT CGT GAT ACC ACT TCT GCC A -3´, and the reverse primer was 5´- AGC ATT TCG AGC TGC TGT TGA A -3´ with 531 bp amplified fragments. The forward primer of PLD2 gene was 5´- CAT CCA GGC CAT TCT GCA C -3´, and the reverse primer was 5´- GTG CTT CCG CAG ACT CAA GG -3´ with 412 bp amplified fragments.
Detailed Chip assay
HCT116 cells treated with or without PMA were used for the crosslinking with 1%
paraformaldehyde in phosphate-buffered saline for 10 min. The cells were scraped and
collected by centrifugation. Cells were lysed in lysis buffer, and normal rabbit IgG or
anti-NFκB (p65) antibody was added and incubated for 8 h at 4
oC. The
immnunocomplexes were extracted 3 times with 1% SDS, 0.1M NaHCO
3, and
crosslinking was reversed by incubating at 65
oC overenight. The saved chromatin input
DNA was purified by ethanol precipitation, and resuspended in 20 µl of nuclease-free water. As a positive control, the c-IAP2 promoter region was amplified by PCR using primers 5´-GCA ATG ATC GTC CTC TCT ATA TGG-3´ (forward) and 5´-GTC TCA CGC TGT CTT TTA AAT GC-3´ (reverse). The PLD1 promoter regions were amplified by PCR using primers; for NFκB1 (-1640 ~ -1251 bp), 5´- CCT TAT CTA TAA AGA GGG GAT GGC- 3´ (forward), 5´- GTC GGG AGA AAG AGA CTG TGT TTG G -3´
(reverse), for NFκB2 (-1321 ~ -1071 bp), 5´- ATG TCT GGC CAA ACC AGA ACC - 3´
(forward), 5´- CAA GGT CTT AGG CTT CTT GAG AAT G -3´ (reverse), for NFκB3 (- 1024 ~ -510 bp), 5´- GCA CCC ATA TCA GGT GCT CCT TAA TC -3´ (forward), 5´- CTC TGT AGG TGA TAT CCC AAG C -3´ (reverse), for NFκB4 (-210 ~ -113 bp), 5´- CAC ACA GAG CAG GCT GAA TTG -3´ (forward), 5´- GCT CAG ATC ATC CGT CTT TAC C -3´ (reverse). Amplification was carried out for 38 cycles, which was determined to be within the linear range. PCR products were analyzed by 2 % agarose gel electrophoresis with ethidium bromide staining.
Figure legends
S1. Diagrammatic representation of hPLD1 and hPLD2 promoter constructs. A, Two alternate transcripts of hPLD1 are transcribed from exon 1 and exon 2, respectively.
hPLD2 is transcribed from exon 1. B, Transcription start site transcribed from exon 2 and exon 1 was represented as +1 (transcript 2) and -55 (transcript 1), respectively.
Total RNA isolated from HCT116 cells was subjected to a 5´ RACE reaction using 5´
adaptor primer mix and 3´ PLD1-specific antisense primer. Following amplification, the
5´ RACE products were visualized as two alternate transcripts on 1.5% agarose gels
stained with ethidium bromide.
PLD1 Promoter Promoter
PLD1-1 mRNA Exon1 Exon2
ATG
5´ 3´
Exon2 ATG
Exon3
5´ 3´
PLD1-2 mRNA
PLD2 Promoter
PLD2 mRNA Exon1 Exon2
ATG
5´ 3´
B
M ar ke r 5 ´ R
A C E P L D 1
Transcript 1 Transcript 2 500
400 300 200 bp
ATG
Exon1 Exon2
+1
Exon3
Intron1 Intron2
+215
-55 +32
Won-Sang Park and Do Sik Min
Lee, Hyung Sik Kim, Taeg Kyu Kwon, Dong Woo Kang, Mi Hee Park, Young Jun
Cancer Cells
Metalloproteinase-9 Secretion in Colon Pathway and Enhances Matrix
B-dependent κ
through a PKC/Ras/ERK/NF
D1 but Not Phospholipase D2 Expression
doi: 10.1074/jbc.M707416200 originally published online December 15, 2007 2008, 283:4094-4104.
J. Biol. Chem.
10.1074/jbc.M707416200 Access the most updated version of this article at doi:
. JBC Affinity Sites Find articles, minireviews, Reflections and Classics on similar topics on the
Alerts:
When a correction for this article is posted
•
When this article is cited
•
to choose from all of JBC's e-mail alerts Click here
Supplemental material:
http://www.jbc.org/content/suppl/2007/12/28/M707416200.DC1.html
http://www.jbc.org/content/283/7/4094.full.html#ref-list-1
This article cites 37 references, 17 of which can be accessed free at
at KEIMYUNG UNIV MED LIB on January 10, 2016http://www.jbc.org/Downloaded from