Received: October 19, 2020 Revised: December 2, 2020 Accepted: December 16, 2020 Trauma and InJury
Correspondence to Byung Chul Kim, M.D.
Department of Neurosurgery, Pusan National University Hospital, 179 Gudeok- ro, Seo-gu, Busan 49241, Korea Tel: +82-51-240-7257 Fax: +82-51-244-0282 E-mail: [email protected]
* HJC and JHJ contributed equally as first authors.
Correlations of Weather and Time Variables with Visits of Trauma
Patients at a regional Trauma Center in Korea
Hyuk Jin Choi, M.D.
1*, Jae Hoon Jang, M.D.
2*, Il Jae Wang, M.D.
3, Mahnjeong Ha, M.D.
1, Seunghan Yu, M.D.
1, Jung Hwan Lee, M.D.
1, Byung Chul Kim, M.D.
11Department of Neurosurgery, School of Medicine, Pusan National University, Busan, Korea
2Department of Orthopedic Surgery, School of Medicine, Pusan National University, Busan, Korea
3Department of Emergency Medicine, School of Medicine, Pusan National University, Busan, Korea
Purpose: Trauma incidence and hospitalizations of trauma patients are generally be-
lieved to be affected by season and weather. The objective of this study was to explore possible associations of the hospitalization rate of trauma patients with weather and time variables at a single regional trauma center in South Korea.
methods: Trauma hospitalization data were obtained from a regional trauma center in
South Korea from January 1, 2017 to December 31, 2019. In total, from 6,788 patients with trauma, data of 3,667 patients were analyzed, excluding those from outside the city where the trauma center was located. Hourly weather service data were obtained from the Korea Meteorological Administration.
results: The hospitalization rate showed positive correlations with temperature
(r=0.635) and wind speed (r=0.501), but a negative correlation with humidity (r=-0.620).
It showed no significant correlation (r=0.036) with precipitation. The hospitalization rate also showed significant correlations with time of day (p=0.033) and month (p=0.22).
Conclusions: Weather and time affected the number of hospitalizations at a trauma
center. The findings of this study could be used to determine care delivery, staffing, and resource allocation plans at trauma centers and emergency departments.
Keywords: Weather; Time; Temperature; Wounds and injuries; Patient admission
INTRODUCTION
There is a widespread belief among medical professionals at trauma centers that fewer trauma patients are hospi- talized on rainy days. In addition, the volume of trauma patients varies depending on time and other circum- stances. Higher temperatures, precipitation, evenings, and weekends are associated with an increased volume of trauma patients presenting to the emergency department.
The effects of time variables (such as season, month, day, and hour) and weather variables on the volume of trauma patients have been analyzed in several previous papers.
Bhattacharyya and Millham [1] argued for a strong cor- relation between trauma patient volume and daily high temperatures. Conversely, increased precipitation de- creased trauma hospitalizations by 10%. Atherton et al. [2]
reported that the admission of trauma cases was related to weather and time factors, especially for pediatric trauma cases. There is substantial annual variation from month to month, and even daily and weekly. Abbasi et al. [3] ana- lyzed patterns of trauma patients at a major trauma center in Shiraz, in southern Iran, and found that most trauma injuries were reported during in summer and hot weath- er. Thus, we hypothesized that the volume of incoming trauma patients at a regional trauma center could be pre- dicted by weather and time variables. This information can be used to facilitate the treatment and management of trauma patients. This study aimed to help treat trauma patients and manage trauma centers by exploring the as- sociation of patients’ rate of hospitalization with seasonal
Patients who visited the Regional Trauma Center from 2017 to 2019 (n=6,788)
Patients who sustained trauma within the administrative district (n=3,695)
Final inclusion patients (n=3,667)
Exclusion
• Trauma occurred outside of the administrative district
Exclusion
• Unclear trauma or unspecified injury
• Insufficient information
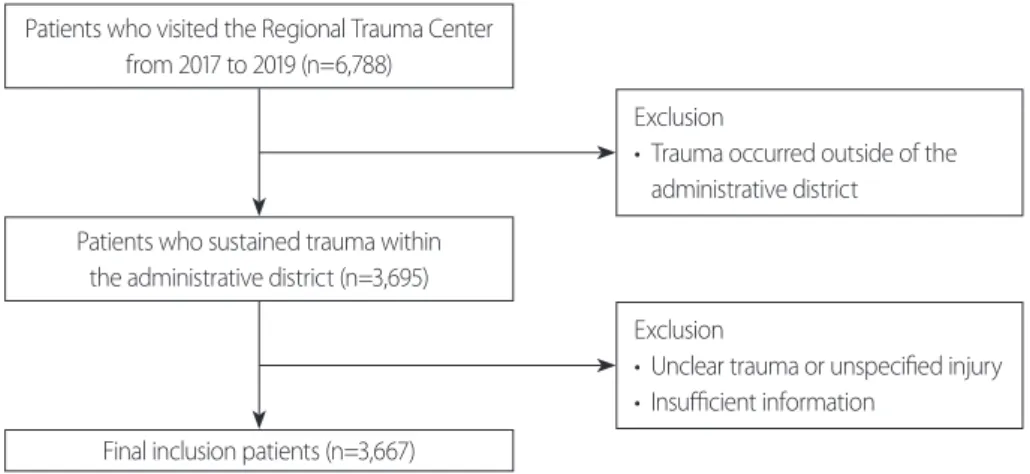
Fig. 1. Study design and sampling.
Table 1. Demographic and injury-related characteristics of
the trauma patients
Total (n=3,667)
Age 54.42±21.09
Sex
Male 2,419 (66.0)
Female 1,248 (34.0)
Mechanism of injury
Fall 1,695 (46.2)
High energy fall 993 (25.5)
Trivial fall 762 (20.7)
Traffic accident 1,287 (35.1)
Pedestrian 545 (14.9)
Motorcycle 387 (10.6)
Car 271 (7.4)
Bicycle 84 (2.3)
Others 685 (18.7)
Primary department
Neurosurgery 1,106 (30.2)
Trauma surgery 951 (25.9)
Orthopedic surgery 950 (25.9)
Emergency medicine 445 (12.1)
Plastic surgery 66 (1.8)
Others 149 (4.1)
ISS
>16 2,255 (61.5)
≤16 1,412 (38.5)
Values are presented as mean±standard deviation or number (%).
ISS: injury severity score.
variables and temperature.
METHODS
Records from 6,788 patients who were treated at a re- gional trauma center of Pusan National University Hospital from 2017 to 2019 were reviewed. Data from
3,667 patients were collected after excluding those who sustained injuries outside the administrative district of the city where the trauma center was located, patients with unclear trauma history or an unspecified inju- ry, and patients with insufficient information (Fig. 1).
Data included age, sex, accident time, accident mecha- nism, anatomic location of injury, and severity index of trauma. Data for weather variables were obtained from
Number of patients Number of patientsNumber of patients
Number of patients
40
30
20
10
40
30
20
10
40
30
20
10
0 40
30
20
10
14 16 18 Temperature
55 60 65 70
Humidity
0.0 0.3 0.6 0.9
Precipitation
2.5 3.0 3.5 4.0
Wind speed
A B
D C
Fig. 2. (A-D) Scatter plot of the number of trauma patients according to weather variables.
the Korea Meteorological Administration. The weather station that collects weather variables was located 1.2 km away from the trauma center and weather variables were measured every hour. The weather data contained in- formation such as temperature, precipitation, humidity, snowfall, wind speed, and icy road conditions. Group- by-group comparisons of continuous variables were per- formed using the independent t-test or Wilcoxon rank- sum test. Correlations between weather variables and the number of patients were determined by univariate anal- ysis. Spearman correlation coefficients were calculated to determine the linear relationships between weather vari- ables and patient volume. For the analysis of daily data, we analyzed mean temperature values, which are closely correlated with the highest, lowest, and average tempera- tures, using raw data established at intervals of 1 hour. In the scatter plot, the R value denotes the Spearman rank correlation coefficient, and the trend line was checked for linearity using the loess method (local polynomial regres- sion).
RESULTS
Of 3,667 patients who presented to the trauma center
Table 2. Correlations between individual weather variablesand trauma patients
Weather variable Spearman r p-value Absolute correlation value Temperature (average) 0.635 0.000a 0.635 Humidity (average) -0.620 0.000a 0.620
Freezing days -0.555 0.000a 0.555
Wind speed (average) 0.501 0.000a 0.501 Precipitation (average) 0.036 0.646 0.036
Snowfall (average) 0.008 0.915 0.008
Heavy rain days -0.027 0.727 0.027
ap<0.05.
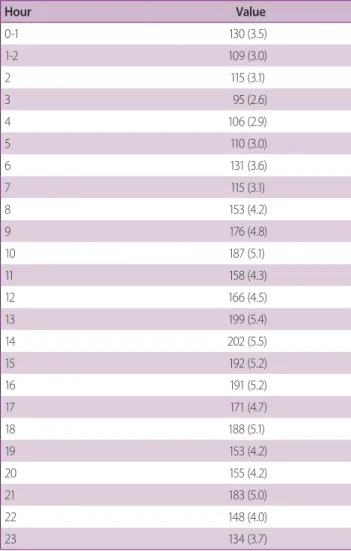
Table 3. Number of trauma patients according to time vari-
ables; hourly data (time of day)
Hour Value
0-1 130 (3.5)
1-2 109 (3.0)
2 115 (3.1)
3 95 (2.6)
4 106 (2.9)
5 110 (3.0)
6 131 (3.6)
7 115 (3.1)
8 153 (4.2)
9 176 (4.8)
10 187 (5.1)
11 158 (4.3)
12 166 (4.5)
13 199 (5.4)
14 202 (5.5)
15 192 (5.2)
16 191 (5.2)
17 171 (4.7)
18 188 (5.1)
19 153 (4.2)
20 155 (4.2)
21 183 (5.0)
22 148 (4.0)
23 134 (3.7)
Values are presented as number (%).
Table 4. Number of trauma patients according to time vari-
ables; monthly data
Month Value
January 295 (8.0)
February 262 (7.1)
March 317 (8.6)
April 302 (8.2)
May 341 (9.3)
June 279 (7.6)
July 328 (8.9)
August 321 (8.8)
September 312 (8.5)
October 302 (8.2)
November 294 (8.0)
December 314 (8.6)
Values are presented as number (%).
from January 1, 2017 to December 31, 2019, 2,419 (66.0%) were men and 1,248 (34.0%) were women. Their average age was 54.4 years. The most common cause of trauma was falls, in 1,695 cases (46.2%), followed by traffic ac- cidents in 1,287 patients (35.1%) (Table 1). Due to the nature of a regional trauma center, most patients experi- enced multiple traumas. According to the anatomical site, the most common category was neurosurgical injuries (1,106 cases, 30.2%), followed by thoracic and abdom- inal injuries (951 cases, 25.9%) and orthopedic injuries (950 cases, 25.9%). Major trauma with an injury severity score of ≥16 was observed in 1,412 patients (38.5%). The volume of trauma patients showed a positive correlation with temperature (r=0.635) and wind speed (r=0.501), but a negative correlation with humidity (r=-0.620) (Fig. 2). However, it did not show any statistically sig- nificant correlations with other variables such as pre- cipitation, snowfall, or icy road conditions (Table 2).
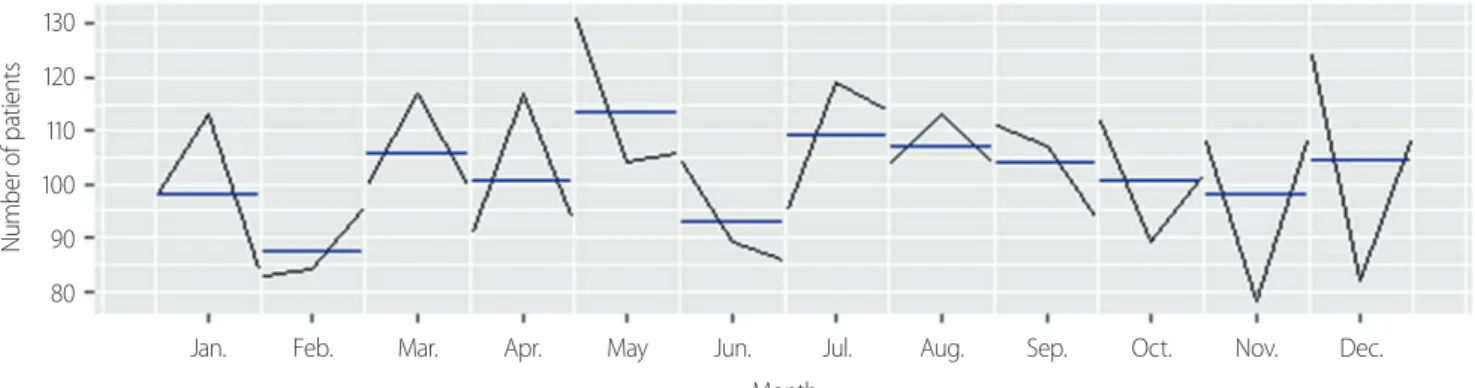
The correlation between time of day and the number of hospitalizations was significant (p=0.033). The number of patients peaked during 1–3 PM (over 5.4%). Patient volume also showed significant (p=0.22) correlations with monthly variables, especially in May, July, and August (over 8.8%) (Tables 3, 4). However, it showed no signif- icant correlation with days of the week or seasonal vari- ables (Figs. 3, 4).
DISCUSSION
In this study, we confirmed the correlation between the hospitalization rate of trauma patients and certain weather and time variables. Traumatic events occur more frequently at certain times and months [1,4-10]. The inci- dence of traumatic events was found to vary significantly with the time of day. It was 2.1-fold higher between 2:00
Number of patients
130 120 110 100 90 80
Jan. Feb. Mar. Apr. May Jun. Jul. Aug. Sep. Oct. Nov. Dec.
Month
Fig. 3. The monthly time plot of trauma patients. A subseries plot was created using ggplot. Each season is plotted as a separate mini time series. The blue lines represent the mean of the observations within each season.
Number of patients
40
30
20
10
Sunday Monday Tuesday Wednesday Thursday Firday Saturday
Fig. 4. Time series of weekly trauma patients.
and 3:00 PM than that at 3:00 AM and 4:00 AM. The number of trauma cases was 1.3-fold higher in May than in February. However, February has fewer days than oth- er months. Weather is also an important factor, as higher temperature and wind speed and lower humidity were associated with a higher incidence of trauma. Extreme temperatures and humidity decreased the incidence of trauma.
Bhattacharyya and Millham [1] analyzed weather and trauma data in Boston from September 1992 to August 1998 and found a strong correlation between hospitaliza- tions and maximum daily temperatures among trauma patients. High precipitation (over an inch) was related to a 10% reduction in the number of trauma admissions. Hu- midity and snowfall did not affect the trauma admission rate. Saturday (24%) and Sunday (8%) were associated with significantly higher numbers of trauma admissions.
Significantly higher patient volume was also found in July (28%) and August (17%).
Rising et al. [4] conducted a retrospective study of the relationship between weather and the number of pa- tients presenting to a level 1 trauma center in Louisville, KY from 1996 to 2002 and reported that high tempera- tures and precipitation were important factors affecting the hospitalization of patients with injuries. That study showed that daily high temperature and precipitation were valid predictors of trauma admission volume, with a 5.25% increase in hourly incidents for each 10°F differ- ence in temperature and a 60% to 78% increase in the in- cidence rate for each inch of precipitation in the previous 3 hours.
Ho et al. [11] analyzed the relationship between weath- er and trauma patient hospitalization at a level 1 trauma center in Queens, NY from January 2000 to December 2009 and found that temperature was significantly related to trauma hospitalization; in particular, a strong asso- ciation was found with penetrating trauma, reflecting a statistically significant correlation between climate and crime. Livingston et al. [9] analyzed the relationship be- tween pediatric orthopedic trauma and weather variables from July 2009 to March 2012. They reported that the number of trauma hospitalizations increased by 1% for each degree of temperature increase and decreased by 21% per inch of precipitation. Mogaka et al. [12] inves-
tigated the relationship between precipitation and traffic accidents and found that rainy weather (odds ratio [OR]
2.9; 95% CI 1.3–6.5) and night-time crashes (OR 2.0; 95%
CI, 1.1–3.9) were independent factors associated with se- rious injuries in traffic accidents.
It was challenging to study the correlation between snowfall and trauma hospitalization. Due to the geo- graphic location of a regional trauma center of Pusan Na- tional University Hospital, we cannot record meaningful snowfall throughout the year. Lee et al. [6] analyzed the correlation between traffic accidents and weather in Seoul between May 2007 and December 2011 based on Korea Road Traffic Authority information. The risk of road traffic injury during snowfall increased when the tem- perature was below 0°C. Road traffic injuries increased by 6.6% at temperatures above 0°C with snowfall, and by 15% at temperatures below 0°C. Due to heavy rain, mod- erate temperatures are related to increased injuries. The frequency of road traffic accidents increased by 12% at temperatures of 0–20°C, whereas they increased by 8.5%
and 6.8% at temperatures below 0°C and above 20°C, re- spectively.
Our investigation showed that wind speed was pos- itively correlated with trauma. In 1990, Cugnoni and Whitworth [13] reported that trauma increased when wind speed increased, especially when the speed was 60 knots or higher. High temperature, low humidity, and high wind speed are generally regarded as components of pleasant weather. In such weather conditions, people gen- erally increase their activities. Ranandeh Kalankesh et al.
[14] analyzed relationships of trauma-related death with temperature and humidity. Their study analyzed the role of leisure activities such as traveling in correlation with high temperatures and warm seasons.
Time variables (seasonal, monthly, daily, and hourly data) can also affect patient volume at hospitals. Holle- man et al. [5] analyzed the role of calendar and weather variables from 1991 to 1994 in the volume of patients at the University of Kentucky Medical Center. Adding weather variables changed the effect of season. Compared to winter days, summer days had 6.1 fewer patients on average, while December days had 3.0 fewer patients.
Calendar variables and weather variables forecasted clinic
volume, explaining 84% of daily variance and 44% of
weekday variance.
Rotstein et al. [15] conducted a retrospective study of patients presenting to the Chaim Sheba Medical Center emergency room in Tel Hashomer, Israel from 1992 to 1994. That study showed that the fewest visits occurred between December and March, while the highest number of visits occurred from April to September. The authors found the highest number of patients on Sundays (a regu- lar workday in Israel), while the lowest number of patients was found on Saturdays. Temperature, rainfall, and hu- midity were significantly correlated with emergency visits.
Koren et al. [16] studied correlations between proximal hip fractures and time variables in 2,050 patients aged 65 years and older and found that the elderly experienced a higher incidence of proximal hip fractures during winter and a lower incidence on weekends. Lankarani et al. [17]
studied traffic accidents and time variables and reported that traffic accidents were more frequent during sunset and sunrise than during the day or night.
Our study found that trauma incidence significantly in- creased at 1–3 PM and in May, July, and August. It should also be noted that July and August are common vacation and travel months in Korea, and Busan is a popular travel destination. This supports the hypothesis that the weather variables mentioned above, especially pleasant weather, may have affected people’s activity, rather than a certain season of the year independently increasing trauma inci- dence.
As of 2015, 7,307 patients died from trauma in Korea, of whom 6,708 died after being admitted to the hospi- tal, while 599 died in the emergency department [18]. A proper analysis of these patients is important for improv- ing patient survival since the personnel and resources available at the emergency department of trauma centers are generally limited. Additionally, the death rate of mass casualty incidents is 6.78 per 100,000 persons in Korea.
Utilizing the limited hospital resources available can help reduce preventable mortality [19].
Unlike previous studies, we analyzed the hospitaliza- tion rate of trauma patients according to both time and weather variables. Accurate weather information and a proper analytical method are needed to utilize data in the management of the trauma care system. Flexible and systemic resource allocation based on patient trend data
analyzed according to weather and time variables should be considered. Establishing a system such as preparing backup medical personnel or compensating existing staff for an increased workload can ultimately help treat trau- ma patients. Furthermore, this study may furnish useful information for trauma prevention initiatives, such as a public awareness campaign.
One limitation of our study is that the data only includ- ed a single trauma center. In 2019, only 48% of trauma patients in Busan were admitted to the regional trauma center. Thus, the cases analyzed in this study do not fully reflect the entire scope of trauma incidence in the region.
Due to the nature of a dedicated trauma center, our insti- tution has a bias towards multiple or severe trauma cases, rather than simple trauma or minor trauma cases.
Furthermore, in Busan, which encompasses an area of 769.82 km
2, there is only one weather station and dataset available for public use. More data from multiple in- dependent sources of measurement and a more robust statistical process are needed to produce more accurate representations of weather conditions.
CONCLUSION
High temperatures, high winds, low humidity, and cer- tain times of day are important and valid predictors of trauma hospitalization. The results of this study can be used to determine the placement and resource utilization of trauma centers. By appropriately deploying personnel and resources, the survival rate of trauma patients can be improved. However, further studies are needed to assess whether these weather and time variables are specific to a particular climate or can be generalized and applied to a variety of geographical locations.
REFERENCES
1. Bhattacharyya T, Millham FH. Relationship between weather and seasonal factors and trauma admission volume at a level I trauma center. J Trauma 2001;51:118-22.
2. Atherton WG, Harper WM, Abrams KR. A year’s trauma ad- missions and the effect of the weather. Injury 2005;36:40-6.
3. Abbasi HR, Mousavi SM, Taheri Akerdi A, Niakan MH, Bo- landparvaz S, Paydar S. Pattern of traumatic injuries and injury severity score in a major trauma center in Shiraz, Southern Iran.
Bull Emerg Trauma 2013;1:81-5.
4. Rising WR, O’Daniel JA, Roberts CS. Correlating weather and trauma admissions at a level I trauma center. J Trauma 2006;60:1096-100.
5. Holleman DR Jr, Bowling RL, Gathy C. Predicting daily visits to a walk-in clinic and emergency department using calendar and weather data. J Gen Intern Med 1996;11:237-9.
6. Lee WK, Lee HA, Hwang SS, Kim H, Lim YH, Hong YC, et al.
Does temperature modify the effects of rain and snow precipi- tation on road traffic injuries? J Epidemiol 2015;25:544-52.
7. Chan EY, Goggins WB, Yue JS, Lee P. Hospital admissions as a function of temperature, other weather phenomena and pol- lution levels in an urban setting in China. Bull World Health Organ 2013;91:576-84.
8. Durkalec A, Furgal C, Skinner MW, Sheldon T. Investigating environmental determinants of injury and trauma in the Cana- dian north. Int J Environ Res Public Health 2014;11:1536-48.
9. Livingston KS, Miller PE, Lierhaus A, Matheney TH, Mahan ST. Does weather matter? The effect of weather patterns and temporal factors on pediatric orthopedic trauma volume. Open Orthop J 2016;10:550-8.
10. Bonafede M, Marinaccio A, Asta F, Schifano P, Michelozzi P, Vecchi S. The association between extreme weather conditions and work-related injuries and diseases. A systematic review of epidemiological studies. Ann Ist Super Sanita 2016;52:357-67.
11. Ho VP, Towe CW, Chan J, Barie PS. How’s the weather? Rela- tionship between weather and trauma admissions at a level I trauma center. World J Surg 2015;39:934-9.
12. Mogaka EO, Ng’ang’a Z, Oundo J, Omolo J, Luman E. Factors associated with severity of road traffic injuries, Thika, Kenya.
Pan Afr Med J 2011;8:20.
13. Cugnoni HL, Whitworth I. Injuries related to wind speed. Ann R Coll Surg Engl 1992;74:294-6.
14. Ranandeh Kalankesh L, Mansouri F, Khanjani N. Association of temperature and humidity with trauma deaths. Trauma Mon 2015;20:e23403.
15. Rotstein Z, Wilf-Miron R, Lavi B, Shahar A, Gabbay U, Noy S.
The dynamics of patient visits to a public hospital ED: a statisti- cal model. Am J Emerg Med 1997;15:596-9.
16. Koren L, Barak A, Norman D, Sachs O, Peled E. Effect of sea- sonality, weather and holidays on the incidence of proximal hip fracture. Isr Med Assoc J 2014;16:299-302.
17. Lankarani KB, Heydari ST, Aghabeigi MR, Moafian G, Ho- seinzadeh A, Vossoughi M. The impact of environmental factors on traffic accidents in Iran. J Inj Violence Res 2014;6:64-71.
18. Jung K, Kim I, Park SK, Cho H, Park CY, Yun JH, et al. Prevent- able trauma death rate after establishing a national trauma sys- tem in Korea. J Korean Med Sci 2019;34:e65.
19. Kim SJ, Kim CH, Shin SD, Lee SC, Park JO, Sung J. Incidence and mortality rates of disasters and mass casualty incidents in Korea: a population-based cross-sectional study, 2000-2009. J Korean Med Sci 2013;28:658-66.