Print ISSN: 1738-3110 / Online ISSN 2093-7717 http://dx.doi.org/10.15722/jds.17.01.201901.57
Effects of Performance, Imagery and Regulatory Focus on Customer Engagement
Nak-Hwan Choi
*, Quynh Mai Nguyen
**, Zhuoqi Teng
***Received: December 15, 2018. Revised: December 26, 2018. Accepted: January 05, 2019.
Abstract
Purpose - Current study aimed at investigating customer experience types (gain vs. loss avoidance performance experience and hedonic vs. reliability imagery experience) and their influences on satisfaction and positive emotion as antecedents of customer engagement. It also explored moderation role of regulatory focus in the influence of each experience type on satisfaction and positive emotion.
Research design, data, and methodology - 416 Vietnamese local tourists were selected to test hypotheses by structural equation model in AMOS 21.0.
Results - First, customers actually achieving gain or avoiding loss are more satisfied. Second, customers with hedonic and reliability imagery experience feel more positive emotion. Third, both positive emotion and satisfaction have positive influences on customer engagement. Last, regulatory focus moderates the positive effects of either gain or loss avoidance performance experience on satisfaction and also moderates the positive effects of either hedonic or reliability imagery experience on positive emotion.
Conclusions - Focusing on both cognitive satisfaction and affective emotion resulted from experience, this study could advance customer engagement theory. Managerially, brand managers should induce gain performance and hedonic imagery experience (loss avoidance performance and reliability imagery experience) from promotion (prevention)-focused customers to enhance their engagement.
Keywords: Customer Engagement, Performance Experience Satisfaction, Imagery Experience Emotion, Regulatory Focus.
JEL Classifications: C83, L81, M31, P46.
1. Introduction
Customers can be considered as low-cost counterparts of firms which can make greater influence in more effective way than any other marketing tools (Kozinets, De Valck, Wojnicki, & Wilner, 2010). Marketing managers should cultivate more innovative ways of creating long-lasting, mutually-beneficial relationship with their customers to induce their engagement. This topic has captured huge interest recently because when promoted properly, customer engagement(CE) has been found to enhance loyalty, purchases, brand evaluations and consumer recommendations, which result in higher profitability (Van Doorn, Lemon, Mittal, Nass, Pick, Pirner, & Verhoef, 2010; So, King, & Sparks, 2014).
* Corresponding Author, Professor, Department of Business Administration, Chonbuk National University, Jeonju, Korea.
Tel: +82-63-270-2998, E-Mail: cnh@jbnu.ac.kr ** Master, Chonbuk National University, Jeonju, Korea.
E-Mail: mine.hvnh@gmail.com
*** Doctoral Candidate, Chonbuk National University, Jeonju, Korea.
E-Mail: 378391734@qq.com
Past research understood customer engagement as his or her activities of adding value toward firm in both direct and indirect ways such as buying, referrals, generating contents and giving feedbacks (Pansari & Kumar, 2017). The engaged customers are likely to be those who experienced more satisfaction and positive emotional connection (Kitayama, Markus, & Kurokawa, 2000). From a rational perspective, Brodie, Ilic, Juric, and Hollebeek (2013) argued customer engagement was driven by highly perceived customer value and satisfaction which resulted from actual customer experience matching or exceeding his/her expectations (Johnson & Fornell, 1991). Following an affective approach, Kim and Morris (2007) presented greater encouragement of customer engagement coming from positive emotions - the mental states stemmed from appraisals or personal thoughts.
However despite rapid expansion of researches using satisfaction and feelings to estimate customer engagement, few studies have been specifically designed to further clarify the process of showing the engagement effects in view of customer experience.
Customer experience has been considered as set of
interactions between customer and firms, which provoke a reaction (Gentile, Spiller, & Noci, 2007). Prior experience can affect current satisfaction through expectation formation and performance (Lervik-Olsen, van Oest, & Verhoef, 2015).
Essentially, performance experience signifies the concept of
"outcome" which can be divided into gain performance experience and loss avoidance performance experience. On the other hand, imagery experience at the interaction with sensory information representations, can be observed through two input-centered components such as hedonic imagery experience and reliability imagery experience. Literature on customer experience has explained how hedonic atmospheric variables (e.g., lighting, scent and music) can remind customers about product-related information and create positive emotions toward that object (Escalas, 2004; Arnold, Reynolds, Ponder, & Lueg, 2005), and also explored how repeated positive imagination can reduce anxiety (Stopa, Brown, & Hirsch, 2012).
Furthermore, regulatory focus theory claims that people regulate their emotions and behavior base on their goal orientations which are divided into two fundamental motivational systems, promotion-focused and prevention- focused (Higgins, 2005; Florack, Keller, & Palcu, 2013). As such, the role of regulatory focus is essentially put into consideration. In particular, if different experience categories reveal different influences, companies should know how to create experience desired by customers to do marketing effectively. They should know the moderation role of regulatory focus in the effects of gain versus loss avoidance performance experience on satisfaction and the role in the effects of hedonic imagery versus reliability imagery experience on emotion.
Regarding the reasons above, the purposes of writing this paper are established as follows. First, impacts of satisfaction and emotions on customer engagement behaviors will be investigated. Second, current research will more deeply identify four types of customer experience, namely gain performance, loss avoidance performance, hedonic imagery and reliability imagery experience. Third, this study will explore the effects of gain and loss avoidance performance experience on the satisfaction and also identify the influences of hedonic imagery and reliability imagery experience on the emotion. Fourth, the moderation roles of regulatory focus in the effects of each of the experiences will be researched. Last, from what is known, this study will highlight major insights and suggest important managerial implications to marketers.
2. Theoretical Background and Hypotheses 2.1. Customer Engagement
The heart of marketing strategies is less on either attraction or retention but more on enhancement of
“engagement”, which has been widely discussed as consumer's activities toward the company (Kumar, Aksoy, Donkers, Venkatesan, Wiesel, & Tillmans, 2010). CE can be considered as “the mechanics of a customer’s value addition toward the firm, either through direct or indirect contributing activities” (Pansari & Kumar, 2017, p.295). Specially, customers who think that they have experienced valuable consumption tend to be more fully satisfied, more willing to pay price premium and want to spread the brand (Mascarenhas, Kesavan, & Bernacchi, 2006). Indeed, engaged consumers reveal higher level of emotional bonding and tend to evaluate positively, deeply trust and more patronize to the firm (Brodie, Ilic, Juric, & Hollebeek. 2013;
So, King, & Sparks, 2014).
Academic analysts prefer accessing CE multi-dimensionally as a concept covering several components including behavioral (i.e., customer investment, energy and time required to interact with a particular brand), cognitive (i.e., customer attention to and interest in a specific brand) and affective (i.e., feelings caused by a particular brand) (Brodie et al., 2013; Cheung, Lee, & Jin, 2011). In a recent study of Dwivedi (2015), it was indicated that engagement not only had a significant effect on loyalty intentions, but also explained variation in loyalty more specifically, compared to traditional antecedents such as value, quality and satisfaction.
Regarding to behavioral perspective, Gummerus, Liljander, Weman, and Pihlstrom (2012) separated customer engagement into community versus transactional engagement behaviors, and measured them through the frequency of brand community visit, commenting, content liking and news reading, frequency of buying. Similarly, Pansari and Kumar (2017) categorized CE into indirect versus direct customer engagement behaviors, which are adopted in current research. Activities such as giving feedbacks/suggestions, generating information and referrals/recommending to other consumers can tell examples of indirect (non-transactional) behaviors while direct purchase is typical example of direct (transactional) behaviors (Romero, 2017; Ranjan & Read, 2016). Major of existing researches have documented that customer’s satisfaction is positively linked to his/her referrals transmission to other potential customers (Fullerton, 2005).
Supported by cutting-edge technologies, customers can influence other people through information sharing (beyond recommendation) on blogs, online forums and social networks. In the same way, people become more active in generating content and information about products for better consumption. Additionally, customers, via complaints or suggestions, can give useful feedbacks that help firms improve the current services or develop newly better ones (Kumar et al., 2010). However, researching about CE within behavioral approach is still in its inception. Thus, it calls for needs to understand some fundamental factors by which CE behaviors can be driven.
2.2. Antecedents of Customer Engagement Behavior
2.2.1. SatisfactionThe expectancy-disconfirmation model (Lewin, 1938) posits that customers cognitively compare expectation with the perceived experience in order to determinate satisfaction.
Here, satisfaction is defined as an outcome of positive disconfirmation of expectation on particular attributes (Johnson & Fornell, 1991). Meanwhile, negative disconfi rmation results from failure of the actual customer experience to meet his/her expectations. In marketing situations, consumers cognitively respond to brand when they recognize, think, evaluate, communicate or associate with images or ideas after being exposed to marketing stimuli. Virtually, understood as a construct of persistence and concentration on dealing with a cognitive activity, cognitive engagement can be observed by time spent and/or effort taken to perform a particular activity in a specific situation. It has been indicated in past studies that the extent to which consumers are satisfied (or dissatisfied) with an offerings directly impacts what they share (Baker, Donthu,
& Kumar, 2016). Moreover, customer satisfaction positively affects business results including the consumers' purchase intention (Mittal & Kamakura, 2001; Kim & Shim, 2017) and willing to pay higher price (Keiningham, Perkins-Munn, Aksoy, & Estrin, 2005). Meanwhile, in current research, we suggest that customer engagement behavior (CEB) includes direct active buying through which customers add value to firm's profitability as well as indirect behaviors of expressing their experiences to and expanding their relationship with the firm (Van Doorn et al., 2010). Customer satisfaction will positively affect both the direct and indirect behaviors.
Formally,
H1a: Customer satisfaction positively affects direct customer engagement behaviors
H1b: Customer satisfaction positively affects indirect customer engagement behaviors
2.2.2. Positive emotion
Bagozzi, Gopinath, and Nyer (1999, p.184) noticed emotions as “mental states of readiness that arise from appraisals of events or one’s own thoughts”. Suitably, emotions can often be expressed not only psychologically but also physically (e.g., in gestures, posture or facial countenance). Distinguished from cognitive response, deeply affective responses (e.g., interest, excitement and stress) can shape strong emotional attitudes and nurture engagement of customers toward a stimulus (Kim & Morris, 2007). Baumgartner, Sujan, and Bettman (1992) suggested that customers emotionally react to a message by generating feelings and images on a general level rather than cautious analysis. Especially when being motivated internally through correspondence with personal goals and
motivational orientation, customer engagement probably stems from appropriate emotions (Wytykowska & Gabińska, 2015).
Despite existing arguments on discrete feelings, the majority of researchers has studied emotion in a dimensional approach that states emotions fluctuate between two dimensions: valence dimension (positive or negative) and intensity dimension (the extent to which the emotion is felt) (Thamm, 2006). Recent study suggests positive emotions motivate people to express their feelings more to public and tend to grade higher average product ratings (Chevalier &
Mayzlin, 2006), compared with negative emotions (Kim &
Gupta, 2012). Undoubtedly, emotions are not just individual states but also are social phenomena as the sharing of emotion does exist between people, and peoples’ emotions affect the emotions of those around them (Johnson, 2008), Consumer emotion is precursor of active behaviors. The more positive a customer feel, the more positively he evaluates and treats the brand (Fedorikhin, Park, &
Thomson, 2008). Formally,
H2a: Positive emotion has positive influence on direct customer engagement behavior
H2b: Positive emotion has positive influence on indirect customer engagement behavior
2.3. Customer Experience
2.3.1. Customer Experience Classified
"Customer Experience(CX) originates from a set of interactions between a customer and a product, a company, or part of its organization, which provoke a reaction"
(Gentile, Spiller, & Noci, 2007, p.397). It might be captured under several distinct points whenever a customer touches any part of the offerings. These touch points, whether face-to-face, nonphysical or in any channel of communication, consist of individual contacts between firm and customer, encompass the total experience journey from the search, purchase, consumption, to the after-sale phases.
Existing studies (Mogenson, 2015; Pauwels, Aksehirli, &
Lackman, 2016) identified four customer experience touch points: (1) brand-owned touch points include all controllable customer interactions deliberately generated from the firm/brand. They are pre-planned exposures that convey firm’s message through visible media channels, such as all form of advertising (e.g., TV ads, radio ads, banners, newspapers etc.), online websites, promotion events, sponsorships and so on; (2) partner-owned touch points referring to jointly invented inter-communications which are under control of both firm and its partners. Distribution agency, marketing partners, suppliers, payment channels and stakeholders can be listed as firm’s partners; (3) customer-owned touch points are a customer actions created solely by customers relaying their perceived experiences and
transferred directly back to the firm. Customer-owned touch points include customer personal thoughts, decision to buy or intention to visit store; (4) social/external/independent touch points pose how other social environment touch points execute. In current research, we concentrate on investigating brand-owned touch points and customer-owned touch points only due to some overlap. For instance, paid media can be considered as either brand-owned or partner-owned, while both customer-owned touch points and social touch points would be more likely to be initiated by customers (Anderl, Schumann, & Kunz, 2016).
Another important factor that worths considering is the manifestation of product’s attributes. Traditional marketing researchers have emphasized on deliberation-based functional product attributes that aim to accomplish the utilitarian, instrumental needs and guide consumers to evaluate functions performed by products (Chernev, 2004).
The product attributes associated with experiential, sensory and/or aesthetic aspects of the offerings are referred as non-verbal hedonic attributes which enable heuristic gratification derived from sensory experience of consuming products (Voss, Spangenberg, & Grohmann, 2003). In addition, reliability attributes imply safety that prevents errors occurrence or distractors harming the effects of other attributes (Stanciu & Hapenciuc, 2009). Building on these tenets, we now develop the theoretical framework for both performance experience and imagery experience in the next part.
2.3.2. Performance Experience and Satisfaction
Lervik-Olsen, van Oest, and Verhoef (2015) highlighted that prior experience can affect current satisfaction through expectation formation and stickiness. To some operators and customers, performance is paramount to experience and should be treated as a priority. Indeed, in view of quality, performance is defined as the extent to which the offering’s primary characteristics operate to satisfy (stated or implied) needs of customers as expected (Golder, Mitra, & Moorman, 2012).
Performance levels of offerings can be judged against the benchmark of expectations and range from low to superior which conform to levels of customer satisfaction because the extent to which performance matches or exceeds expectations determines satisfied/dissatisfied customers. That is, an offering performing well will lead to satisfaction while poor performance can lead to dissatisfaction (Patterson,
1993). The experience that customers get via the performance of service, destination, staff and travel agency is not just transactional, and therefore, cannot be literally given, but strategically created. Conceptually and empirically, this paper divides the performance experiences that customers go though into (1) gain performance experience and (2) loss avoidance performance experience.
Essentially, these two sub-forms of performance experience both signify the concept of "outcome" - consequence caused by an action or a condition - and tie in with functional needs which motivates people to seek for usefulness, financial valuability and physical well-being (Richins, 1994). Performance experience of gain occurs when customers interacted with product, service or even organization and attained actual achievement from what the offerings operated. For example, coming back from a eco-trip, customers have tasted many kinds of local foods, raised more knowledge of biographic facts and geographic information about the sites. In addition, they chase the root of avoiding loss which is not similar to reliability. Literally, reliability is "a measure of the probability that a product will not malfunction or fail within a specified time period" (Kotler, Keller, Brady, Goodman, & Hanser, 2016, p.372). On the other hand, from perspective of customer, loss avoidance is experienced after they factually altered the problematic threats or stayed safe from unfavorable loss thank to performances made by the offerings. Natural beauty of ecosystem, for instance, helped tourists relieve their burden of stressful life; rooms reserved by discount coupons saved customer's budget. Formally,
H3: Gain performance experience has positive influence on customer satisfaction.
H4: Loss avoidance performance experience has positive influence on customer satisfaction.
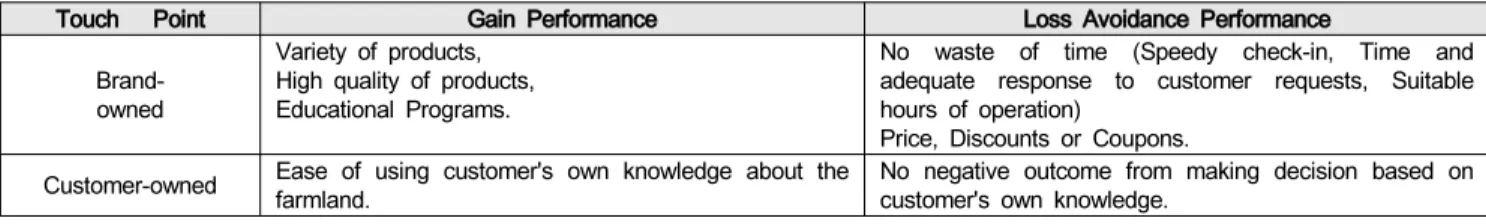
As functional performance works in an attribute-based strategy, consumers can experience them within informative verbal format (e.g., “60 miles per gallon” printed on catalogs of Toyota Prius is its blurb for customer owning limited budget) (Brakus, Schmitt, & Zhang, 2014). Under context of greentea farmland tourism which is set as the survey subject in current research, Table 1 demonstrates gain performance and loss avoidance performance that tourists can experiences during several touch points.
Table 1: Categories of Performance Experiences
Touch Point Gain Performance Loss Avoidance Performance
Brand- owned
Variety of products, High quality of products, Educational Programs.
No waste of time (Speedy check-in, Time and adequate response to customer requests, Suitable hours of operation)
Price, Discounts or Coupons.
Customer-owned Ease of using customer's own knowledge about the
farmland. No negative outcome from making decision based on
customer's own knowledge.
2.3.3. Imagery Experience and Emotion
Imagery is defined as “a process, rather than a structure by which sensory information is represented in working memory” (MacInnis & Price, 1987, p.473) “involving visualization of a concept or relationship” (Lutz & Lutz, 1978, p.611). Socially speaking, we refer representation as the categorization of stimuli by a system of comparative objects like values, ideas, prototype, concepts, metaphors and rarely updated belief (i.e., abstract representation) that are shared within group/community members. Sensory experiences are formed when customers interact with organization through a cluster of sensory input gathered by five basic external senses of visual, gustatory, auditory, olfactory and tactile/haptic senses are more generally known. In the past century, many researches have estimated the hedonics of such sensory stimuli as color wave length, lighting and saturation (sight), taste intensity (taste), tone sequences and noisiness/loudness (hearing), reminiscent odorants (smell) and roughness (touch) (Kang & Zhang, 2010; Essick, McGlone, Dancer, Fabricant, Ragin, Phillips, Jones, & Guest, 2010). In fact, using laboratory simple stimuli has been rare, therefore more studies could explore hedonics of mixtures.
Especially in choosing a trip, people often imagine the feelings of joyfulness they might hope to experience at the destinations. For example, a Russia viewer watching a commercial ad for tropical beach may imagine herself wearing bikini, lying underneath, the beautiful sunlight, enjoying a fresh coconut juice, listening to the wave sound and feeling the breeze rustling her hair. All feelings in these imaginations are also experienced, at least in an indirect way.
Under perspective of needs, imagery links closely to hedonic needs and reliability needs. Hedonic needs reflect inherent desires for sensory pleasure including needs for stimulation, sex, novelty, beauty, reinforcement, enjoyment, entertainment and comfort (e.g., using toothpaste to freshen breath and look better). Reliability needs drive us toward reducing uncertainty or resolve components of financial risk (e.g., luxury pension), physical risk (e.g., eating expired food), social risk (e.g., smokers watching social antismoking ads), psychological risk (e.g., green lover buying disposable cups), and time risk (e.g., long-term mobile contracts) (Tsiros
& Heilman, 2005). In current research, we highlight the effects of two principal states of imagery experience including (1) hedonism and (2) reliability.
Different from performance experience, hedonics and reliability are supposed to be input-centered components under secondary process of sensory information in memory that conveys meanings to consumers and links it with the hedonic and reliability characteristics of the offering, rather than being outcome-centered. Consumers who immerse themselves into the thoughts of consuming a product or experiencing the similar stimuli in an ad are more likely to have positive emotions toward that situation or object
(Escalas, 2004). Interpretive researches (e.g., shopping, gambling, sport events and museums) have explained how hedonic atmospheric variables (e.g., lighting, scent and music) can remind customers about product-related information and affect product judgments (Arnold et al., 2005). Formally,
H5: Hedonic imagery experience has a positive influence on positive emotion.
However, researchers including Vingerhoets, van Huijgevoort, and van Heck (2002) addressed several affective responses to vacations which are not always positive. They noticed that passengers often endure uncomfort during the first few days of a trip such as headaches, muscle pain, fatigue and so on. As a result, repeated positive imagination practice of themselves in social situations would help reduce anxiety and increase perceived product/service reliability (Stopa, Brown, & Hirsch, 2012), which could induce positive emotion. Formally,
H6: Reliability imagery experience has a positive influence on positive emotion.
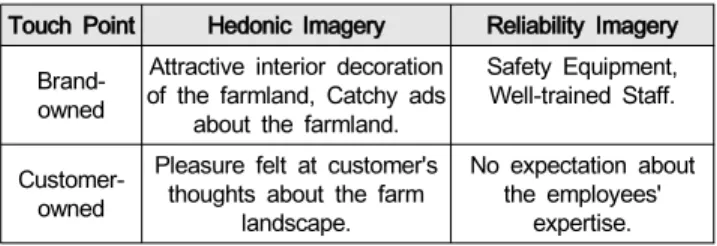
Following Ryu, Han, and Jang’s (2010) findings about hedonic and utilitarian values provided by fast-casual restaurants, Table 2 gives a general view of notable experiences under situation of greentea farmland tourism - the main survey subject.
Table 2: Categories of Imagery Experiences
Touch Point Hedonic Imagery Reliability Imagery Brand-
owned
Attractive interior decoration of the farmland, Catchy ads
about the farmland.
Safety Equipment, Well-trained Staff.
Customer- owned
Pleasure felt at customer's thoughts about the farm
landscape.
No expectation about the employees'
expertise.
2.4. Moderation Role of Regulatory Focus
2.4.1. Regulatory Fit and its MotivesRegulatory focus theory (Higgins, Shah, & Friedman, 1997) observes regulatory fit as a process of two fundamental motivational systems: promotion-focused and prevention-focused, through which people regulate their goals, emotions, and behavior under relevant goals and standards. As promotion-focused individuals pursue gains, promotion orientation emphasizes the pursuit of improvement and accomplishment while prevention orientation reflects the pursuit of security, responsibilities and protection (Idson, Liberman, & Higgins, 2004). Hence, promotion or prevention orientation can shift between tasks or contexts that customers experience regardless of their stable habituation.
In this study, we consider customer experience created by a firm’s/brand’s activities to be involved in changes of customers’ promotion- and prevention-oriented activities.
2.4.2. Regulatory focus as moderator
Regulatory focus posits that those who adopt promotion-oriented strategy pay more attention to gaining achievement and advancement of goal pursuits. In contrast, avoiding loss encourages customer to explore the way to minimize the problematic threats (Falk, Hammerschmidt, &
Schepers, 2010). If his/her goals in taking a trip is to economize, they are likely to consider price of possible vacation destination and prefer reasonably priced accommodations to luxury hotels. Based on this rationale, these preferences are supposed to be able to foretell customer engagement behaviors that higher level of satisfaction can arise when promotion-focused individuals successfully gain what they wanted, while prevention-focused ones safely avoid their possible loss. Formally,
H7: Promotion-focused customers are likely to be more satisfied after gain performance experience
H8: Prevention-focused customers are likely to be more satisfied after performance experience of loss avoidance
The dominant objective of travel experience is to increase the hedonic pleasurement of recreational tourists, based on effectively and efficiently enjoying the trip in an experimental, playful and informative manner (Falk, Hammerschmidt, &
Schepers, 2010). Correspondingly, promotion-focused people might be more prone to positive hedonic feelings such as hope, pleasantness, joy, excitement, and enthusiasm. In
comparison, prevention orientation holding a negative image in mind drives people to higher concentration on safety, reliability, and makes them more cautious and analytical to rectify the sources of risk (Arnold & Reynolds, 2009).
Formally,
H9: Promotion-focused customers are likely to feel more positively after hedonic imagery experience.
H10: Prevention-focused customers are likely to feel more positively after reliability imagery experience.
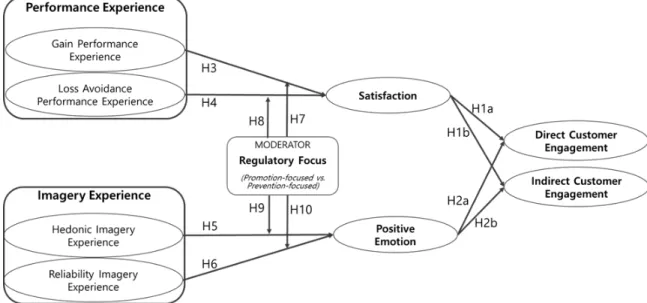
Taken together, the research model can be delineated by Figure 1.
3. Empirical Study
3.1. Selection of study subject
The emergency of well-being concept has been receiving considerable attention, not just from stakeholders but also from consumers. Vietnamese people, specially those who get awareness of enhancing value of mental health, tend to spend large amount of money on travelling. Among attractive destinations in Vietnam, Moc Chau Farmland stands out as the largest greentea farm which has welcomed more than 1.9 millions visitors in 2017 and been heading to about 3 millions of both native and foreign tourists until 2020.
Therefore, we conduct the current research with subjects taken from a set of Moc Chau Greentea Farmland tourists, so that we will be able to figure out solution for real situation to make customers satisfied and intent to come back.
Figure 1: Research Model
3.2. Measures of configuration concepts
3.2.1. Regulatory focus manipulationRegulatory focus can be activated designedly by experimental framing despite its stable characteristics (e.g., desirable enjoyment, harmonized relationship and refreshing time trigger promotion orientation, safe means of transportation and protecting health possibly produce prevention orientation). Thus, to recognize promotion-focused and prevention-focused individuals separately, we developed two priming scenarios as below.
Scenario 1: For the last holiday, my friends and I were going to visit Moc Chau Greeentea Farmland. Before our going, I had seen many photos of this place - a very beautiful destination, especially in spring when flowers bloom. Then, I got to the notion that we could enjoy fresh air while going trekking over green hills. By the way, we could also talk with local people, learn how they collect and make tea. In addition, this town has been famous for high quality greentea, which I wanted to buy as gifts for my parents. I hoped that I and my friends would have great healing time together during our trip to Moc Chau Greentea farmland.
Scenario 2: For the last holiday, my friends and I were going to visit Moc Chau Greeentea Farmland. Before our going, I had seen many information and pictures of this place. It locates in the northwest mountainous area of Vietnam and is about 200km away from Hanoi. Then, I got the notion that I might be a little anxious because it was quite a long distance. In addition, the weather is colder and more humid on mountain than where I live. I might think I need to prepare medicines, warm clothes and book shuttle bus/taxi in advance in order to be safe and not to waste time/money.
Following each scenario, the respondents are exposed to definitions of promotion focus and prevention focus.
Subsequently, they are asked to choose "Which regulatory focus do you think you are concentrating on?" on 7-points scale ([1]=promotion focus, [7]=prevention focus). Then, we used one more question that asks "If you are asked to make a travelling plan next time, you will pay more attention to:", where the participants need to make choices between
"gain positive outcomes" and "avoid negative outcomes" on 7-points scale ([1]=gain positive outcomes, [7]=avoid negative outcomes).
3.2.2. Presence or absence of actual experience
Next, we identify whether participants has experienced any trip at the destination or not by asking "Have you ever been to the Moc Chau Greentea Farmland?". Participants answering "No" are eliminated while those who answer "Yes"
are kept to be processed as study subjects because the current research examines outcomes and imagery inputs derived from the previous experiences,
3.2.3. Measures of experience
This study presented the attributes of the performance experience (includes gain and loss avoidance) and imagery experience (include hedonic and reliability) as shown in Table 1 and Table 2. Based on the attributes, this study measures each separate experience type. The subjects will give evaluation of each item on 7-point scale ranging from [1]=not at all to [7]=very much.
As for the "gain performance experience", this study use the items include the evaluation of ‘There was a variety of greentea,' ‘I bought high quality greentea,' ‘I have learnt the process of producing tea,’ and 'I easily thought of and used the information about the farmland that I have generated in my mind'.
And three items including ‘I did not waste my time enjoying the journey,' ‘The price of the trip was not expensive as I thought,' and 'There was no negative outcome from making decision based on my own knowledge' are used to evaluate the loss avoidance performance experience.
Also, the evaluations of ‘The interior decoration of the farmland was attractive,' 'The ads about the farmland was catchy,' and 'I felt pleasant when I thought about the farm landscape' are used to measure the hedonic imagery experience.
As for the reliability imagery experience, three items including ‘The farmland area was equipped with safety,'
‘When I met problems at the farmland, the well-trained staffs solved it,' and 'I had no worry when I saw the employee's expertise' are used.
3.2.4. Measures of satisfaction
As proposed by Wu and Li (2017), four items on 7-point scale ranging from [1]=not at all and [7]=very much are used to measure the satisfaction. The four items include ‘I really like the trip to the farmland,' ‘It is worthwhile to be at the farmland’, ‘The traveling experience to the farmland satisfied my needs and wants’ and ‘The experience to the farmland is exactly what I needed’.
3.2.5. Measures of positive emotions
Respondents were asked to rate the intensity of their emotions toward the destinations and related services (e.g.,
“I feel a sense of pleasure”) on a 7-point scale ranging from [1]=not at all and [7]=very much. We used items in emotion section of destination emotion scale (Hosany & Gilbert, 2010) which include 'sense of affection,' 'sense of caring,' 'sense of love,' and 'sense of surprise'.
3.2.6. Measures of customer engagement behaviors CEB are measured by the items coming from previous research (Romero, 2017), and we adapted them to the context of tourism experiences. These items include the
Construct Item 1 2 3 4Component5 6 7 8 Communality α
Indirect customer engagement behavior
IG5 .839 .103 .145 .029 .104 .122 .025 .057 .765
.924
IG6 .823 .188 -.013 .041 .035 .116 .139 .119 .763
IG3 .816 .077 .168 .183 .148 .008 -.004 .140 .774
IG4 .793 .173 .258 .066 .053 .068 .127 .017 .754
IG2 .727 .065 .206 .212 .102 .191 -.020 .186 .703
IG7 .722 .265 .061 .177 .167 .185 .126 -.124 .720
IG1.641-.005 .268 .304 -.007 .237 -.009 .272 .705
Satisfaction
SA4 .193 .716 .198 .174 .187 .042 .148 .142 .699
SA3 .136 .682 .129 .209 .225 .278 .099 .156 .705 .856
SA2 .243 .617 .262 .236 .217 .202 .167 .174 .710
SA1 .229 .577 .281 .136 .152 .317 .049 .306 .703
Gain performance experience
GE1 .132 .092 .774 .150 .111 .227 .019 .146 .734
GE3 .280 .238 .663 .188 .198 .100 .183 .152 .715 .824
GE4 .364 .335 .565 .055 .243 .038 .086 .069 .640
GE2 .328 .344 .559 .119 .172 -.016 .190 .163 .645
dimensions of direct purchase, referrals, content generation and suggestions. Three items on 7-point scale are used to measure the direct purchase include ‘I will opt for an identical trip next time,’ ‘I won’t select another destination,' and 'I will choose the farmland as my first choice for tourism'. Three items on 7-point scale are used to measure referrals include ‘I participate in the draws the farmland organizes on social networks,’ ‘I participate in the contests that the farmland organizes on social networks,’ and ‘I would participate in a ‘'bring a friend’' programme organized by the farmland’. Items of ‘I assess and share with other users my opinions and experiences about the products and services of the farmland on the company website,’ ‘I write comments to the blog and/or in the profile of the farmland in social networks (e.g. Facebook, Twitter, etc.),’ ‘I write comments to the forums on the farmland’ are used to measure the content generation. The item on 7-point scale used to measure the suggestions/feedbacks is ‘I let the farmland know of ways that they can better serve my needs'.
3.3. Pre-test and data collection
Applying the measurements for each construct mentioned above, we builded questionnaires in English and translated it into Vietnamese. We recruited 40 Vietnamese for the pre-test to correct the questionnaires and then granted them to mass survey. We collected 431 questionnaires from participants who are currently residing in Vietnam. 15 of them were removed because the respondents said that they had no experience of visiting Moc Chau Greentea Farmland.
So, we used 416 questionnaires to make empirical investigation.
The demographic information of participants was as follows. There are less male participants (N=185, 44.5%) than female. Most of participants was at 31-40 years old, which take 39.2% while only 1.9% (N=8) are under the age
of 20, 35.1% (N=146) are 20-30 years old, 19.5% (N=81) are 41-50 years old, and 4.3% (N=18) are over the age of 50. As for household income counted in VND, 7%(N=29) participants reported their household income was under 15 million. For a month; 30.3% (N=126) was between 15 and under 25 million; 40.1%(N=167) of respondents' household income was from 25 to under 35 million which was nearly double the number of those whose households get from 35 to 45 million every month (19.2%, N=80). Last, 3.4%(N=14) was over 45 million. The results pointed out that 100% of recruited participants was from Vietnam (N=416).
3.4. Reliability and Validity
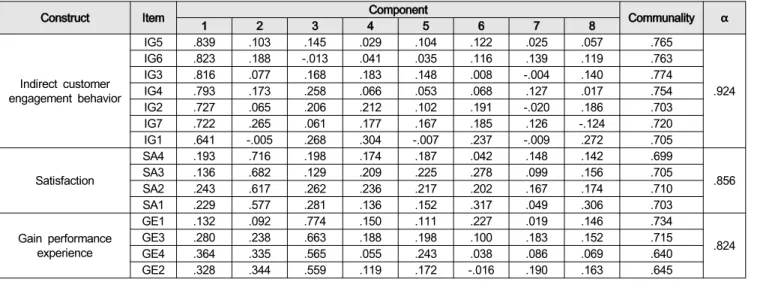
Calculating Cronbach's α can check the internal consistency among items and ensure construct reliability of each measurement construct. Also, confirmation principal component factor analysis based on Varimax rotation in SPSS 22.0 program was used to investigate convergent validity. After the first test, invalid items are found in Hedonic Imagery Experience ('I felt pleasant when I thought about the farm landscape'), Reliability Imagery Experience ('I had no worry when I saw the farmland employee's expertise'), Loss Avoidance Performance Experience ('There was no negative outcome from making decision based on my own knowledge') and Direct Customer Engagement Behavior ('I will choose the farmland as my first choice for tourism'). After removing non-fit items, eight principal components including Indirect Customer Engagement Behavior (α=.924), Satisfaction (α=.856), Gain Performance Experience (α=.824), Positive Emotions (α=.804), Hedonic Imagery Experience (α=.706), Direct Customer Engagement Behavior (α=.813), Reliability Imagery Experience (α=.697) and Loss Avoidance Performance Experience (α=.640) indicated good internal consistency.
Table 4: Results of Analyzing Components
Positive emotion
EM4 .192 .250 .030 .721 .137 .134 .176 .128 .754
EM3 .179 .353 .360 .663 -.009 .038 .150 .061 .704 .804
EM1 .194 .147 .119 .572 .389 .101 .165 .251 .652
EM2 .240 .021 .177 .570 .400 .218 .160 .078 .653
Hedonic imagery
experience HE1HE2 .148.136 .240.319 .193.216 .144.221 .736.685 .162.033 .131.061 .069.166 .728.717 .706 Direct customer
engagement behavior DG2DG1 .310.288 .254.233 .143.167 .153.169 .097.155 .739.717 .202.188 .140.139 .820.786 .813 Reliability imagery
experience RE2RE1 .137.028 .068.232 .095.140 .099.307 .189.018 .197.095 .817.752 .157.107 .810.755 .697 Loss avoidance
experience LE2LE1 .227.098 .227.270 .184.190 .079.259 .125.139 .236.043 .149.185 .695.687 .721.713 .640
Eigen value 5.105 2.814 2.515 2.342 1.817 1.713 1.685 1.557
Variance Explained 18.909 10.421 9.314 8.674 6.731 6.345 6.242 5.765 Variance Cumulative 18.909 29.331 38.644 47.318 54.049 60.394 66.636 72.401
KMO Measure of Sampling Adequacy .956
Bartlett's Test of Sphericity Approx. Chi-Square 6496.256
df 351
Sig. .000
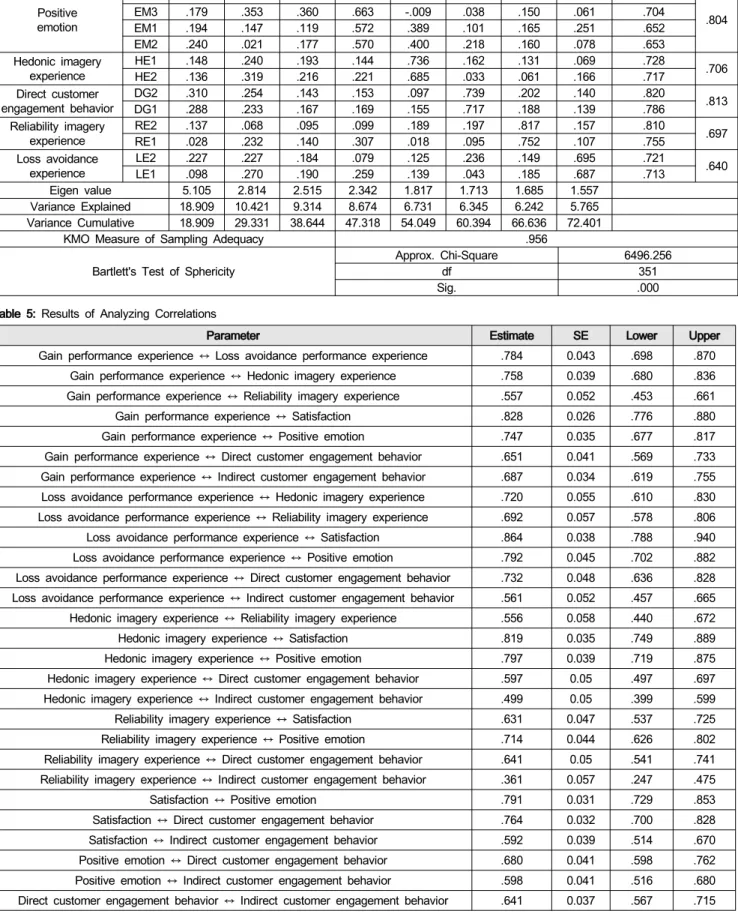
Table 5: Results of Analyzing Correlations
Parameter Estimate SE Lower Upper
Gain performance experience ↔ Loss avoidance performance experience .784 0.043 .698 .870 Gain performance experience ↔ Hedonic imagery experience .758 0.039 .680 .836 Gain performance experience ↔ Reliability imagery experience .557 0.052 .453 .661
Gain performance experience ↔ Satisfaction .828 0.026 .776 .880
Gain performance experience ↔ Positive emotion .747 0.035 .677 .817 Gain performance experience ↔ Direct customer engagement behavior .6510.041.569 .733 Gain performance experience ↔ Indirect customer engagement behavior .687 0.034 .619 .755 Loss avoidance performance experience ↔ Hedonic imagery experience .720 0.055 .610 .830 Loss avoidance performance experience ↔ Reliability imagery experience .692 0.057 .578 .806 Loss avoidance performance experience ↔ Satisfaction .864 0.038 .788 .940 Loss avoidance performance experience ↔ Positive emotion .792 0.045 .702 .882 Loss avoidance performance experience ↔ Direct customer engagement behavior .732 0.048 .636 .828 Loss avoidance performance experience ↔ Indirect customer engagement behavior .5610.052 .457 .665 Hedonic imagery experience ↔ Reliability imagery experience .556 0.058 .440 .672
Hedonic imagery experience ↔ Satisfaction .819 0.035 .749 .889
Hedonic imagery experience ↔ Positive emotion .797 0.039 .719 .875
Hedonic imagery experience ↔ Direct customer engagement behavior .597 0.05 .497 .697 Hedonic imagery experience ↔ Indirect customer engagement behavior .499 0.05 .399 .599
Reliability imagery experience ↔ Satisfaction .6310.047 .537 .725
Reliability imagery experience ↔ Positive emotion .714 0.044 .626 .802 Reliability imagery experience ↔ Direct customer engagement behavior .6410.05 .541.741 Reliability imagery experience ↔ Indirect customer engagement behavior .3610.057 .247 .475
Satisfaction ↔ Positive emotion .7910.031.729 .853
Satisfaction ↔ Direct customer engagement behavior .764 0.032 .700 .828 Satisfaction ↔ Indirect customer engagement behavior .592 0.039 .514 .670 Positive emotion ↔ Direct customer engagement behavior .680 0.041.598 .762 Positive emotion ↔ Indirect customer engagement behavior .598 0.041.516 .680 Direct customer engagement behavior ↔ Indirect customer engagement behavior .6410.037 .567 .715
3.5. Correlations among Constructs
Table 5 demonstrates results of analyzing correlation among the constructs. In current research, we come up with the method of evaluating whether or not to reject the hypothesis suggesting that the testing constructs are related.
In this case, discriminant validity does exist when the results calculated by (ø ± 2 x standard error) formula exclude value of 1 with 95% of confidence interval. Table 5 suggests that value of 1 is outside the interval between Lower value and Upper value, which proved the discriminant validity.
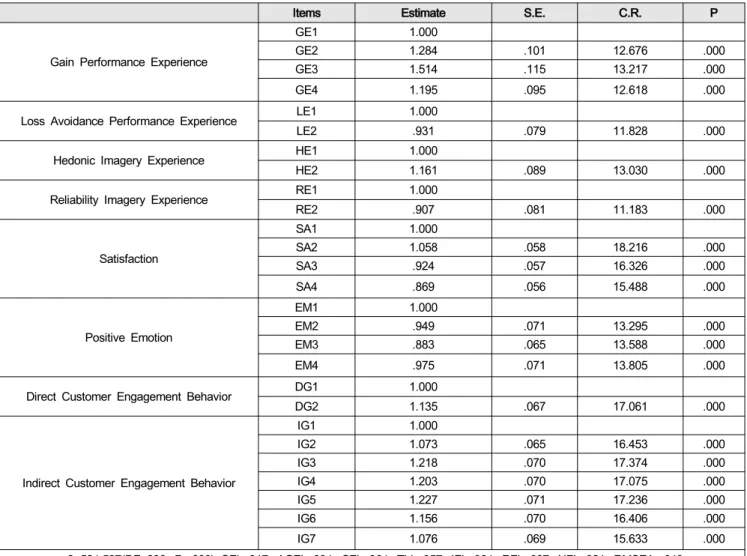
3.6. Testing Measurement Model
We test our measurement model under AMOS 21.0 program by performing confirmation factor analysis. Results shown in Table 6 indicated that the model fits this study well (GFI=.917, AGFI=.894, CFI=.964, TLI=.957, IFI=.964,
RFI=.907, NFI=.921, RMSEA=.043) with all C.R. above 1.96.
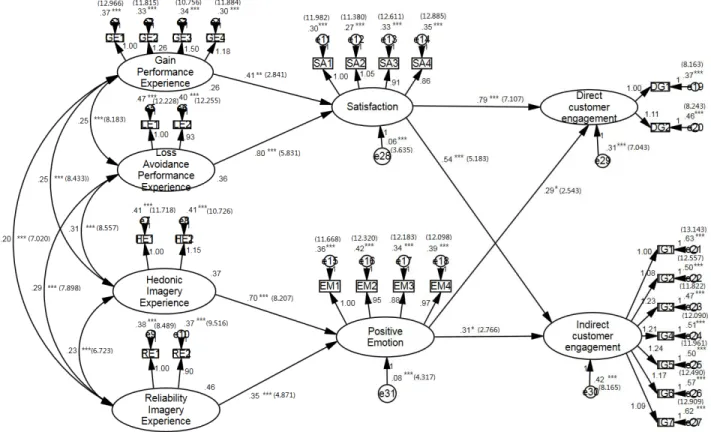
3.7. Testing Hypotheses
Tested by structural equation model analysis of AMOS 21.0 program, the hypotheses revealed good fits with the results of χ2=617.140 (DF=310, P=.000), GFI=.904, AGFI=.883, CFI=.951, TLI=.945, IFI=.952, RFI=.895, NFI=.907, RMSEA=
.049.
In detail, the analysis results showed all of the hypotheses accepted: H1a (Estimate=.786, CR=7.107, P=.000), H1b (Estimate=.544, CR=5.831, P=.000), H2a (Estimate=.293, CR=2.543, P=.011), H2b (Estimate=.310, CR=2.766, P=.006). H3 (Estimate=.414, CR=2.841, P=.004), H4 (Estimate=.797, CR=5.831, P=.000), H5 (Estimate=.699, CR=8.207, P=.000) and H6 (Estimate=.349, CR=4.871, P=.000).
Table 6: Results of Testing Measurement Model
Items Estimate S.E. C.R. P
Gain Performance Experience
GE11.000
GE2 1.284 .101 12.676 .000
GE3 1.514 .115 13.217 .000
GE4 1.195 .095 12.618 .000
Loss Avoidance Performance Experience LE11.000
LE2 .931 .079 11.828 .000
Hedonic Imagery Experience HE11.000
HE2 1.161 .089 13.030 .000
Reliability Imagery Experience RE11.000
RE2 .907 .081 11.183 .000
Satisfaction
SA11.000
SA2 1.058 .058 18.216 .000
SA3 .924 .057 16.326 .000
SA4 .869 .056 15.488 .000
Positive Emotion
EM11.000
EM2 .949 .07113.295 .000
EM3 .883 .065 13.588 .000
EM4 .975 .07113.805 .000
Direct Customer Engagement Behavior DG11.000
DG2 1.135 .067 17.061 .000
Indirect Customer Engagement Behavior
IG11.000
IG2 1.073 .065 16.453 .000
IG3 1.218 .070 17.374 .000
IG4 1.203 .070 17.075 .000
IG5 1.227 .071 17.236 .000
IG6 1.156 .070 16.406 .000
IG7 1.076 .069 15.633 .000
χ2=524.597(DF=296, P=.000) GFI=.917, AGFI=.894, CFI=.964, TLI=.957, IFI=.964, RFI=.907, NFI=.921, RMSEA=.043
Table 7: Results of Testing Hypotheses
Hypotheses Path Estimate S.E. C.R. P Results
H1a Satisfaction → Direct Customer Engagement Behavior .786 .111 7.107 .000 Accepted H1b Satisfaction → Indirect Customer Engagement Behavior .544 .105 5.831 .000 Accepted H2a Positive Emotion → Direct Customer Engagement Behavior .293 .115 2.543 .011 Accepted H2b Positive Emotion → Indirect Customer Engagement Behavior .310 .112 2.766 .006 Accepted
H3 Gain Performance Experience → Satisfaction .414 .146 2.841 .004 Accepted
H4 Loss Avoidance Performance Experience → Satisfaction .797 .137 5.831 .000 Accepted H5 Hedonic Imagery Experience → Positive Emotion .699 .085 8.207 .000 Accepted H6 Reliability Imagery Experience → Positive Emotion .349 .072 4.871.000 Accepted
χ2=617.140 (DF=310, P=.000) GFI=.904, AGFI=.883, CFI=.951, TLI=.945, IFI=.952, RFI=.895, NFI=.907, RMSEA=.049
Note: Estimate(C.R.), *: P<0.1;.**: P<0.05; ***: P<0.001, →: supported.
Figure 2: Results of Testing Hypotheses
3.8. Moderation Effect Analysis
Each of the given scenarios are attached by two questions to split participants into two subset types of regulatory focus. Data containing values lower than 4 in regulatory section belong to promotion focus group while data greater than 4 in its value is embraced in prevention focus group. T-test was used to test the effectiveness of manipulation. The values from the two answers were
summed and averaged to generate the mean value of each subset type. Results shown in Table 8 indicates that the manipulation significantly worked as intended (M=1.3555 at promotion orientation, M=6.3927 at prevention orientation).
Table 8: Results of Checking Regulatory Focus Differences
Regulatory Focus N Mean SD t Sig.
Promotion Focus 211 1.3555 .50399 94.051.000 Prevention Focus 205 6.3927 .58636
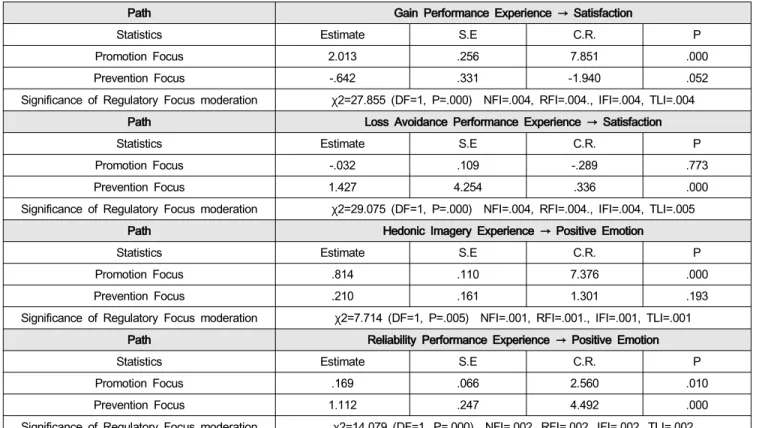
Moderation bootstrap of AMOS 21.0 program was operated to make sure the regulatory focus takes moderating effects. Moderation effects analyzed under nested model are shown in table 9, Accordingly, hypothesis 7 is proved to be correct (χ2=27.855, DF=1, P<.01). In the same way, hypothesis 8 (χ2=29.075, DF=1, P<.01) and hypothesis 9 are supported (χ2=7.714, DF=1, P<.01). Significant evidence supporting hypothesis 10 also was found (χ 2=14.079, DF=1, P<.01).
Findings from current study indicated that promotion- focused customers, rather than prevention-focused ones, perceive higher level of satisfaction after gain performance experience. Besides, those who have prevention focus report higher level of satisfaction after experiencing loss avoidance, compared to promotion focus. This study also demonstrated that the positive effects of two imagery experience categories on positive emotion can be moderated by regulatory focus since after hedonic imagery experience, customers feel more positive under promotion orientation than under prevention orientation; but prevention-focused customers express more positive emotion than promotion- focused customers after reliability imagery experience.
4. General Discussion 4.1. Research Summary
Most of academic analysts have acknowledged CE as a concept covering several components including behavioral, cognitive and affective dimension. One of key features provoking customers’ willingness or capacity to engage brand is the consciousness of being satisfied with the brand.
Besides, positive emotions motivates people to express their feelings more to public and give higher product ratings, which implies positive emotions predominantly influence customer engagement behaviors.
Furthermore, customer experience underlying satisfaction and positive emotions comes from a set of interactions between them and product/organization. It might be observed under four touch points (i.e., brand-owned, partner-owned, customer-owned, and social) that consist of individual contacts between firm and customers during total experience journey. Besides, linking to regulatory focus theory that posit two fundamental motivational systems (promotion-focused and prevention-focus), the effects of customer experience on satisfaction or positive emotion can become different between regulatory focuses.
Table 9: Moderation Effects of Regulatory Focus
Path Gain Performance Experience → Satisfaction
Statistics Estimate S.E C.R. P
Promotion Focus 2.013 .256 7.851 .000
Prevention Focus -.642 .331-1.940 .052
Significance of Regulatory Focus moderation χ2=27.855 (DF=1, P=.000) NFI=.004, RFI=.004., IFI=.004, TLI=.004
Path Loss Avoidance Performance Experience → Satisfaction
Statistics Estimate S.E C.R. P
Promotion Focus -.032 .109 -.289 .773
Prevention Focus 1.427 4.254 .336 .000
Significance of Regulatory Focus moderation χ2=29.075 (DF=1, P=.000) NFI=.004, RFI=.004., IFI=.004, TLI=.005
Path Hedonic Imagery Experience → Positive Emotion
Statistics Estimate S.E C.R. P
Promotion Focus .814 .110 7.376 .000
Prevention Focus .210 .161 1.301 .193
Significance of Regulatory Focus moderation χ2=7.714 (DF=1, P=.005) NFI=.001, RFI=.001., IFI=.001, TLI=.001 Path Reliability Performance Experience → Positive Emotion
Statistics Estimate S.E C.R. P
Promotion Focus .169 .066 2.560 .010
Prevention Focus 1.112 .247 4.492 .000
Significance of Regulatory Focus moderation χ2=14.079 (DF=1, P=.000) NFI=.002, RFI=.002. IFI=.002, TLI=.002
Based on above theoretical literature about customer engagement, satisfaction, positive emotion and customer experience, this paper developed several hypotheses to build research model and conducted empirical study. Structural equation model of AMOS 21.0 was used to verify the proposed hypotheses. 416 Vietnamese visitors of Moc Chau Greentea Farmland were recruited for empirical investigation.
The results are listed below.
First, customers are more engaged both directly and indirectly when higher level of satisfaction is induced.
Second, customers are more engaged to firms when they have positive feelings. Third, gain or loss avoidance experience positively influences on satisfaction with the firm.
Fourth, both hedonic and reliability imagery experience positively influence on emotion to the firm. Last, regulatory focus moderates the positive effects of gain or loss avoidance experience on satisfaction with the firm, and also moderates the positive effects of hedonic and reliability imagery experience on the emotion to the firm.
4.2. Theoretical and Managerial Implication
In past research, customer engagement was understood as value-adding activities toward firm (Pansari & Kumar, 2017), and was from satisfaction and positive emotional connection experience (Johnson & Fornell, 1991; Kitayama, Markus & Kurokawa, 2000; Juric & Hollebeek, 2013), without considering performance experience types or imagery experience types. However, we identify how touch points and product's attributes shape four types of customer experience. It is explored that gain performance experience and loss avoidance performance experience take primary effects on satisfaction while hedonic imagery and reliability imagery experience underlie positive emotion, Also, this study particularly highlighted the differences between regulatory focuses in the effects of each imagery experience on emotions and those in the effects of each performance experience on satisfaction. Therefore, this study could advance the experience and engagement theory in view of both cognitive and affective aspects of experiences.
Managerially, experience is the ideal approach to inspire customers' absorption into, identification and interaction with, a brand. As a result, to attract tourists or encourage them to revisit, marketers should raise higher level of satisfaction by providing customers with more desirable gain and loss avoidance performance experience. For example, within range of greentea farmland, the fundamental step is improving goods quality and product variety. Along with that, access to media channels and information layout should be simplified so that customers can understand easily. In order to avoid wasteful time or unveiling secrecy, the application of technology utilities that helps abolish cumbersome procedures and training employees to be skilled should be considered essential. Moreover, even setting low price for sake of attracting more customers seems not to bring
long-term benefits, companies should implement gratitude programs such as lucky draws, discounts, coupons and so on.
Simultaneously, creating favorable hedonic and reliability imagery experience that make them feel positive is also an other strategy to strengthen customer engagement. For example, more investment should be poured into landscape decorations and advertisement design so as to convey pleasantness to customers and grab their attention at first sight. In addition to full installment of safety equipment, they should give attention to staff expertise regarding knowledge about destination as well as professionalism in solving customers’ problems.
However, brand marketers must understand how to effectively develop as well as manage various types of experiences that fit certain target customers. On one hand, for promotion-focused customers, firms should implement strategic programs to increase their perceived gain performance experience and hedonic imagery experience.
The suggested ways are creating or adding new attributes and using multiple channels, whether online or offline, to foster engagement with their brands over competitors.
Furthermore, they should provide informative entertaining or educational contents to develop a unique, attractive image in customer's memory that enables brand differentiation easily.
On the other hand, for prevention-focused customers, loss avoidance performance experience and reliability imagery experience play the key role in inducing their engagement.
The appropriate strategy is to make them feel safe and evaluate their brand as highly reliable, which might be possible by training employees to take over customers' trust, and by installing safety equipment effectively and offering periodical promotion programs.
By conducting the suggestive distribution strategies mentioned above, managers can not only allure more new customers to come but also retain existing customers.
4.3. Limitations and Future Research
The findings of this study are subjected to a number of limitations which can be mitigated by future research.
First, this study was exploratory nature under one-country basis (Vietnam), therefore, future research should investigate the customer experience and engagement in countries with varying cultures (Zhang, 2018; Ramana & Retnosari, 2018) and religions and use a larger and more representative sample in terms of age and nationality.
Second, it would be useful for future research to assess other brands such as tourism organization and other major attractions or hotels which need customer engagement.
Third, understanding the role of negative emotions, whether experienced voluntarily or unintentionally, would also be an interesting area for future research to explore the negative effects on the engagement.
Fourth, further study can explore the other touch points
such as partner-owned touch points and social touch points which are still in the drowning part of the iceberg and receive little attention from current research.
Last, Jensen (2014) pointed to the critical issue of whether results from single studies on tourist experiences can be applied in different contexts. While findings of this study are contextualized, it would be interesting to investigate other tourist activities, as well as other experiential contexts and consumption activities outside of the tourism domain.
References
Anderl, E., Schumann, J. H., & Kunz, W. (2016). Helping firms reduce complexity in multichannel online data: a new taxonomy-based approach for customer journeys.
Journal of Retailing, 92(2), 185-203.
Arnold, M. J., & Reynolds, K. E. (2009). Affect and retail shopping behavior: Understanding the role of mood regulation and regulatory focus. Journal of Retailing, 85(3), 308-320.
Arnold, M. J., Reynolds, K. E., Ponder, N., & Lueg, J. E.
(2005). Customer delight in a retail context:
Investigating delightful and terrible shopping experiences. Journal of Business Research, 58(8), 1132-1145.
Bagozzi, R. P., Gopinath, M., & Nyer, P. U. (1999). The role of emotions in marketing. Journal of the Academy of Marketing Science, 27(2), 184-206.
Baker, A. M., Donthu, N., & Kumar, V. (2016).
Investigating how word-of-mouth conversations about brands influence purchase and retransmission intentions. Journal of Marketing Research, 53(2), 225-239.
Baumgartner, H., Sujan, M., & Bettman, J. R. (1992).
Autobiographical memories, affect, and consumer information processing. Journal of Consumer Psychology, 1(1), 53-82.
Brakus, J. J., Schmitt, B. H., & Zarantonello, L. (2009).
Brand experience: what is it? How is it measured?
Does it affect loyalty? Journal of marketing, 73(3), 52-68.
Brodie, R. J., Ilic, A., Juric, B., & Hollebeek, L. (2013).
Consumer engagement in a virtual brand community:
An exploratory analysis. Journal of Business Research, 66(1), 105-114.
Chernev, A. (2004). Goal-attribute compatibility in consumer choice. Journal of Consumer Psychology, 14(1-2), 141-150.
Cheung, C., Lee, M., & Jin, X. (2011). Customer engagement in an online social platform: A conceptual model and scale development. Paper presented at Thirty Second International Conference on Information
Systems, Shanghai, China.
Chevalier, J. A., & Mayzlin, D. (2006). The effect of word of mouth on sales: Online book reviews. Journal of Marketing Research, 43(3), 345-354.
Dwivedi, A. (2015). A higher-order model of consumer brand engagement and its impact on loyalty intentions.
Journal of Retailing and Consumer Services, 24(C), 100-109.
Engel, J. F., Blackwell, R. D., & Miniard, P. W. (1995).
Consumer behavior, 8th. New York, NY: Dryder.
Escalas, J. E. (2004). Imagine yourself in the product:
Mental simulation, narrative transportation, and persuasion. Journal of Advertising, 33(2), 37-48.
Essick, G. K., McGlone, F., Dancer, C., Fabricant, D., Ragin, Y., Phillips, N., Jones T. & Guest, S. (2010).
Quantitative assessment of pleasant touch.
Neuroscience & Biobehavioral Reviews, 34(2), 192-203.
Falk, T., Hammerschmidt, M., & Schepers, J. J. (2010).
The service quality-satisfaction link revisited: exploring asymmetries and dynamics. Journal of the Academy of Marketing Science, 38(3), 288-302.
Fedorikhin, A., Park, C. W., & Thomson, M. (2008).
Beyond fit and attitude: The effect of emotional attachment on consumer responses to brand extensions. Journal of Consumer Psychology, 18(4), 281-291.
Filep, S. (2014). Moving beyond subjective well-being: A tourism critique. Journal of Hospitality & Tourism Research, 38(2), 266-274.
Florack, A., Keller, J., & Palcu, J. (2013). Regulatory focus in economic contexts. Journal of Economic Psychology, 38, 127-137.
Fullerton, G. (2005). The impact of brand commitment on loyalty to retail service brands. Canadian Journal of Administrative Sciences, 22(2), 97-110.
Gentile, C., Spiller, N., & Noci, G. (2007). How to sustain the customer experience: An overview of experience components that co-create value with the customer.
European Management Journal, 25(5), 395-410.
Golder, P. N., Mitra, D., & Moorman, C. (2012). What is quality? An integrative framework of processes and states. Journal of Marketing, 76(4), 1-23.
Gummerus, J., Liljander, V., Weman, E., & Pihlström, M.
(2012). Customer engagement in a facebook brand community. Management Research Review, 35(9), 857-877.
Higgins, E. T. (2005). Value from regulatory fit. Current Directions in Psychological Science, 14(4), 209-213.
Higgins, E. T., Shah, J., & Friedman, R. (1997).
Emotional responses to goal attainment: strength of regulatory focus as moderator. Journal of Personality and Social Psychology, 72(3), 515.
Hosany, S., & Gilbert, D. (2010). Measuring tourists’
emotional experiences toward hedonic holiday destinations. Journal of Travel Research, 49(4),