• 검색 결과가 없습니다.

3D Modeling of a Fabric based on its 3D Microstructure Image and Application of the Model of the Numerical Simulation of Heat Transfer

N/A
N/A
Protected

Academic year: 2021

Share "3D Modeling of a Fabric based on its 3D Microstructure Image and Application of the Model of the Numerical Simulation of Heat Transfer"

Copied!
13
0
0

로드 중.... (전체 텍스트 보기)

전체 글

(1)

I. Introduction

As society evolves and consumer demands increase, new and improved fabrics are continually being developed with the aid of high-end technologies. In recent years, polymers

Corresponding author: Yejin Lee, Tel. +82-42-821-6824 E-mail : [email protected]

This research was supported by Basic Science Research Program through the National Research Foundation of Korea(NRF) funded by the Ministry of Science, ICT & Future Planning (No. 2010-0005553)

on the nano scale have been fabricated and the cross sections of the fibers can be modified from the standard round shape into a variety of more complex forms in order to enhance touch, heat, and moisture-regulating properties. In addition to mechanical finishes, chemical finishes

3D Modeling of a Fabric based on its 3D Microstructure Image and Application of the Model of the Numerical

Simulation of Heat Transfer

Hyojeong Lee Heeran Lee Ran-i Eom Yejin Lee

Department of Clothing & Textiles, Chungnam National University, Korea

Abstract

The objective of this study was to perform 3D solid modeling from 3D scanned surface images of cotton and silk in order to calculate the thermal heat transfer responses using numerical simulations. Continuing from the previous methodology, which provided 3D surface data for a fabric through optical measurements of the fabric microstructure, a simplified 3D solid model, containing a defined unit cell, pattern unit and fabric structure, was prepared. The loft method was used for 3D solid-model generation, and heat transfer calculations, made for the fabric, were then carried out using the 3D solid model. As a result, comprehensive protocols for 3D solid-model generation were established based on the optical measurements of real fabric samples. This method provides an effective means of using 3D information for building 3D models of actual fabrics and applying the model in numerical simulations. The developed process can be used as the basis for other analogous research areas to investigate the physical characteristics of any fabrics.

Keywords : 3D technology, 3D solid modeling, Microstructure, 3D image, Heat transfer,

Numerical simulation

(2)

also often involve geometrical changes, so that research pertaining to structural analysis is highly significant during the development of new fabrics. However, quantifying the structural characteristics of the fabric system is quite complex, because of the irregular characteristics of the fiber-yarn-fabric structure. Moreover, prediction of the final performance from the initial structure of the fiber-yarn-fabric structure is exceedingly difficult, and repeating the existing evaluation cycle from the initial stage to the resulting performance levels is costly and time consuming.

By adopting modeling techniques, the specifications of a single fiber, yarn, textile, or any additional functional materials for the desired fabric can be fine-tuned without repeated trials, leading to cost-savings and increasing the possibility of successful outcomes, by virtually creating and evaluating design strategies of the fabrics. Most of the previous studies used mathematical definitions for 3D fabric structure generation, with cross sections of a circle or an ellipse (Buchanan, Grigorash, Quinn, Mcilhagger, & Young, 2010;

Chang & Chen, 2011; Li, Zhou, Yu & Li, 2011;

Li & Zou, 2011; Ozgen & Gong, 2011; Zhang, Wang & Palmer, 2010). These approaches work well for simple structures, but the mathematical definitions are not suitable for representing the

Figure 1. 3D Surface of Cotton and Silk -Lee & Lee , 2012

complex nature of fabrics composed of protruding warp and weft yarn, changes in thickness, or distortion from overlapping threads.

In this study, building upon previous methodologies (Lee & Lee, 2012), which provided 3D surface data information of fabric, an optimized modeling system of the fabric was developed directly from irregular 3D fiber shapes. As an application of this modeling system, a simple heat transfer experiment that focused on conductive heat transfer depending on the contact area of the irregular fabric model was carried out.

II. Methods

1. Surface generation from 3D measurement data

The modeling was based essentially on the reverse engineering method with 3D measurement data obtained by a confocal scanning microscope(LEXT OLS3000, Olympus NDT Inc.). The magnification of the microscope was 180×, and it is a non-contact method.

Cotton and silk were the target fabrics studied

in this work, and the 3D measurement data

Figure 1 from previous experiments (Lee & Lee,

(3)

Fabric Density (g/cm3) Weight (g/cm2) Thickness (µm)

Cotton 1.46 156 190

Silk 1.34 150 120

Table 1. Mechanical Properties of the Experimental Fabric

Figure 2. Method of Step-By-Step Yarn Generation using the Loft Surfaces (Cotton and Silk) (a): Select Basic Unit of Warp and Weft, (b): Cross-Sectional View, (c): Path for Loft, and (d):

Result for Loft

2012) were used for modeling with a Rapidform XOR (3D Systems Korea Inc.). The physical properties of the fabrics are shown in Table 1.

2. 3D solid modeling of the fabric microstructure

In order to conduct heat transfer analyses of the fabric in a numerical simulation, an appropriate process for conversion of the 3D mesh data of the fabric is necessary. First, the basic unit from 3D mesh data was selected for yarn modeling (Figure 2(a)). Cross sections were then identified at selected locations, in both

lateral and longitudinal directions (Figure 2(b)).

The paths used as guidelines were then extracted from the cross-sectional geometry of the lateral and longitudinal sectional plane for loft generation (Figure 2(c)). Finally, the loft solid was generated by a loft-connection of the cross-section geometry (Figure 2(d)).

In general, the cross-sectional geometry

extracted from scanned 3D mesh data, has an

uneven surface due to the fine hairs of the fiber

and missing data during the measurement or

conversion process. Thus, the data in this form

is not appropriate for use in heat transfer

analyses with numerical simulation software, and

(4)

simplification is necessary. Thus, curve fitting of cross-sectional geometry and loft path was conducted, as shown in Figures 3 and 4. For weft directions, the cross-sectional geometry of the irregular surface shape of yarn from the mesh sketch can be modeled with 18 and 7 points (Figure 3(a)), 9 and 5 points (Figure 3(b)), and 6 and 5 points (Figure 3(c)). At this time, the higher number of interpolation points makes the greater accuracy. The mesh sketch of the warp direction can be simplified in a similar manner, as shown in Figure 4.

After making each unit of warp and weft yarn with a proper level of simplification, two yarns were then merged to form a basic unit cell. The intersecting portions of the merged unit cell pattern were removed by trims. The basic unit modeling is then completed by combining two original independent surfaces into a single merged surface body. Lastly, the basic unit solid modeling of the microstructure of the fabric surface was completed by converting the solid

Figure 3. Change in the Number of Points for Modeling (Weft Direction of Cotton and Silk) (a): 18 and 7 Points, (b): 9 and 5 Points, and (c): 6 and 5 Points

geometry, using block the boundary of surface modeling.

The fabric solid model with four junctions the — proper shape for heat transfer simulations was — developed by reversing the basic-unit solid model obtained from the above procedures, with the fabric being formed by repeating the pattern of the unit cell. In order to validate the generated solid model, it is necessary to compare the reproduced fabric pattern with the original fabric. The original fabric pattern and the size of pores were measured using scanning electron microscopy(SEM). The warp width, weft width, and length and width of the pores in the solid model were measured using a 3D analysis program, and the difference between the dimensions in the SEM image and those of the solid model were then investigated.

2. Heat transfer tests and calculations

To conduct steady-state heat transfer analyses

(5)

Figure 4. Change in the Number of Points for Modeling (Warp Direction of Cotton and Silk)

(a): 18 and 7 Points, (b): 9 and 5 Points, and (c): 6 and 5 Points

of the target fabric, the 3D solid models of cotton were imported using the commercially available numerical simulation software: ANSYS Steady-state Thermal. In this study, three different contact areas were tested-10,026 µm

2

,179,990µm

2

,287,990µm

2

on cotton and 11,290 µm

2

, 96,642 µm

2

,162,940 µm

2

in silk - in order to test the effect of contact area on the conductive heat transfer between the compressible fabric and heating surface.

Additionally, a simple 3D solid model was made with the same height, width, and length as cotton and silk for comparison of the results from heat transfer calculations.

III. Results and Discussion

1. Results of 3D solid modeling

Figure 5 shows the 3D unit loft modeling for

each weft and warp yarn. It is important to note

that irregular shapes within the weft and warp

yarns can be reproduced even with simplified

modeling, which is impossible with conventional

methods using the mathematical definition

formula. Figure 6 shows the basic 3D unit cell

model of cotton and silk by merging the weft

and warp yarns. The shape of the 3D solid

model became simpler and smoother as the

simplification level increases, as shown in

Figures 6(a), 6(b), and 6(c). Cotton has a more

(6)

coarse texture than silk does, resulting in a more wiggly shape, and the solid model of silk has smooth surfaces, with relatively small changes associated with the simplification process.

Figure 7 shows the basic 3D pattern module

Figure 5. 3D Unit Loft Model of Each Weft and Warp Yarn (Cotton and Silk) (a): 18 and 7 Points, (b): 9 and 5 Points, and (c): 6 and 5 Points

Figure 6. Basic 3D Unit Cell Modeling Results for Cotton and Silk Modeled in 3 Steps (a): 18 and 7 Points, (b): 9 and 5 Points, and (c): 6 and 5 Points

generated using repetitions of the 3D unit cell

shown in Figure 6. By using the 3D pattern

module, the structure of the desired fabric can

be fully reproduced, as shown in Figures 8(c)

and 8(d). Figures 8(a) and 8(b) show SEM

images of the target fabrics, for comparison with

(7)

the final modeling results shown in Figures 8(c) and 8(d). The width of the fiber and the size of the pores in SEM images of the actual fabrics were compared with those of the 3D fabric structure generated by the modeling data. Tables

Figure 7. Basic 3D Pattern Unit Generation Using Repetitions of a 3D Unit Cell. (a):Cotton, (b):Silk

Figure 8. Comparison of SEM Images and 3D Fabric Structure Modeling Results for Cotton and Silk. (a): SEM Image of Cotton, (b): SEM Image of Silk, (c): 3D Modeling of Cotton Pattern, and (d): 3D Modeling of Silk Pattern

2 and 3 show the comparisons of measured

values of the real fabrics and solid models for

the cotton and silk, respectively. It is important

to note that there are no significant differences

( α = 0.05).

(8)

Table 2. Comparison of the Measurement Values of Cotton using SEM and 3D Modeling (unit: m) μ

SEM 3D

modeling a

3D modeling b

3D modeling c

M (SD) M (SD) t M (SD) t M (SD) t

Warp width 176.3 (18.3)

229.8

(10.5) -4.102 220.7 (1.2) -7.005 213.3

(7.4) 20.455

Weft width 139.8 (14.9)

159.2

(20.4) -5.691 164.3

(17.4) -.829 160.4

(20.0) -.591

Width porosity 117.9 (33.2)

106.5

(13.2) .367 127.9

(16.0) -1.253 118.1

(11.2) -.256

Length porosity 126.1 (29.5)

135.4

(26.8) -.175 117.0

(15.9) .774 123.2

(25.3) .581

*p < 0.05; there is significant difference

Table 3. Comparison of the Measurement Values of Silk using SEM and 3D Modeling (unit: m) μ

SEM 3D

modeling a

3D modeling b

3D modeling c

M (SD) M (SD) t M (SD) t M (SD) t

Warp width 171.3

(9.5) 163.2 (3.1) 1.667 164.7 (4.5) -.313 161.7 (3.8) 2.273 Weft width 162.7

(15.7) 218.2 (6.9) -8.345 210.8

(11.2) -4.607 212.8 (7.9) -6.573 Width porosity 44.4

(4.7) 42.6 (11.2) -.076 41.3 (10.1) .175 42.7 (10.4) -.113 Length porosity 74.7

(17.5) 53.2 (7.8) 2.078 58.7 (7.8) 1.776 56.5 (5.2) 1.803

*p < 0.05; there is significant difference

2. Heat transfer tests and calculations

Figure 9 shows the mesh generation of the 3D solid model of the cotton and silk. The basic pattern module was selected as a numerical calculation target and the automatic mesh was produced. The boundary conditions and constants for the steady-state thermal simulation are shown in Table 4. The thermal conductivity of cotton fibers proposed by equation (Fayala, Alibi, Benltoufa, & Jemni, 2008) was used for the calculation.

Figure 10 shows the simulation results of the

cotton with different contact areas. It was

assumed that the human body at 36.5°C was in

contact with the bottom of the fabric, and the

fabric is in an ambient environment at a

temperature of 21°C. As shown in the figure, the

temperature distribution of each sample shows

the influences of the contact area on the hot

surface (i.e human body temperature in this

case) and heat transfer characteristics (i.e

thermal conductivity) of the fabric. As the

contact area increases, the average temperature

(9)

Figure 9. Mesh Generation from ANSYS Simulation

Table 4. Boundary Conditions and Constants for a Steady-State Thermal Simulation using Cotton and Silk Modeling

Fabric Density Specific heat Thermal conductivity Supply heat temp.

Ambient temp.

Cotton 1.46 g/cm

3

1.21 J g

-1

K

-1

0.06Wm

-1

K

-1

36.5℃ 21℃

Silk 1.34 g/cm

3

1.38 J g

-1

K

-1

0.18 Wm

-1

K

-1

* air thermal conductivity: 0.024 Wm

-1

K

-1

of the fabric slightly increases, as well as the top surface temperatures also increases to 21.1°C, 21.3°C, and 21.4°C, sequentially. Note that, in the top view, the temperature of the inner hole area in the center is higher than that of the outer boundaries because the heat transfer of the horizontal direction cools down the fabric temperature of the outer boundaries.

Figure 11 shows the simulation results of the silk with different contact areas. For the silk case, the top surface temperatures are the same for the three different contact area conditions.

This is because the thermal conductivity of the silk is much higher than that of the cotton (Table 4). It could be explained that most of the heat from the hot bottom side was dissipated in the horizontal direction that leads to the top surface temperatures of the silk become the same for the different cases. Note that, in the top view, the temperature of the inner hole area in the center is higher than that of the outer

boundaries which is similar to the result of the cotton (Figure 10).

Table 5 shows the thermal insulation test results of the cotton and silk samples based on the standard test method: KS K 0560. The result shows that thermal insulation function of the cotton is better than that of the silk that coincides with the thermal conductivity information of the fabrics. The insulation function of the cotton is better than that of the silk because of its lower thermal conductivity.

This result agrees well with the numerical

simulation results. As shown in Fig. 10 and 11,

the top surface temperature of the cotton is

higher than that of the silk, because the heat

loss to the horizontal direction is less for the

cotton due to its low thermal conductivity.

(10)

Figure 10. Cotton Results of Steady-State Thermal Simulation

(11)

Table 5. Thermal Insulation of Cotton and Silk (KS K 0560)

Cotton Silk

Thermal insulation (%) 25.6 20.5

Figure 12. Results of the Steady-State Thermal Simulation using the Simple Hexahedron without (a)/(c) and with (b)/(d), a Porous Structure. (a): Contact Area 365,290 m2, (b): Contact Area μ

288,006 m2, (c): Contact Area 198,648 m2, and (d): Contact Area 148,986 m2 μ μ μ

For comparison, the simulation results with simple hexahedron models were conducted under the same boundary conditions for two different samples: one with and one without porosity. Compared to the 3D solid model based on 3D image, the hexahedron model is quite different from the real fabric which has irregular surface shape of yarn, different contact area for the bottom, different pore size and shape and etc. Figure 12 shows the heat transfer results of cotton and silk with the simple hexahedron model. As shown in the figure, it is hard to find any difference for each case. Though the contact area of the bottom is different for Fig.

12(a) and 12(b), the top surface temperature

was the same. For the silk case (Fig. 12(c) and

12(d)), the top surface temperature was also the

same. Note that the top temperature of the

cotton is 22.8°C and that of the silk is 36.4°C

and they are quite unrealistic results. The above

results show that accurate modeling of the

fabric is quite important for heat transfer

simulations, as it provides useful information on

important parameters such as contact area, solid

structure of the target material, porosity, and the

irregular surface shape of yarn. This implies that

the proposed 3D modeling method is powerful

for the investigation of the fabric research since

(12)

the model is able to consider the real structure fabrics. This approach can also be very helpful for predicting mechanical properties of fabrics as well as the other thermal characteristics.

IV. Conclusion

A comprehensive 3D solid model generation procedure with 3D images from real fabrics was developed. In order to maintain the basic nature of the curved fabric surfaces, 3D solid modeling was optimized with minimum change on the porosity of the fabric or the fiber size. For the verification of the developed model, heat transfer simulations were conducted with the 3D solid model of the target fabrics. It is important to note that the conductive heat transfer through the proposed 3D model with an irregular shape was much more realistic than that through the previous simpler fabric models (mathematical definitions for 3D fabric structure). The effect of contact area on the conductive heat was apparent in the case of the 3D fabric model, which was not detected in the case of the simple hexahedron model. The accurate solid model, based on real fabric measurements, facilitates the simulation of more realistic heat transfer phenomena on the fabric being studied, which is otherwise impossible with the simplified modeling. Continual development of the 3D fabric model is necessary for future in-depth studies. It will be possible to design transform of structure and modeling of cross section of fabric.

However, in the case of the proposed model for irregular fabric, the surface temperature of the top surface changes depending on the contact area, which often changes in a real situation. These results imply that accurate

modeling of the fabric is quite important for heat transfer simulations, as it provides useful information on important parameters such as contact area, solid structure of the target material, porosity, and the irregular surface shape of yarn.

Future Works

The proposed model described the intersection of warp and weft as one merged fabric. When modeling warp and weft as two independent entity, the current approach is not able to tell where the weaving of two threads intersects. In terms of describing the overall thickness and structure of the fabric, our model is successful, but in the view point of heat transfer, the micro structure of the intersection could make difference to the result of heat transfer analysis.

More realistic model for the interaction could be built with the help of better 3D image technologies and improvements of 3D modeling process.

Regarding the resolution of the 3D model, it is highly dependent on the objective of the modeling. If necessary, the more accurate modelling of heterogeneous and irregular fine spaces of fiber itself would be done, leading to the closest interpretation results to the actual fiber surface. On the other hand, a simplified model could be considered by reflecting average characteristics of the fiber including irregular lumen, cross section, twist, and micro spaces.

As modelling gets simple, the reduction of time

in mesh construction or interpretation is the

advantage. There is, however, possibility in

which the expanded information obtained from

partial fiber surface applied to the heat transfer

analysis of whole area of interest might be

(13)

different with actual data.

Therefore, the following future research will be conducted to improve the model: the methodology that applies 3D modelling and obtain image which distinguish warp and weft, the methodology that various partial fiber surface which can represent whole fiber surface is selected and the average value obtained from fiber surfaces is applied, and the methodology that the area of the fiber and the area of the empty surface from the total fiber surface are calculated and applied to modify the 3D modeling.

References

Buchanan, S., Grigorash, A., Quinn, J. P., Mcilhagger, A. T. & Young, C. (2010).

Modeling the Geometry of the Repeat Unit Cell of Three-Dimensional Weave Architectures. Journal of the Textile Institute, 101(7), 679-685.

Chang, K. & Chen, C. (2011). 3D shape Engineering and Design Parameterizaton.

Computer-Aided Design & Applications, 8(5), 681-692.

Fayala, F., Alibi, H., Benltoufa, S. & Jemni, A.

(2008). Neural Network for Predicting Thermal Conductivity of Knit Materials. Journal of Engineered Fibers and Fabrics, 3(4), 53-60.

Lee, Y. & Lee, B. (2012). A Novel Method for 3D Surcace and Solid Construction Analysis of Fabric Microstructure. The Korea Journal of Human Ecology, 21(3), 539-550.

Li, S., Zhou, C., Yu, H. & Li, L. (2011).

Formulation of a Unit Cell of a Reduced Size for Plain Weave Textile Composites.

Computational Materials Science, 50(5), 1770-1780.

Li, S. & Zou, Z. (2011). The Use of Central Reflection in the Formulation of Unit Cell for Micromechanical FEA. Mechanics of Materials, 43(12), 824-834.

Ozgen, B. & Gong, H. (2011). Modelling of Yarn Flattening in Woven Fabrics. Textile Research Journal. 81(15), 1523-1531.

Zhang, J., Wang, X. & Palmer, S. (2010).

Objective Pilling Evaluation of Nonwoven Fabrics. Fiber and Ploymers, 11(1), 115-120.

Received (May 4, 2016)

Revised (May 20, 2016; June 13, 2016)

Accepted (June 20, 2016)

수치

Figure  1.  3D  Surface  of  Cotton  and  Silk  -Lee  &amp;  Lee  ,  2012
Figure  2.  Method  of  Step-By-Step  Yarn  Generation  using  the  Loft  Surfaces  (Cotton  and  Silk) (a):  Select  Basic  Unit  of  Warp  and  Weft,  (b):  Cross-Sectional  View,  (c):  Path  for  Loft,  and  (d):
Figure  3.  Change  in  the  Number  of  Points  for  Modeling  (Weft  Direction  of  Cotton  and  Silk) (a):  18  and  7  Points,  (b):  9  and  5  Points,  and  (c):  6  and  5  Points
Figure  4.  Change  in  the  Number  of  Points  for  Modeling   (Warp  Direction  of  Cotton  and  Silk)
+7

참조

관련 문서

The model suggested consists of a stroke model that is a probable modeling of strokes that are fundamentals of characters, a grapheme model that is a

A technology transfer agent can be qualified with finishing its registration education course over 40 hours on the basis of the article 14 of law on the Promotion of

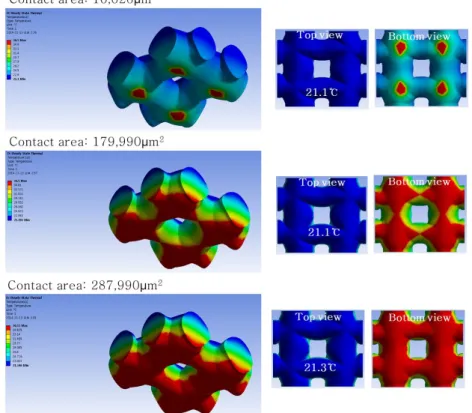
Also, the design of an optimal heat sink requires a complete knowledge of all heat transfer characteristics between the heat source and the ambient air

High heat transfer coefficient High thermal conductive material coatings.. Can reduce the constriction resistance

It considers the energy use of the different components that are involved in the distribution and viewing of video content: data centres and content delivery networks

After first field tests, we expect electric passenger drones or eVTOL aircraft (short for electric vertical take-off and landing) to start providing commercial mobility

1 John Owen, Justification by Faith Alone, in The Works of John Owen, ed. John Bolt, trans. Scott Clark, &#34;Do This and Live: Christ's Active Obedience as the

Based on the results above, the art therapy centering on modeling contributes to increase of concentration and the concentration period of children with ADHD