식품 위해 요인에 대한 우려도 및 식품 안전성 확보를 위한 정부, 식품 생산자, 소비자의 역할 수행에 대한 인식도
김 효 정1․김 미 라2†
1
인제대학교 생활상담복지학부, 인간환경복지연구소,
2경북대학교 식품영양학과, 장수생활과학연구소
Concerns about Hazardous Elements on Foods and Recognition of the Roles of Government, Food Producers, and Consumers in Securing Food Safety
Hyochung Kim
1and Meera Kim
2†1
School of Human Counseling & Welfare, The Institute of Human Environmental Welfare, Inje University, Gimhae 621-749, Korea
2
Dept. of Food Science & Nutrition, Center for Beautiful Aging, Kyungpook National University, Daegu 702-701, Korea
Abstract
The purpose of this study was to investigate consumer concerns about hazardous elements on foods and recognition of the roles of government, food producers, and consumers in securing food safety. The data were collected from the 443 adult consumers living in Seoul, Busan, Daegu, Incheon, Kwangju and Daejeon through a self-administered questionnaire. Fre- quencies, t tests, analysis of variance and Duncan's multiple range tests were conducted using SPSS Windows. The results of the survey were as follows: (1) the respondents were worried about health risks related to hazardous elements on foods, (2) many respondents were more worried about preservatives of imported foods than those of domestic foods, and (3) most respondents mentioned that observance of enforcement regulations by producers was the most important factor for ensuring food safety in the future. These results imply that regulations regarding the safety of imported foods should be increased.
Key words : Consumer recognition, hazardous element, food safety.
†
Corresponding author : Meera Kim, Tel : +82-53-950-6233, E-mail: [email protected]
서 론
과거 식량이 부족했던 시대에는 기아 해결이 식생활의 가 장 중요한 목표이었으나(김과 김 2010), 경제 성장에 따른 소 득 수준이 향상되면서 양보다는 질을 중시하는 식품 소비 패 턴으로 바뀌어가고 있다. 또한 무역 국제화로 인해 수입식품 이 대량으로 소비자에게 제공되고, 식품 과학 기술의 발달로 다양한 가공식품이 출현함에 따라 소비자들은 식품에 대한 선택 폭이 넓어지는 기회를 가지게 되었다.
그러나 농산물의 증산을 위한 농약의 과다 사용, 산업의 발달에 따른 중금속, 다이옥신 등 산업 오염 물질로 인한 토 양 및 수질 오염으로 농축수산물의 오염이 증가하고(Choe et
al 2005), 조류 독감, 광우병, 구제역 파동 등의 여러 가지 위
해(危害) 요인들로 인해 식품의 안전이 위협받고 있다. 또한 최근에는 식품 속의 이물질 발견 등 식품과 관련한 안전사고 가 끊이지 않고 발생함에 따라 먹을거리에 대한 불안감과 식 품 안전에 대한 관심이 급증하게 되었다.
WHO에서 정의하고 있는 식품 안전은 식품의 원료인 농수 산물의 재배, 수확, 저장, 제조(가공)를 포함하는 생산 단계를 비롯하여 유통과 판매를 거쳐 조리하고 섭취하는 소비의 전 과정을 포함하는 식품의 안전성, 건전성, 완전성을 확보하기 위한 모든 수단이라고 정의하고 있다(Yi JY 2005). Codex는 식품 안전을 “식품을 의도된 목적에 따라 조리하거나 먹었을 때 소비자가 해를 입지 않는 것”으로 정의하고 있다(김 과 김 2010).
최근 식품 안전에 대한 관심이 높아지면서 이에 대한 연
구가 수행되고 있다. 우리나라에서 식품의 위해 발생은 잔류
농약, 식품 첨가물, 식중독의 순으로 나타나고 있으며(장 등
2006), 수행된 대부분의 연구들은 주부들을 대상으로 식품
안전 또는 위해 요인에 관한 인식도 분석에 관한 것이다(Cho
SO 2008, Choe et al 2005, Lee & Kim 2009, Nam & Kim
2006). 그러나 식품 안전의 확보는 식품이 생산지로부터 식
탁에 이르는 다양한 단계에 있어서, 생산자, 유통 관계자, 행
정가나 소비자들이 각각의 입장에서 노력함으로써 확보되는
것이므로(Jang & Park 2006), 식품 안전 확보를 위한 각 주체
별 역할에 대한 소비자의 인식도를 살펴볼 필요가 있다. 따
라서 본 연구에서는 식품 구매 및 섭취 시 식품별 식중독, 잔 류 농약, 식품 첨가물로 인한 소비자들의 건강상 피해에 대 한 우려도를 살펴보고, 소비자들이 안전한 식생활을 영위하 기 위한 정부, 생산자, 소비자 등 관련 주체들의 역할 수행 정도에 대한 인식도를 분석함으로써 식품 안전 확보를 위한 정책 결정이나 관리 방향을 설정하는데 기초 자료를 제공하 고자 하였다.
연구 방법
1. 조사 대상 및 조사 기간
본 연구에서는 서울, 부산, 대구, 대전, 광주, 인천 등 6대 도시의 인구비례에 따른 쿼터를 적용하여 510명의 성인 남 녀에게 설문지를 배부한 후 스스로 기입토록 하는 자기 기입 식 방법으로 자료를 수집하였다. 본 조사에 앞서 50명의 성 인 남녀를 대상으로 예비 조사를 실시하여 이를 토대로 일부 문항을 수정, 보완한 후 2006년 8월에 본조사를 실시하였다.
최종 분석에는 회수된 설문지 중 부실 기재라고 판단되는 것 을 제외한 443부(회수율 86.9%)가 사용되었다.
2. 조사 도구
본 연구에서 사용된 설문지는 일반적인 위해 요인에 대한 인식도, 식품 구매 시 관심을 갖는 요소, 식품별(식품공전(http://
www.foodnara.go.kr/portal/site/kfdaportal/infotelegram/)의 식품 분류를 기준으로 하였음) 식품 구매 및 섭취 시 건강상 피해 에 대한 우려도, 식품 안전성 확보를 위한 주체별 현재 역할 수행 정도에 관한 인식도, 미래 식품 안전성 확보를 위한 주 체별 역할 중요성에 대한 인식도, 그리고 조사 대상자의 일 반적인 특성을 묻는 문항들로 구성되었다.
3. 자료 분석
수집된 자료는 SPSS Windows V.17.0 프로그램을 이용하 여 분석하였으며, 소비자의 인구 통계학적 특성 및 각 문항 에 대하여 빈도 분석을 실시하였다. 또한 소비자의 인구 통 계학적 특성에 따라 각 문항에 차이가 있는지를 살펴보기 위 하여 t test, 일원 분산 분석, Duncan의 다중 범위 분석을 실 시하였다.
결과 및 고찰
1. 조사 대상자의 일반적인 특성
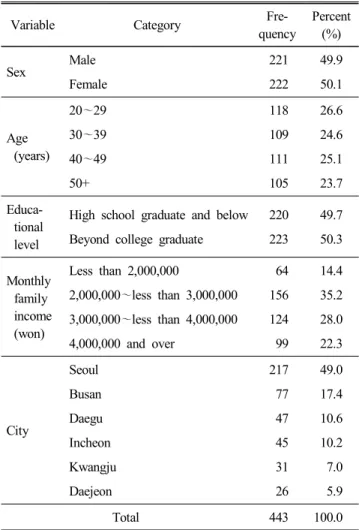
조사 대상자의 일반적인 특성은 Table 1과 같다. 본 연구 에서는 각 지역별 인구 비례 쿼터제를 적용하여 설문조사를 실시하였으므로, 도시별로 조사 대상자의 비율은 서울 49.0%,
부산 17.4%, 대구 10.6%, 인천 10.2%, 광주 7.0%, 대전 5.9%
이었다. 조사 대상자의 여성과 남성의 비율은 약 50%씩 차지 하였고, 연령은 20대(26.6%), 40대(25.1%), 30대(24.6%), 50대 이상(23.7%) 순이었다. 학력은 전문대학 졸업 이상이 50.3%, 고등학교 졸업 이하가 49.7%를 차지하였다. 그리고 월가계 소득은 200만원 이상~300만원 미만(35.2%), 300만원 이상~
400만원 미만(28.0%) 순이었다.
2. 일반적인 위해 요인에 대한 인식도
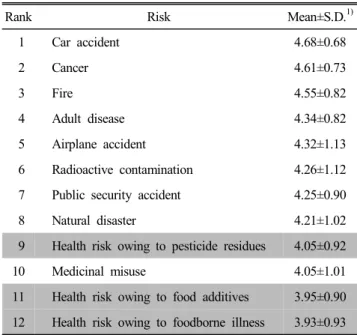
잔류 농약, 식품 첨가물, 식중독과 같은 식품 위해 요인에 대해 소비자들이 위험하다고 생각하는 정도가 어느 정도인 지를 파악하기 위하여 자동차 사고, 화재, 암 발생, 방사능 오염, 비행기 사고, 천재지변, 치안사고, 성인병, 약물 오용 및 남용과 같은 다른 위해 요인과 함께 질의한 결과, Table 2 와 같이 자동차 사고(4.68점), 암 발생(4.61점), 화재(4.55점), 성인병(4.34점) 순으로 평균값이 높게 나타났다. 한편, 식품과 관련된 위해 요인인 식중독으로 인한 건강상의 위해(3.93점), 식품 첨가물 섭취로 인한 건강상의 위해(3.95점), 식품 중 잔
Table 1. Characteristics of the respondents
Variable Category Fre-
quency
Percent (%)
Sex Male
Female
221 222
49.9 50.1
Age (years)
20 ~29 30 ~39 40 ~49 50+
118 109 111 105
26.6 24.6 25.1 23.7 Educa-
tional level
High school graduate and below Beyond college graduate
220 223
49.7 50.3
Monthly family income (won)
Less than 2,000,000
2,000,000 ~less than 3,000,000 3,000,000 ~less than 4,000,000 4,000,000 and over
64 156 124 99
14.4 35.2 28.0 22.3
City
Seoul Busan Daegu Incheon Kwangju Daejeon
217 77 47 45 31 26
49.0 17.4 10.6 10.2 7.0 5.9
Total 443 100.0
류 농약으로 인한 건강상의 위해(4.05점)에 대한 평균값은 다른 위해 요인보다 상대적으로 낮았다. 그러나 이들 식품과 관련된 위해 요인들도 평균값이 3.90점 이상으로 소비자들은 식품으로 인한 위해 역시 상당히 위험한 것으로 생각하고 있 는 것으로 나타났다. 이러한 소비자들의 우려도는 결국 소비 자들의 관심을 증가시키는 요인이 되므로 본 결과는 소비자 들이 식품의 위해나 안전성에 대해 관심이 많다는 것을 간접 적으로 시사해 주는 결과라고 할 수 있다.
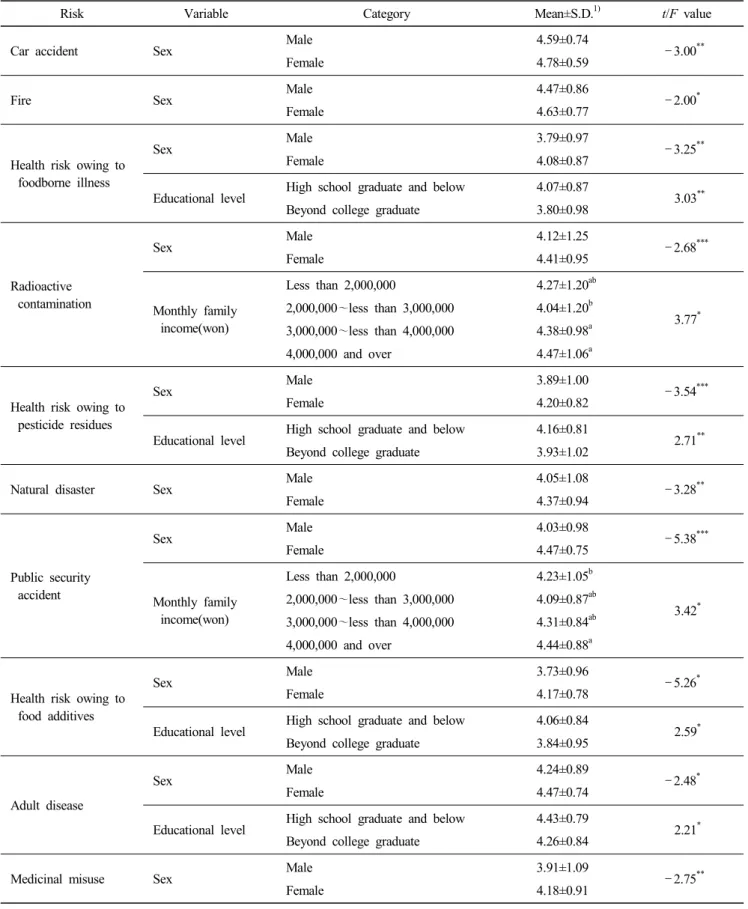
인구 통계학적 특성에 따른 위해 요인에 대한 인식도 차이 를 살펴보기 위하여 t 분석과 일원분산분석을 실시한 결과, Table 3과 같이 자동차 사고, 화재, 식중독으로 인한 건강상 의 위해, 방사능 오염, 식품 중 잔류 농약으로 인한 건강상의 위해, 천재지변, 치안 사고, 식품 첨가물 섭취로 인한 건강상 의 위해, 성인병, 약물 오용 및 남용에 대해 느끼는 위험 정 도는 성별에 따라 차이를 보이고 있는데, 남성에 비해 여성 의 경우 평균값이 높게 나타나서 남성보다 여성들이 이들 요 인에 대해 더 위험하게 생각하는 것으로 나타났다. 또한 식 중독으로 인한 건강상의 위해, 식품 중 잔류 농약으로 인한 건강상의 위해, 식품 첨가물 섭취로 인한 건강상의 위해, 성 인병에 대해 느끼는 위해 정도는 학력에 따라 통계적으로 유 의한 차이를 보이고 있어 고졸 이하의 경우 전문대졸 이상 집단에 비해 이들에 대해 더 위험하다고 생각하는 것으로 나 타났다. 그리고 월가계 소득이 400만원 미만인 집단에 비해 400만원 이상인 집단은 방사능 오염과 치안 사고에 대해 느끼 는 위험 정도가 통계적으로 유의하게 높은 것으로 나타났다.
Table 2. Risk awareness of the respondents
Rank Risk Mean±S.D.
1)1 Car accident 4.68±0.68
2 Cancer 4.61±0.73
3 Fire 4.55±0.82
4 Adult disease 4.34±0.82
5 Airplane accident 4.32±1.13
6 Radioactive contamination 4.26±1.12 7 Public security accident 4.25±0.90
8 Natural disaster 4.21±1.02
9 Health risk owing to pesticide residues 4.05±0.92
10 Medicinal misuse 4.05±1.01
11 Health risk owing to food additives 3.95±0.90 12 Health risk owing to foodborne illness 3.93±0.93
1)
Rated with a 5-point Likert scale: 1=Rarely, 5=Highly.
Shaded items are related to foods.
3. 식품 구매 시 관심 갖는 요소 1) 채소․과일류
응답자가 채소․과일을 구매할 때 가장 관심을 가지는 것 이 무엇인지에 대해 6개 항목 중 순서대로 3개를 순서대로 기재하라고 한 후, 각 항목에 가중치를 1순위 3점, 2순위 2 점, 3순위 1점으로 부여하여 살펴본 결과, Table 4와 같이 외 관, 맛, 가격, 유통기한, 원산지, 판매점 순으로 관심을 가지 고 있는 것으로 나타났다. 이는 소비자들이 채소나 과일을 구입할 때 외관을 통해 신선도를 식별하기 때문인 것으로 보 인다. 이런 결과는 Choe et al(2005)의 연구에서 농축산물 구 매 시 원산지, 유통기한, 무농약과 유기 재배, 신선함 순으로 나타난 것과 Lee HY(1997)의 연구에서 농산물을 구입할 때 원산지를 확인한 후 구입한다는 비율이 78.9%로 나타난 것과 는 다소 차이를 보이고 있다.
2) 축산물
Table 4에 의하면 축산물 구매 시 가장 관심을 갖는 요소 는 원산지로 나타났으며, 그 다음으로는 유통기한(포장 제품 의 경우), 가격 순으로 관심을 갖는 것으로 나타났다. 원산지 에 대한 관심도가 높게 나타난 것은 최근 광우병, 조류독감 등의 사건으로 인해 수입산 축산물의 안전성에 대한 우려가 높아져 소비자들이 축산물을 구입할 때 국내산과 수입산을 구별하고자 하는 태도를 반영하고 있는 것으로 보인다. 또한 신선한 축산물을 구입하기 위해서 포장육의 경우 유통기한 에 관심을 가지고 확인하는 것으로 보인다.
3) 수산물
수산물을 구매할 때 관심을 갖는 요소에 대해 질의한 결 과, 외관, 유통기한(포장 제품의 경우), 원산지 순으로 관심도 가 높은 것으로 나타났다. 이러한 결과는 채소, 과일류와 마 찬가지로 소비자들이 수산물을 구매할 때 신선도를 중요시 여기며, 주로 외관과 유통기한을 통해 신선한 정도를 쉽게 확인할 수 있기 때문인 것으로 생각된다.
4. 식품별 식품 구매 및 섭취 시 건강상 피해에 대한 우려도
1) 식품별 식중독 발생으로 인한 건강상의 피해 우려도
식중독 발생으로 인한 건강상의 피해 우려도를 식품별로
살펴보면 Table 5와 같이 수입산 수산물(4.36점), 수입산 축
산물(4.33점), 수입산 유제품(3.99점), 국내산 수산물(3.90점)
및 수입산 훈연제품류(3.90점) 순으로 평균값이 높았다. 반
면, 국내산 차류(2.07점)나 주류(2.13점)에 대한 피해 우려도
는 다른 항목에 비해 낮은 평균값을 나타내었다.
Table 3. Risk awareness according to the respondent's sociodemographic characteristics
Risk Variable Category Mean±S.D.
1)t/F value
Car accident Sex Male
Female
4.59±0.74
4.78±0.59 -3.00
**Fire Sex Male
Female
4.47±0.86
4.63±0.77 -2.00
*Health risk owing to foodborne illness
Sex Male
Female
3.79±0.97
4.08±0.87 -3.25
**Educational level High school graduate and below Beyond college graduate
4.07±0.87
3.80±0.98 3.03
**Radioactive contamination
Sex Male
Female
4.12±1.25
4.41±0.95 -2.68
***Monthly family income(won)
Less than 2,000,000
2,000,000 ~less than 3,000,000 3,000,000 ~less than 4,000,000 4,000,000 and over
4.27±1.20
ab4.04±1.20
b4.38±0.98
a4.47±1.06
a3.77
*Health risk owing to pesticide residues
Sex Male
Female
3.89±1.00
4.20±0.82 -3.54
***Educational level High school graduate and below Beyond college graduate
4.16±0.81
3.93±1.02 2.71
**Natural disaster Sex Male
Female
4.05±1.08
4.37±0.94 -3.28
**Public security accident
Sex Male
Female
4.03±0.98
4.47±0.75 -5.38
***Monthly family income(won)
Less than 2,000,000
2,000,000 ~less than 3,000,000 3,000,000 ~less than 4,000,000 4,000,000 and over
4.23±1.05
b4.09±0.87
ab4.31±0.84
ab4.44±0.88
a3.42
*Health risk owing to food additives
Sex Male
Female
3.73±0.96
4.17±0.78 -5.26
*Educational level High school graduate and below Beyond college graduate
4.06±0.84
3.84±0.95 2.59
*Adult disease
Sex Male
Female
4.24±0.89
4.47±0.74 -2.48
*Educational level High school graduate and below Beyond college graduate
4.43±0.79
4.26±0.84 2.21
*Medicinal misuse Sex Male
Female
3.91±1.09
4.18±0.91 -2.75
***
p<0.05,
**p<0.01,
***p<0.001:
a,bShows the results of Duncan's multiple range test.
1)
Rated with a 5-point scale: 1=Rarely, 5=Highly.
Table 4. Factors considered on purchasing foods
Rank Vegetables and fruits Meat Seafood
1 Appearance(Color, size, etc.) Place of origin Appearance(Color, size, etc.)
2 Taste Expiration date Expiration date
3 Price Price Place of origin
4 Expiration date Taste Price
5 Place of origin Appearance(Color, size, etc.) Taste
6 Store(Department store, traditional market, large discount store, etc.)
Store(Department store, traditional market, large discount store, etc.)
Store(Department store, traditional market, large discount store, etc.)
Table 5. Concerns about human health owing to foodborne illness according to food categories
Rank Risk Mean±S.D.
1)1 Imported seafood(crab, shrimp, eel, etc.) 4.36±0.84
2 Imported meat and poultry(beef, pork, chicken, etc.) 4.33±0.86
3 Imported dairy product 3.99±1.00
4 Domestic seafood(crab, shrimp, eel, etc.) 3.90±1.14
4 Imported smoked food(ham, sausage, bacon, etc.) 3.90±1.00
6 Domestic meat and poultry(beef, pork, chicken, etc.) 3.79±1.15
7 Imported frozen food 3.78±1.05
8 Domestic instant food(kimbab, tteokbokki, etc.) 3.67±1.11
9 Domestic dairy product 3.65±1.11
10 Fast food(hamburger, fried chicken, pizza, etc.) 3.59±1.09
11 Imported canned food 3.51±1.10
12 Imported breads and cookies 3.49±1.11
13 Domestic smoked food(ham, sausage, bacon, etc.) 3.48±1.07
14 Imported fruits(orange, grape, banana, etc.) 3.46±1.20
15 Domestic frozen food(frozen mandu, frozen pizza, etc.) 3.44±1.10
16 Imported kimchi 3.35±1.16
17 Imported vegetables(onion, red pepper, etc.) 3.33±1.16
18 Imported ice candy 3.25±1.15
19 Tap water 3.22±1.21
20 Imported fermented sauce(Japanese soy sauce, Japanese soy paste, etc.) 3.11±1.14
21 Domestic breads and cookies 3.05±1.14
22 Domestic canned food 3.02±1.14
23 Imported cereal and legume(rice, barley, bean, etc.) 3.01±1.25
24 Imported tea(coffee beans, chinese tea, etc.) 2.87±1.16
25 Domestic ice candy 2.76±1.19
26 Natural water 2.74±1.20
27 Domestic fruit(orange, grape, banana, etc.) 2.62±1.15
28 Domestic vegetables(onion, red pepper, etc.) 2.58±1.15
29 Beverage(cola, soda pop, juice, etc.) 2.49±1.20
30 Fermented sauce(soy sauce, soy paste, kochujang, etc.) 2.35±1.09
31 Domestic processed grains(sunsik, misugaru, etc.) 2.33±1.04
32 Domestic kimchi 2.22±1.10
33 Domestic cereal and legume(rice, barley, bean, etc.) 2.21±1.09
34 Liquors 2.13±1.11
35 Domestic tea(coffee, green tea, etc.) 2.07±1.05
1)
Rated with a 5-point scale: 1=Rarely, 5=Highly.
Shaded items mean imported foods.
실제로 우리나라의 세균성 식중독 발생 현황을 살펴보면 어패류와 육류에 의한 식중독 발생이 가장 높게 나타나고 있 는데(http://www.kfda.go.kr/fm/index.do?nMenuCode=74) 소비 자들이 축산물이나 수산물에 대해 식중독 발생을 더 많이 우 려하는 것은 현재 이러한 우리나라에서의 식품별 식중독 사 고의 발생 유형과 연관이 있는 것으로 보인다.
한편 국내산 곡류 및 두류, 국내산 채소류, 국내산 과일류, 국내산 축산물, 국내산 수산물, 국내산 아이스크림 제품류,
Table 6. Concerns about human health owing to foodborne illness according to the respondent's sociodemographic characteristics
Food category Variable Category Mean±S.D.
1)t/F value
Domestic foods
Cereal and legume(rice,
barley, bean, etc.) Sex Male Female
2.06±0.99
2.35±1.16 -2.80
**Vegetables(onion, red
pepper, etc.) Sex Male
Female
2.41±1.06
2.76±1.20 -3.24
**Fruits(orange, grape,
banana, etc.) Sex Male
Female
2.44±1.10
2.80±1.18 -3.28
**Meat and poultry(beef,
pork, chicken, etc.) Sex Male Female
3.59±1.15
3.98±1.12 -3.62
***Seafood(crab, shrimp,
eel, etc.) Sex Male
Female
3.78±1.16
4.02±1.11 -2.18
*Ice candy Sex Male
Female
2.62±1.15
2.90±1.21 -2.47
*Instant food(kimbab, tteokbokki, etc.)
Sex Male
Female
3.54±1.14
3.80±1.05 -2.48
*Monthly family income (won)
Less than 2,000,000
2,000,000 ~less than 3,000,000 3,000,000 ~less than 4,000,000 4,000,000 and over
3.25±1.21
b3.77±1.01
a3.62±1.21
a3.84±0.98
a4.47
*Fermented sauce(soy sauce, soy paste, kochujang, etc.)
Monthly family income (won)
Less than 2,000,000
2,000,000 ~less than 3,000,000 3,000,000 ~less than 4,000,000 4,000,000 and over
2.09±1.11
b2.27±0.98
b2.32±1.07
b2.69±1.19
a4.78
**Canned food Sex Male
Female
2.86±1.12
3.18±1.14 -2.99
**Frozen food(frozen man-
du, frozen pizza, etc.) Sex Male Female
3.29±1.10
3.59±1.09 -2.85
**Smoked food(ham, sau-
sage, bacon, etc.) Sex Male
Female
3.33±1.04
3.62±1.08 -2.80
**Imported foods
Cereal and legume(rice,
barley, bean, etc.) Sex Male Female
2.86±1.25
3.17±1.25 -2.59
*Vegetables(onion, red pepper, etc.)
Age (years)
20 ~29 30 ~39 40 ~49 50+
3.03±1.10
b3.29±1.17
ab3.55±1.01
a3.47±1.23
a4.63
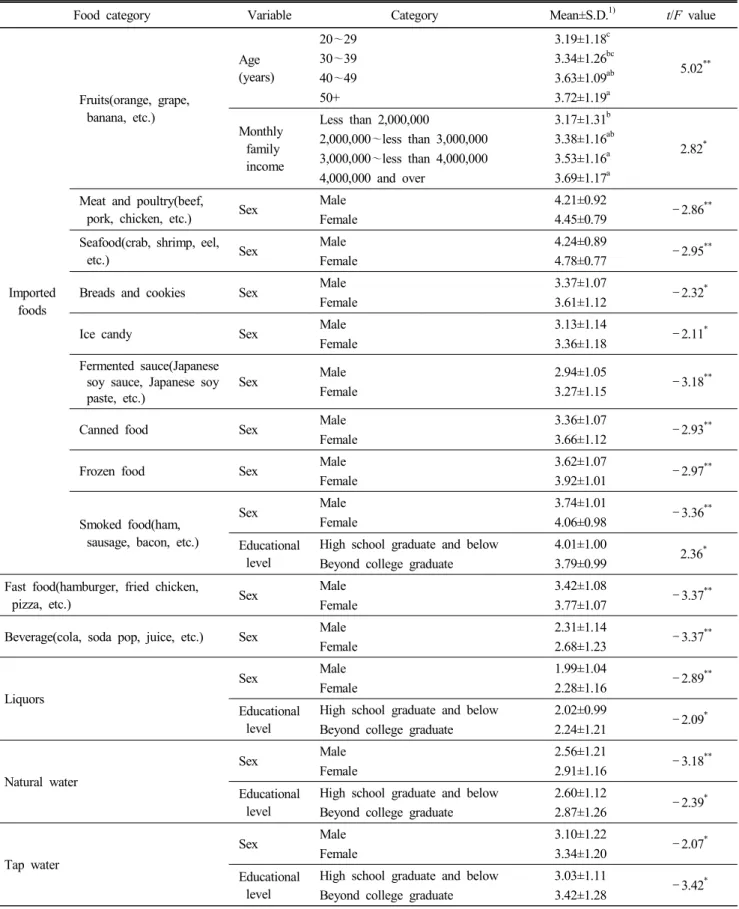
**국내산 즉석식품류, 국내산 통조림류, 국내산 냉동식품류, 국
내산 훈연제품류, 수입산 곡류 및 두류, 수입산 축산물, 수입
산 수산물, 수입산 빵, 과자류, 수입산 아이스크림 제품류, 수
입산 장류, 수입산 통조림류, 수입산 냉동식품류, 수입산 훈
연제품류, 패스트푸드, 음료수, 주류, 생수, 수돗물에 의한 식
중독에 대한 우려도는 남성에 비해 여성의 경우 높은 것으로
나타났다(Table 6). 그리고 수입산 채소류, 수입산 과일류에
대해서는 연령이 50세 이상인 경우 식중독에 대한 우려도가
Table 6. Continued
Food category Variable Category Mean±S.D.
1)t/F value
Imported foods
Fruits(orange, grape, banana, etc.)
Age (years)
20 ~29 30 ~39 40 ~49 50+
3.19±1.18
c3.34±1.26
bc3.63±1.09
ab3.72±1.19
a5.02
**Monthly family income
Less than 2,000,000
2,000,000 ~less than 3,000,000 3,000,000 ~less than 4,000,000 4,000,000 and over
3.17±1.31
b3.38±1.16
ab3.53±1.16
a3.69±1.17
a2.82
*Meat and poultry(beef,
pork, chicken, etc.) Sex Male Female
4.21±0.92
4.45±0.79 -2.86
**Seafood(crab, shrimp, eel,
etc.) Sex Male
Female
4.24±0.89
4.78±0.77 -2.95
**Breads and cookies Sex Male
Female
3.37±1.07
3.61±1.12 -2.32
*Ice candy Sex Male
Female
3.13±1.14
3.36±1.18 -2.11
*Fermented sauce(Japanese soy sauce, Japanese soy paste, etc.)
Sex Male
Female
2.94±1.05
3.27±1.15 -3.18
**Canned food Sex Male
Female
3.36±1.07
3.66±1.12 -2.93
**Frozen food Sex Male
Female
3.62±1.07
3.92±1.01 -2.97
**Smoked food(ham, sausage, bacon, etc.)
Sex Male
Female
3.74±1.01
4.06±0.98 -3.36
**Educational level
High school graduate and below Beyond college graduate
4.01±1.00
3.79±0.99 2.36
*Fast food(hamburger, fried chicken,
pizza, etc.) Sex Male
Female
3.42±1.08
3.77±1.07 -3.37
**Beverage(cola, soda pop, juice, etc.) Sex Male Female
2.31±1.14
2.68±1.23 -3.37
**Liquors
Sex Male
Female
1.99±1.04
2.28±1.16 -2.89
**Educational level
High school graduate and below Beyond college graduate
2.02±0.99
2.24±1.21 -2.09
*Natural water
Sex Male
Female
2.56±1.21
2.91±1.16 -3.18
**Educational level
High school graduate and below Beyond college graduate
2.60±1.12
2.87±1.26 -2.39
*Tap water
Sex Male
Female
3.10±1.22
3.34±1.20 -2.07
*Educational level
High school graduate and below Beyond college graduate
3.03±1.11
3.42±1.28 -3.42
**
p<0.05,
**p<0.01,
***p<0.001 :
a~cshows the results of Duncan's multiple range test.
1)
Rated with a 5-point scale: 1=Rarely, 5=Highly.
높았고, 20대인 경우 가장 적은 우려를 하고 있는 것으로 나 타났다. 그리고 국내산 즉석식품류는 월가계 소득이 200만원 이상인 경우, 국내산 장류는 월가계 소득이 400만원 이상인 경우, 그리고 수입산 과일류는 월가계 소득이 300만원 이상 인 경우 가장 많은 우려를 하고 있었다. 교육 수준에 따라서 는 수입산 훈연제품류의 경우에는 전문대졸 이상에 비해 고 졸 이하, 그리고 주류, 생수, 수돗물에 대해서는 고졸 이하에 비해 전문대졸 이상의 경우 식중독 우려 정도가 높은 것으로 나타났다.
2) 식품별 잔류 농약으로 인한 건강상의 피해 우려도 식품별 잔류 농약으로 인한 건강상의 피해에 대한 우려도
Table 7. Concerns about human health owing to pesticide residues according to food categories
Rank Risk Mean±S.D.
1)1 Imported fruits(orange, grape, banana, etc.) 4.29±0.92
2 Imported vegetables(onion, red pepper, etc.) 4.14±0.98
3 Imported meat and poultry(beef, pork, chicken, etc.) 3.95±1.13
4 Imported seafood(crab, shrimp, eel, etc.) 3.89±1.16
5 Domestic fruits(orange, grape, banana, etc.) 3.78±1.04
6 Domestic vegetables(onion, red pepper, etc.) 3.71±1.03
6 Imported cereal and legume(rice, barley, bean, etc.) 3.71±1.14
8 Imported dairy product(powdered milk, cheese, etc.) 3.56±1.19
8 Imported kimchi 3.56±1.14
10 Imported smoked food(ham, sausage, bacon, etc.) 3.46±1.15
11 Imported canned food 3.31±1.15
12 Imported breads and cookies 3.30±1.12
13 Domestic meat and poultry(beef, pork, chicken, etc.) 3.24±1.20
14 Domestic seafood(crab, shrimp, eel, etc.) 3.17±1.18
15 Imported tea(coffee beans, chinese tea, etc.) 3.16±1.24
16 Domestic cereal and legume(rice, barley, bean, etc.) 3.12±1.06
16 Imported fermented sauce(Japanese soy sauce, Japanese soy paste, etc.) 3.12±1.09 18 Domestic milk and dairy product(milk, yogurt, cheese, etc.) 2.99±1.12
19 Domestic canned food 2.84±1.07
20 Domestic breads and cookies 2.80±1.12
21 Domestic processed grains(sunsik, misugaru, etc.) 2.71±1.06
22 Domestic kimchi 2.64±1.14
23 Domestic fermented sauce(soy sauce, soy paste, kochujang, etc.) 2.49±1.01
24 Domestic tea(green tea, instance coffee, etc.) 2.45±1.08
1)
Rated with a 5-point scale: 1=Rarely, 5=Highly.
Shaded items mean imported foods.
를 살펴보면 Table 7과 같이 수입산 과일류(4.29점)에 대한 평균값이 가장 높았고, 그 다음으로는 수입산 채소류(4.14 점), 수입산 축산물(3.95점), 수입산 수산물(3.89점), 국내산 과일류(3.78점), 국내산 채소류(3.71점), 수입산 곡류 및 두류 (3.71점) 순이었다. 한편, 국내산 차류(2.45점), 국내산 장류 (2.49점), 국내산 김치류(2.64점)는 다른 식품에 비해 잔류 농 약으로 인한 건강상의 피해에 대한 우려도는 낮은 것으로 나 타났다.
본 연구에서 수입산 과일류 및 수입산 채소류에 대한 잔 류 농약의 건강상 피해 우려도가 높게 나타난 것은 Kim &
Kim(2001)의 연구에서 잔류 농약에서 가장 우려되는 식품이
채소 61.1%, 과일 34.9%로 나타났고, 또한 응답자의 74.0%가
국산 식품보다는 수입 식품에 잔류 농약이 더 많을 것으로 생각하는 것으로 나타난 결과와 부합하는 것이다. 부산 지역 의 주부들을 대상으로 한 Kim JE(2009)의 연구에서 수입농 산물 및 식품은 가격이나 맛, 영양에 비해 안전도가 가장 좋 지 않다고 생각하는 것으로 나타났고, 학교 영양사를 대상으 로 한 Kim MH(2008)의 연구에서도 수입 식재료는 신선도, 기호도, 영양, 맛에 비해 안전성에 대한 인식이 가장 좋지 않 은 것으로 나타났다. 또한 서울 및 경기지역 주부들의 식품 안전에 대한 인식 및 우려도를 살펴본 Lee & Kim(2009)의 연구에서는 국내산이 수입산보다 더 안전하다고 생각하는 비율이 높게 나타났다. 따라서 본 연구 결과 및 선행 연구 결 과들을 통해서 볼 때 소비자들은 수입식품의 안전성을 우려 하고 있으며 또한, 잔류 농약에 대한 우려도가 매우 높은 것 으로 파악되었다.
일반적으로 국내산에 비해 수입산에 대한 잔류 농약 우려 도가 높은 것은 식품이 우리나라로 수입되는 시간이 길어 변 질을 방지하기 위하여 과다한 농약을 처리하는 과정에서 농 약이 잔류하게 된다는 것을 소비자가 인식하고 있기 때문인 것으로 사료된다. 또한, 국내산 중 과일 및 채소류에 대한 잔 류 농약의 우려 정도가 높은 것은 이들 식품에 대한 잔류 농 약이 기준치를 초과한다는 보도를 소비자들이 대중매체를 통해 빈번히 접하고 있기 때문인 것으로 생각된다. 그러나 과일과 채소류에서는 수입산뿐만 아니라 국내산의 경우에도 잔류 농약에 대한 우려도가 높게 나타나고 있으므로 소비자 들이 갖는 막연한 불안감을 해소시키기 위해서는 이들 식품 의 잔류 농약에 대한 정기적인 모니터링과 함께 이 결과를 소비자들이 잘 알 수 있도록 정보를 제공해 주는 것이 필요 한 것으로 보인다.
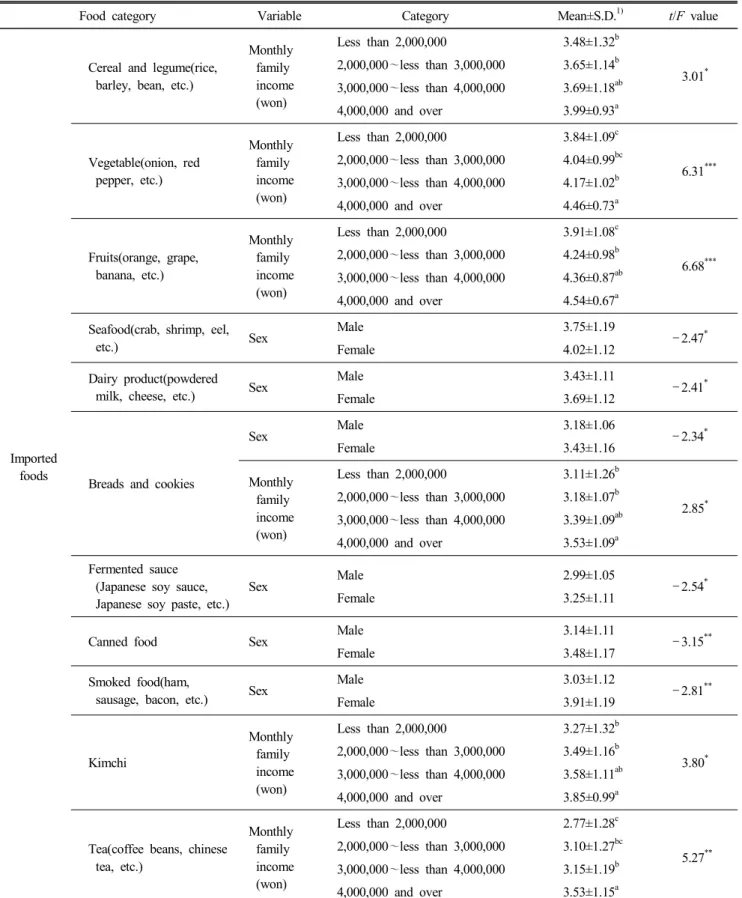
Table 8에 제시된 바와 같이 조사대상자의 성별에 따라 식 품별 잔류 농약에 대한 우려도에 차이가 있었는데, 국내산 곡류 및 두류, 국내산 채소류, 국내산 과일류, 국내산 축산물, 국내산 수산물, 국내산 유제품, 국내산 통조림류, 수입산 수 산물, 수입산 유제품, 수입산 빵, 과자류, 수입산 장류, 수입 산 통조림류, 수입산 훈연제품류는 남성에 비해 여성의 경우 잔류 농약에 대한 우려도가 높았다. 그리고 국내산 장류에 대해서는 20대와 40대에 비해 30대의 응답자들이 잔류 농약 에 대해 우려하는 정도가 높았고, 국내산 차류에 대해서는 고등학교 졸업의 응답자에 비해 전문대졸 이상의 응답자들 이 잔류 농약에 대한 우려 정도가 높은 것으로 나타났다. 한 편, 국내산 채소류, 국내산 과일류, 국내산 곡류가공품, 국내 산 차류는 월가계 소득이 300만원 이상인 경우, 그리고 수입 산 곡류 및 두류, 수입산 채소류, 수입산 과일류, 수입산 빵, 과자류, 수입산 김치류, 수입산 차류에 대해서는 월가계 소 득이 400만원 이상인 경우 잔류 농약에 대한 우려도가 높은 것으로 나타났다.
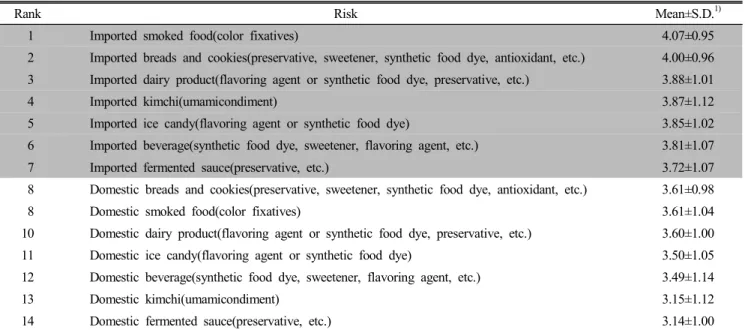
3) 식품별 식품 첨가물로 인한 건강상의 피해 우려도 Table 9에 제시된 바와 같이 식품 첨가물로 인한 건강상의 피해 우려도가 가장 높은 식품은 수입산 훈연제품류(4.07점) 이었으며, 그 다음으로는 수입산 빵, 과자류(4.00점), 수입산 유제품류(3.88점), 수입산 김치류(3.87점) 순이었다. 이러한 결과는 훈연제품류의 경우 아질산나트륨과 같은 첨가물이 니트로소아민을 형성하여 발암물질로 작용한다는 사실이 대중매체를 통해 자주 보도되었고(http://www.hankyung.com/
news/app/newsview.php?aid=2007100841201), 빵, 과자류에는 방부제가 첨가되어 인체에 해롭다고 생각하고 있기 때문인 것으로 사료된다. 그러나 식품의약품안전청에서는 2006년 9 월부터 인위적으로 식품 첨가물을 첨가한 식품의 경우 식품 첨가물의 주용도와 명칭을 표시하도록 하고 있어(http://
economy.hankooki.com/lpage/news/200603/e20060313163753 70300.htm) 과거에 비해 소비자들이 섭취하는 식품에 함유 된 식품 첨가물에 대한 더 많은 정보를 제공받을 수 있을 것 으로 기대된다.
국내․외 모든 식품류에 대해 남성에 비해 여성의 경우, 식품 첨가물에 대한 우려 정도가 높았고, 수입산 훈연제품류 에 대해서는 전문대졸 이상 졸업자에 비해 고등학교 졸업 응 답자의 경우 식품 첨가물에 대한 우려 정도가 높은 것으로 나타났다(Table 10). 그리고 국내산 빵, 과자류, 국내산 아이 스크림 제품류, 국내산 장류, 국내산 김치류, 국내산 음료수 류, 수입산 유제품, 수입산 아이스크림 제품류, 수입산 장류, 수입산 김치류는 월가계 소득이 400만원 이상인 경우 식품 첨가물에 대한 우려도가 큰 것으로 나타났다.
5. 식품 안전성 확보를 위한 주체별 현재 역할 수행 정 도에 관한 인식도
식품 안전성 확보를 위해 정부, 생산자, 소비자 등 관련 주 체가 현재 어느 정도 역할 수행을 하고 있다고 생각하는지 질의한 결과, Table 11과 같이 ‘소비자단체의 교육 및 홍보 (3.50점)’, ‘소비자 스스로의 의식 및 행동(3.46점)’ 및 ‘언론 기관의 정확한 보도와 정보 제공(3.46점)’ 순으로 나타났다.
한편, ‘판매업자의 양심적인 행위(2.71점)’, ‘유통업자의 유통
법규 준수(2.73점)’, ‘제조 및 가공업자의 제조 관련 법규 준
수(2.74점)’에 대해서는 다른 항목에 비해 낮은 평균값을 보
이고 있어 많은 응답자들은 식품을 판매, 유통하거나 제조하
는 사람들이 식품 안전성 확보를 위한 역할을 잘 수행하지
못하는 것으로 인식하고 있었다. Bahk 등(1999)의 연구에 의
하면 식품 안전성 미확보에 대한 책임으로 식품가공업자의
책임이 48.7%, 식품유통업자의 책임이 28.0%로, 본 연구 결
과와 유사하게 나타나, 식품 안전성 확보에 있어 제조, 가공,
유통업자에 대한 소비자들의 불신이 높았다.
Table 8. Concerns about human health owing to pesticide residues according to the respondent's sociodemographic cha- racteristics
Food category Variable Category Mean±S.D.
1)t/F value
Domestic foods
Cereal and legume(rice,
barley, bean, etc.) Sex Male
Female
3.02±1.05
3.22±1.06 -1.98
*Vegetables(onion, red pepper, etc.)
Sex Male
Female
3.57±1.08
3.84±0.96 -2.71
**Monthly family income (won)
Less than 2,000,000
2,000,000 ~less than 3,000,000 3,000,000 ~less than 4,000,000 4,000,000 and over
3.47±1.19
b3.60±1.05
ab3.81±0.99
a3.90±0.90
a3.27
*Fruits(orange, grape, banana, etc.)
Sex Male
Female
3.65±1.09
3.91±0.97 -2.68
**Monthly family income (won)
Less than 2,000,000
2,000,000 ~less than 3,000,000 3,000,000 ~less than 4,000,000 4,000,000 and over
3.44±1.18
b3.69±1.09
ab3.92±0.98
a3.97±0.86
a4.71
**Meat and poultry(beef,
pork, chicken, etc.) Sex Male
Female
3.08±1.18
3.40±1.20 -2.82
**Seafood(crab, shrimp, eel,
etc.) Sex Male
Female
3.03±1.16
3.32±1.19 -2.54
*Milk and dairy
product(milk, yogurt, cheese, etc.)
Sex Male
Female
2.86±1.07
3.12±1.14 -2.49
*Fermented sauce(soy sauce, soy paste, kochujang, etc.)
Age (years)
20 ~29 30 ~39 40 ~49 50+
2.37±1.02
b2.67±1.06
a2.33±0.90
b2.60±1.05
ab2.99
*Canned food Sex Male
Female
2.69±1.01
2.99±1.12 -2.95
**Processed grains(sunsik, misugaru, etc.)
Monthly family income (won)
Less than 2,000,000
2,000,000 ~less than 3,000,000 3,000,000 ~less than 4,000,000 4,000,000 and over
2.38±1.18
b2.66±1.04
ab2.81±1.03
a2.91±1.03
a3.82
*Kimchi
Monthly family income (won)
Less than 2,000,000
2,000,000 ~less than 3,000,000 3,000,000 ~less than 4,000,000 4,000,000 and over
2.19±1.15
b2.63±1.11
a2.66±1.12
a2.93±1.10
a5.73
**Tea(green tea, instance coffee, etc.)
Educational level
High school graduate and below Beyond college graduate
2.32±1.01
2.58±1.12 -2.52
*Monthly
family income (won)
Less than 2,000,000
2,000,000 ~less than 3,000,000 3,000,000 ~less than 4,000,000 4,000,000 and over
2.00±1.01
b2.46±1.02
a2.49±1.13
a2.68±1.06
a5.42
**Table 8. Continued
Food category Variable Category Mean±S.D.
1)t/F value
Imported foods
Cereal and legume(rice, barley, bean, etc.)
Monthly family income (won)
Less than 2,000,000
2,000,000 ~less than 3,000,000 3,000,000 ~less than 4,000,000 4,000,000 and over
3.48±1.32
b3.65±1.14
b3.69±1.18
ab3.99±0.93
a3.01
*Vegetable(onion, red pepper, etc.)
Monthly family income (won)
Less than 2,000,000
2,000,000 ~less than 3,000,000 3,000,000 ~less than 4,000,000 4,000,000 and over
3.84±1.09
c4.04±0.99
bc4.17±1.02
b4.46±0.73
a6.31
***Fruits(orange, grape, banana, etc.)
Monthly family income (won)
Less than 2,000,000
2,000,000 ~less than 3,000,000 3,000,000 ~less than 4,000,000 4,000,000 and over
3.91±1.08
c4.24±0.98
b4.36±0.87
ab4.54±0.67
a6.68
***Seafood(crab, shrimp, eel,
etc.) Sex Male
Female
3.75±1.19
4.02±1.12 -2.47
*Dairy product(powdered
milk, cheese, etc.) Sex Male
Female
3.43±1.11
3.69±1.12 -2.41
*Breads and cookies
Sex Male
Female
3.18±1.06
3.43±1.16 -2.34
*Monthly
family income (won)
Less than 2,000,000
2,000,000 ~less than 3,000,000 3,000,000 ~less than 4,000,000 4,000,000 and over
3.11±1.26
b3.18±1.07
b3.39±1.09
ab3.53±1.09
a2.85
*Fermented sauce (Japanese soy sauce, Japanese soy paste, etc.)
Sex Male
Female
2.99±1.05
3.25±1.11 -2.54
*Canned food Sex Male
Female
3.14±1.11
3.48±1.17 -3.15
**Smoked food(ham,
sausage, bacon, etc.) Sex Male Female
3.03±1.12
3.91±1.19 -2.81
**Kimchi
Monthly family income (won)
Less than 2,000,000
2,000,000 ~less than 3,000,000 3,000,000 ~less than 4,000,000 4,000,000 and over
3.27±1.32
b3.49±1.16
b3.58±1.11
ab3.85±0.99
a3.80
*Tea(coffee beans, chinese tea, etc.)
Monthly family income (won)
Less than 2,000,000
2,000,000 ~less than 3,000,000 3,000,000 ~less than 4,000,000 4,000,000 and over
2.77±1.28
c3.10±1.27
bc3.15±1.19
b3.53±1.15
a5.27
***
p<0.05,
**p<0.01,
***p<0.001 :
a~cshows the results of Duncan's multiple range test.
1)
Rated with a 5-point scale: 1=Rarely, 5=Highly.
Table 9. Concerns about human health owing to food additives according to food categories
Rank Risk Mean±S.D.
1)1 Imported smoked food(color fixatives) 4.07±0.95
2 Imported breads and cookies(preservative, sweetener, synthetic food dye, antioxidant, etc.) 4.00±0.96 3 Imported dairy product(flavoring agent or synthetic food dye, preservative, etc.) 3.88±1.01
4 Imported kimchi(umamicondiment) 3.87±1.12
5 Imported ice candy(flavoring agent or synthetic food dye) 3.85±1.02
6 Imported beverage(synthetic food dye, sweetener, flavoring agent, etc.) 3.81±1.07
7 Imported fermented sauce(preservative, etc.) 3.72±1.07
8 Domestic breads and cookies(preservative, sweetener, synthetic food dye, antioxidant, etc.) 3.61±0.98
8 Domestic smoked food(color fixatives) 3.61±1.04
10 Domestic dairy product(flavoring agent or synthetic food dye, preservative, etc.) 3.60±1.00
11 Domestic ice candy(flavoring agent or synthetic food dye) 3.50±1.05
12 Domestic beverage(synthetic food dye, sweetener, flavoring agent, etc.) 3.49±1.14
13 Domestic kimchi(umamicondiment) 3.15±1.12
14 Domestic fermented sauce(preservative, etc.) 3.14±1.00
1)
Rated with a 5-point scale: 1=Rarely, 5=Highly.
Shaded items mean imported foods.
Table 10. Concerns about human health owing to food additives according to the respondent's sociodemographic charac- teristics
Food category Variable Category Mean±S.D.
1)t/F value
Domestic foods
Dairy product(flavoring agent or synthetic food dye, preservative, etc.)
Sex Male
Female
3.41±1.03
3.79±0.93 -4.08
***Breads and cookies (preservative, sweetener, synthetic food dye, antioxidant, etc.)
Sex Male
Female
3.47±0.97
3.75±0.98 -3.09
**Monthly family income (won)
Less than 2,000,000
2,000,000 ~less than 3,000,000 3,000,000 ~less than 4,000,000 4,000,000 and over
3.45±1.05
b3.51±0.99
b3.60±1.01
b3.88±0.85
a3.59
*Ice candy(flavoring agent or synthetic food dye)
Sex Male
Female
3.32±1.07
3.69±0.99 -3.80
***Monthly family income (won)
Less than 2,000,000
2,000,000 ~less than 3,000,000 3,000,000 ~less than 4,000,000 4,000,000 and over
3.34±1.10
b3.44±1.05
b3.45±1.07
b3.77±0.93
a2.91
*Fermented sauce (preservative, etc.)
Sex Male
Female
2.97±1.07
3.31±1.09 -3.27
**Monthly family income (won)
Less than 2,000,000
2,000,000 ~less than 3,000,000 3,000,000 ~less than 4,000,000 4,000,000 and over
3.00±1.08
b3.05±1.13
b3.04±1.10
b3.51±0.97
a4.78
**Smoked food(color
fixatives) Sex Male
Female
3.47±1.05
3.74±1.00 -2.79
**Table 10. Continued
Food category Variable Category Mean±S.D.
1)t/F value
Kimchi(umamicondiment)
Sex Male
Female
3.00±1.12
3.30±1.11 -2.85
**Monthly family income (won)
Less than 2,000,000
2,000,000 ~less than 3,000,000 3,000,000 ~less than 4,000,000 4,000,000 and over
2.84±1.09
b3.06±1.11
b3.14±1.13
b3.49±1.08
a5.12
**Beverage(synthetic food dye, sweetener, flavoring agent, etc.)
Sex Male
Female
3.26±1.17
3.73±1.07 -4.44
***Monthly family income (won)
Less than 2,000,000
2,000,000 ~less than 3,000,000 3,000,000 ~less than 4,000,000 4,000,000 and over
3.31±1.11
b3.43±1.15
b3.45±1.20
ab3.77±1.04
a2.69
*Imported food
Dairy product(flavoring agent or synthetic food dye,
preservative, etc.)
Sex Male
Female
3.66±1.02
4.10±0.95 -4.73
***Monthly family income (won)
Less than 2,000,000
2,000,000 ~less than 3,000,000 3,000,000 ~less than 4,000,000 4,000,000 and over
3.70±1.19
b3.77±1.02
ab3.92±0.99
ab4.13±0.83
a3.45
*Breads and cookies(preser- vative, sweetener, synthetic food dye, antioxidant, etc.)
Sex Male
Female
3.83±0.93
4.18±0.96 -3.83
***Ice candy(flavoring agent or synthetic food dye)
Sex Male
Female
3.65±1.06
4.06±0.94 -4.33
***Monthly family income (won)
Less than 2,000,000
2,000,000 ~less than 3,000,000 3,000,000 ~less than 4,000,000 4,000,000 and over
3.69±1.15
b3.77±1.02
b3.77±1.05
b4.19±0.80
a4.94
**Fermented sauce(preservative, etc.)
Sex Male
Female
3.53±1.06
3.91±1.05 -3.83
***Monthly family income (won)
Less than 2,000,000
2,000,000 ~less than 3,000,000 3,000,000 ~less than 4,000,000 4,000,000 and over
3.56±1.26
b3.67±1.06
b3.65±1.07
b4.00±0.90
a3.04
*Smoked food(color fixatives)
Sex Male
Female
3.91±0.98
4.23±0.90 -3.75
***Educational level
High school graduate and below Beyond college graduate
4.18±0.93
3.96±0.96 2.52
*Kimchi(umamicondiment)
Sex Male
Female
3.74±1.12
3.99±1.11 -2.35
*Monthly
family income (won)
Less than 2,000,000
2,000,000 ~less than 3,000,000 3,000,000 ~less than 4,000,000 4,000,000 and over
3.63±1.35
b3.73±1.11
b3.87±1.07
b4.23±0.93
a5.43
**Beverage(synthetic food dye,
sweetener, flavoring agent, etc.) Sex Male Female
3.62±1.08
4.00±1.02 -3.89
****
p<0.05,
**p<0.01,
***p<0.001 :
a,bshows the results of Duncan's multiple range test.
1)
Rated with a 5-point scale: 1=Rarely, 5=Highly.
Table 11. Awareness about role implementation of each subject for ensuring food safety in the present
Rank Risk Mean±S.D.
1)1 Education and publicity by consumer organizations 3.50±1.00
2 Consumers' consciousness and behavior 3.46±1.00
2 Accurate news and information by mass media 3.46±0.97
4 Research for food safety by food research institutes and universities 3.33±0.96 5 Inspection of food materials and observance of enforcement regulations by dietitians and cooks 3.19±1.04 6 Information offer about food hazard by workers on health institutes 3.18±1.00
7 Reinforcement of regulations and management by government 3.11±1.10
8 Observance of enforcement regulations by producers(farmers, fishermen, dairy husbandmen, etc.) 3.01±1.10
9 Observance of regulations by manufacturers and processors 2.74±1.18
10 Observance of regulations by distributors 2.73±1.13
11 Sellers' conscientious behavior 2.71±1.14
1)
Rated with a 5-point scale: 1=Rarely, 5=Highly.
한편 식품 안전성 확보를 위한 주체별 현재 역할 수행 정 도에 관한 인식도를 인구 통계학적 특성에 따라 비교해 보면
‘생산자의 시행 수칙 준수’ 역할에 남성에 비해 여성의 경우 잘 수행하는 것으로 평가하고 있었으며, ‘생산자의 시행 수 칙 준수’, ‘정부기관의 법적 규제 및 관리 강화’ 역할에 대해 전문대졸 이상 응답자에 비해 고등학교 졸업 응답자의 경우 역할을 잘 수행하고 있는 것으로 인식하고 있었다(Table 12).
6. 미래 식품 안전성 확보를 위한 주체별 역할 중요성 에 대한 인식도
미래의 식품 안전성을 확보하기 위한 각 주체별 역할의 중요성에 대해 질의한 결과, 모든 문항에서 평균값이 4.4점을 상회하는 것으로 나타나서 응답자들이 미래 식품의 안전성 확보를 위해서는 식품 생산자, 정부, 소비자 모두의 주체별 역할을 모두 중요하게 여기고 있는 것으로 나타났다(Table 13). 특히 ‘생산자의 시행수칙 준수(4.70점)’ 및 ‘판매업자의
Table 12. Awareness about role implementation of each subject for ensuring food safety in the present according to the respondent's sociodemographic characteristics
Subject Variable Category Mean±S.D.
1)t/F value
Observance of enforcement regulations by producers(farmers, fishermen, dairy husbandmen, etc.)
Sex Male
Female
2.86±1.12
3.16±1.07 -2.87
**Educational level
High school graduate and below Beyond college graduate
3.16±1.05
2.87±1.13 2.78
**Reinforcement of regulations and management by government
Educational level
High school graduate and below Beyond college graduate
3.24±1.07
2.99±1.12 2.36
**
p<0.05,
**p<0.01
1)
Rated with a 5-point scale: 1=Rarely, 5=Highly.
양심적인 행위 제조(4.70점)’, ‘제조 및 가공업자의 제조 관 련 법규 준수(4.69점)’ 순으로 미래 식품의 안전성 확보를 위 한 역할이 중요하다고 인식하는 것으로 나타났다. 이는 앞의 문항에서 나타난 바와 같이, 응답자들이 제조 및 가공업자, 판매업자, 생산자들이 식품 안전성 확보를 위해 현재의 역할 수행을 잘 하지 못하고 있다고 인식하고 있기 때문에 미래에 는 이들의 역할이 더욱 강화되어야 하는 것으로 생각하고 있 는 것으로 보여진다. Lee MS(1990)은 식품 오염 예방 대책 에 대한 책임자 역할 중요성을 살펴본 결과, 식품생산업체 (66.5%), 정부(11.8%)의 순으로 나타나 본 연구 결과와 비슷 하였으나, Shim EH(1994)의 연구에서는 식품 오염의 예방 및 경감 대책 등의 책임 소재에 대한 인식에서 정부의 법적 규제(43.6%), 식품제조업체 및 농민(27.6%) 순으로 높게 나 타나서 본 연구와는 다소 차이를 보이고 있었다.
한편, Table 14와 같이 미래의 식품 안전성 확보를 위한
‘유통업자의 유통 법규 준수’, ‘판매업자의 양심적인 행위’,
Table 13. Awareness about role importance of each subject for ensuring food safety in the future
Rank Risk Mean±S.D.
1)1 Observance of enforcement regulations by producers(farmers, fishermen, dairy husbandmen, etc.) 4.70±0.55
1 Sellers' conscientious behavior 4.70±0.59
3 Observance of regulations by manufacturers and processors 4.69±0.58
4 Reinforcement of regulations and management by government 4.67±0.62
5 Observance of regulations by distributors 4.66±0.60
6 Accurate news and information by mass media 4.59±0.65
7 Inspection of food materials and observance of enforcement regulations by dieticians and cooks 4.58±0.65
8 Consumers' consciousness and behavior 4.54±0.66
9 Research for food safety by food research institutes and universities 4.49±0.69 10 Information offer about food hazard by workers on health institutes 4.46±0.73
11 Education and publicity by consumer organizations 4.43±0.73
1)
Rated with a 5-point scale: 1=Rarely, 5=Highly.
Table 14. Awareness about role importance of each subject for ensuring food safety in the future according to the res- pondent's sociodemographic characteristics
Subject Variable Category Mean±S.D.
1)t/F value
Oobservance of enforcement regulations by producers(farmers, fishermen, dairy husbandmen, etc.)
Educational level
High school graduate and below Beyond college graduate
4.65±0.60
4.75±0.49 -1.98
*Monthly family income (won)
Less than 2,000,000
2,000,000 ~less than 3,000,000 3,000,000 ~less than 4,000,000 4,000,000 and over
4.75±0.56
ab4.67±0.56
b4.62±0.62
b4.83±0.41
a3.03
*Observance of regulations by manufacturers and processors
Monthly family income (won)
Less than 2,000,000
2,000,000 ~less than 3,000,000 3,000,000 ~less than 4,000,000 4,000,000 and over
4.67±0.62
b4.65±0.62
b4.62±0.62
b4.86±0.38
a3.74
*Observance of regulations by
distributors Sex Male
Female
4.61±0.66
4.72±0.52 -2.02
*Sellers' conscientious behavior Sex Male Female
4.63±0.67
4.77±0.49 -2.46
*Consumers' consciousness and behavior
Educational level
High school graduate and below Beyond college graduate
4.48±0.70
4.62±0.61 -2.42
*Monthly family income (won)
Less than 2,000,000
2,000,000 ~less than 3,000,000 3,000,000 ~less than 4,000,000 4,000,000 and over
4.41±0.83
b4.51±0.66
b4.52±0.67
b4.71±0.48
a3.15
*Table 14. Continued
Subject Variable Category Mean±S.D.
1)t/F value
Reinforcement of regulations and management by government
Monthly family income (won)
Less than 2,000,000
2,000,000 ~less than 3,000,000 3,000,000 ~less than 4,000,000 4,000,000 and over
4.63±0.70
b4.65±0.64
ab4.60±0.69
b4.82±0.39
a2.67
*Education and publicity by consumer
organizations Sex Male
Female
4.33±0.82
4.53±0.61 -2.88
**Research for food safety by food
research institutes and universities Sex Male Female
4.42±0.74
4.56±0.63 -2.17
*Inspection of food materials and observance of enforcement regulations by dietitians and cooks
Sex Male
Female
4.51±0.72
4.64±0.57 -2.15
*Accurate news and information by
mass media Sex Male
Female
4.52±0.72
4.66±0.57 -2.23
*Information offer about food hazard by
workers on health institutes Sex Male
Female
4.34±0.82
4.58±0.62 -3.37
***
p<0.05,
**p<0.01 :
a,bshows the results of Duncan's multiple range test.
1)
Rated with a 5-point scale: 1=Rarely, 5=Highly.
‘ 소비자단체의 교육 및 홍보’, ‘식품연구기관의 식품 안전성 에 대한 연구’, ‘영양사, 조리사의 식재료 검수 및 위생 수칙 준수’, ‘언론기관의 정확한 보도와 정보 제공’, ‘보건 의료 기 관 종사자의 식품 위해에 관한 정보 제공’에 대한 역할 중요 도의 인식도는 성별에 따라 차이를 보이고 있어서 남성에 비 해 여성이 미래에 이들 주체의 역할을 더욱 중요하게 여기고 있었다. 또한, ‘생산자의 시행 수칙 준수’, ‘소비자 스스로의 의식 및 행동’에 대한 역할 중요성의 인식도에 대해서는 학 력에 따른 차이를 나타내고 있어 고등학교 졸업 응답자에 비 해 전문대학 졸업 이상의 응답자가 이들의 역할의 중요성을 더욱 인식하고 있는 것으로 나타났다. 그리고 월가계 소득이 400만원 이상인 경우, 다른 월가계 소득 집단에 비해 미래 식품 안전성 확보를 위해 ‘생산자의 시행 수칙 준수’, ‘제조 및 가공업자의 제조 관련 법규 준수’, ‘소비자 스스로의 의식 및 행동’, ‘정부기관의 법적 규제 및 관리 강화’의 역할이 중 요하다고 인식하는 것으로 나타났다.
요약 및 결론