Convergence Influence of Clinical Physical Therapist's Attitude toward Work Environment and Professionalization on Job
Satisfaction
Hyo-Lyun Ro
1, Hee-Sang Yoo
2*1
Professor, Division of Physical Therapy, Kangwon National University
2
Doctor course student, Graduation School, Kangwon National University
임상 물리치료사의 업무환경 및 전문성 제도화에 대한 태도가 직업만족도에 미치는 융복합적 영향
노효련
1, 유희상
2*1
강원대학교 물리치료학과 교수,
2강원대학교 대학원 박사과정
Abstract This study investigated the influence of clinical physical therapist‘s perception of their work environment and their attitude toward professionalization on individual job satisfaction. This study is a cross-sectional survey of clinical physical therapists 356 working in hospital, and utilized a structured questionnaire. As a result of this study, in their twenties, women, physical therapist with low clinical experience, and physical therapists working at hospital level showed low job satisfaction. Most of the physical therapists said that they needed a system for professionalism, and the lower the job satisfaction was, the higher the attitude toward the necessity of introducing a professional system. The variables affecting job satisfaction were academic background and annual salary. Therefore, in order to improve the job satisfaction of physical therapists, improvement of salary and learning for professionalism played an important role in improving job satisfaction. Self-development and job specialization through the introduction of a system for equipping expertise appear to be important to improve the job satisfaction.
Key Words : Clinical physical therapist, Convergence, Job satisfaction, Professional system, Work environment
요 약 본 연구는 임상 물리치료사들의 업무 환경 및 전문성 제도화에 대한 태도가 직업 만족도에 미치는 영향을 알아 보고자 실시하였다. 이 연구는 설문지를 이용한 횡단적 연구로서 병원에서 근무하고 있는 물리치료사 356명을 대상으 로 하였다. 결과에서는 20대, 여성, 임상 경력이 낮은 물리치료사, 병원급에서 근무하는 물리치료사가 직업 만족도가 낮았다. 대부분의 물리치료사들의 전문성을 위한 제도가 필요하다고 하였고 직업 만족도가 낮을수록 전문 제도 도입의 필요성에 대한 태도가 높았다. 직업 만족도에 영향을 미치는 변인은 학력과 연봉이었다. 따라서, 물리치료사들의 직업 만족도를 향상시키기 위하여서 연봉의 개선과 전문성을 위한 학습이 직업 만족도 향상에 중요한 역할을 하고 있었다.
전문성을 갖추기 위한 제도 도입을 통한 자기 계발과 업무의 전문화는 물리치료사의 직업 만족도를 향상시키기 위하여 중요한 것으로 보인다.
주제어 : 임상 물리치료사, 융복합, 직업 만족도, 전문성 제도, 업무 환경
*Corresponding Author : Hee-Sang Yoo([email protected]) Received December 31, 2020
Accepted March 20, 2021 Revised January 29, 2021
Published March 28, 2021
1. Introduction
Many of those living in modern industrial societies spend most of their time at work, so their jobs hold an important position in their lives[1]. Job satisfaction is the emotional, qualitative, and satisfactory state obtained from the evaluation of the job environment[2] and is related to the perceived difference between what is experienced and what is expected in various aspects of the job situation[3]. Both job performance and the job content itself impact workers' mental state[3]. Job satisfaction is not only a matter of realizing the interests of the organization but also related to the realization of individual values[2] and quality of life[31]. Thus, job satisfaction is influenced by several factors[6], including working conditions, such as remuneration and working environment, management methods, such as promotion and work management[7,8], and personal characteristics[3].
Professionalism refers to the attitudes and behaviors of those who are engaged in a profession and comprises belief in one's work, commitment to one's profession, and job autonomy[2]. Physical therapists engage in thermal therapy, electric therapy, phototherapy, hydrotherapy, mechanical and instrument therapy, and massage function training, which are not just technical jobs, but specialized jobs that require specialized knowledge and technical skills[9]. The World Confederation for Physiotherapy (WCPT) define physiotherapy as:
“Physical therapy is concerned with identifying and maximising quality of life and movement potential within the spheres of promotion, prevention, treatment/intervention, habilitation and rehabilitation[15].
When a physical therapist lacks job satisfaction, it is difficult to expect effective physical therapy for the patient, and their professional development may be stunted [10]. Giving an important value to one's job or job is to increase job satisfaction[11].
Kwon and Kim[12] argued that higher job satisfaction led to more kindness and higher patient satisfaction, so physical therapists should focus on improving occupational consciousness.
Park[13] stated that improvement of the educational environment, the introduction of a specialist physical therapist, and the revision of the medical law increased physical therapists' professional morale and job satisfaction. However, as of 2015, Korea is one of 84 countries (Japan and Korea) in which physical therapists cannot independently operate[14]. In addition, Korean physical therapists not only have insufficient social awareness compared with those of other countries, such as Japan, the United States, Europe, and Australia, but also work in a very poor environment, in terms of working hours, workload, remuneration, and welfare facilities[15-17].
Although the pattern of patients using physical therapy rooms is changing because of the increase in the elderly population and the changes in social structure, the working environment of the physical therapist has not changed significantly over time[18]. The reason why the change in the working environment of the physical therapy room has not changed significantly compared to the change of the times seems to be the lack of awareness of the professionalism of the physical therapists in their work. In addition, the physical therapist, who is a medical engineer, is allowed to do its work only by holding it under the guidance of a doctor[4], this limitation seems to have an effect on the social perception of physical therapists as well as lower the self-esteem and satisfaction of physical therapists' work.
Therefore, this study investigated the influence
of clinical physical therapists' perception of their
work environment and their attitude toward
professionalization on individual job satisfaction
to facilitate the creation of an environment
wherein physical therapists' job satisfaction can
be improved.
2. Subjects and Methods 2.1 Study design
This study is a cross-sectional survey of clinical physical therapists working in Seoul, Gyeonggi Province, Gyeongsang Province, and Gangwon Province.
2.2 Subject and data collection
From April 21 to June 8, 2019, 390 surveys were distributed, and 376 copies were collected either by a physical therapist who participated in the maintenance training or by Google questionnaire. After excluding responding unfaithfully or duplicate questionnaires, 356 surveys were included in the final analysis. On the basis of Cohen's Power analysis formula, for a significance level of 0.05, effect size of 0.20, and power (1-β) of 0.95, the minimum number of subjects was calculated as 262. Therefore, the 356 subjects in this study were found to be sufficient to proceed with the study. The purpose of the study was explained in the data collection procedure, and all subjects were assured that all displayed information would be kept confidential and used only for the purpose of the study. In addition, subjects were notified that they may withdraw from the study at any time. and it is notified that the collected data will be processed anonymously, and only if you voluntarily agree to participate in the investigation.
2.3 Research tools
This study utilized a structured questionnaire to gather information on the general characteristics of physical therapists (age, gender, education, and marriage), job characteristics (clinical experience, salary, and workplace), job satisfaction, and attitude toward professionalization. Job satisfaction was ranked using a 5-point Likert scale, from “very satisfied”
(1 point) to “very unsatisfied” (5 points), in which
lower scores indicated higher satisfaction. The attitude toward professionalization was also scored using a 5-point Likert scale, from “very necessary”(1 point) to “very not necessary”(5 points), wherein higher score indicated a more negative attitude toward the professional system.
2.4 Statistical analysis
Data were analyzed using the SPSS WIN 19.0 program; p-values <0.05 indicated statistical significance. First, descriptive statistics were conducted to evaluate general characteristics.
Then, one-way analysis of variance, post hoc, and chi-squared analysis were conducted to evaluate job satisfaction and attitude toward professionalization based on the general characteristics. Finally, regression analysis was conducted to determine the effect of job characteristics and attitudes toward professionalization on job satisfaction.
3. Results
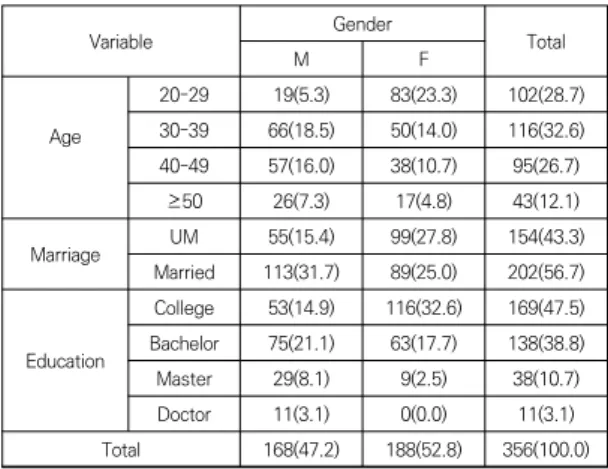
3.1 General characteristics of the subjects The general characteristics of the study subjects are shown in Table 1.
Table 1. General characteristics of the subjects
n(%)Variable Gender
Total
M F
Age
20–29 19(5.3) 83(23.3) 102(28.7)
30–39 66(18.5) 50(14.0) 116(32.6)
40–49 57(16.0) 38(10.7) 95(26.7)
≥50 26(7.3) 17(4.8) 43(12.1)
Marriage UM 55(15.4) 99(27.8) 154(43.3)
Married 113(31.7) 89(25.0) 202(56.7) Education
College 53(14.9) 116(32.6) 169(47.5)
Bachelor 75(21.1) 63(17.7) 138(38.8)
Master 29(8.1) 9(2.5) 38(10.7)
Doctor 11(3.1) 0(0.0) 11(3.1)
Total 168(47.2) 188(52.8) 356(100.0)
M±SD: Mean±Standard deviation, M: male, F: Female, UM: unmarried.
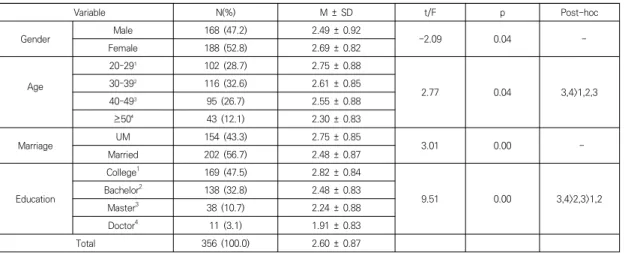
Table 2. Subjects characteristics and job satisfaction
Variable N(%) M ± SD t/F p Post-hoc
Gender Male 168 (47.2) 2.49 ± 0.92
−2.09 0.04 -
Female 188 (52.8) 2.69 ± 0.82
Age
20–29¹ 102 (28.7) 2.75 ± 0.88
2.77 0.04 3,4>1,2,3
30–39² 116 (32.6) 2.61 ± 0.85
40–49³ 95 (26.7) 2.55 ± 0.88
≥50⁴ 43 (12.1) 2.30 ± 0.83
Marriage UM 154 (43.3) 2.75 ± 0.85
3.01 0.00 -
Married 202 (56.7) 2.48 ± 0.87
Education
College1 169 (47.5) 2.82 ± 0.84
9.51 0.00 3,4>2,3>1,2
Bachelor2 138 (32.8) 2.48 ± 0.83
Master3 38 (10.7) 2.24 ± 0.88
Doctor4 11 (3.1) 1.91 ± 0.83
Total 356 (100.0) 2.60 ± 0.87
Of the 356 study participants, 52.8%(n = 188) were women and 47.2%(n = 168) were men. With respect to age, the majority of men held their 30s(18.5%, n = 66), whereas the majority of women were their 20s(23.3%, n = 83). Most of the men(31.7%, n = 113) were married, whereas most of the women were unmarried(27.8%, n = 99). As for the academic background, the majority of men held bachelor's degrees(21.1%, n = 75), whereas the majority of women were college(32.6%, n = 116).
3.2 Degrees of job satisfaction according to the general characteristics
The degree of job satisfaction according to the general characteristics of physical therapists was investigated are shown in Table 2.
Men showed a significantly higer level of job satisfaction than women(2.49 ± 0.92 vs. 2.69 ± 0.82, respectively, p <0.05). There was a statistically significant difference in job satisfaction according to age (p <0.05); job satisfaction was the lowest in physical therapists in their 20s and highest in those aged ≥50s. Unmarried subjects showed statistically less job satisfaction than married subjects (p <0.001). According to academic background, subjects with a Doctor had statistically higher job satisfaction than those
with college (p <0.001). The job satisfaction of all study subjects was 2.60 ± 0.87, which is slightly higher than the median.
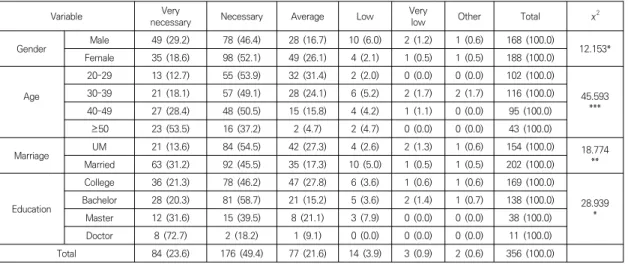
3.3 Attitude toward professionalization according to general characteristics Regarding the necessity of increasing the significant portion of both men and women deemed professonaliztion of physical therapists, a statistically it was “necessary”(46.4%, n = 78 vs 52.1%, n = 98 respectively, p <0.05). Subjects who are in their 20s, 30s, and 40s reported that professionalization was “needed,”whereas those aged ≥50 years reported it was “very necessary,”
which was statistically significant (p <0.001).
According to marital status, a statistically significant number of both unmarried and married subjects deemed it was “necessary”(p <0.01). According to marital status, a statistically significant number of both unmarried and married subjects deemed it was “necessary”(p <0.01).
In academic background, professionalization was considered “necessary” for both college and those with bachelor's degrees(46.2%, n = 78;
58.7%, n = 81, respectively). For those with master's degrees, most regarded it as “needed,
”followed by “very necessary”(39.5%, n = 15;
31.6%, n = 12, respectively), and those with
Table 4. Work environment and career
Variable N(%) M±SD t/F p Post-hoc
Career (year)
1–5¹ 107 (30.0) 2.72 ± 0.91
2.43 0.07 3,4>1,2,3
6–10² 87 (24.4) 2.64 ± 0.70
11–20³ 118 (33.1) 2.55 ± 0.95
〉20⁴ 44 (12.4) 2.32 ± 0.83
Type of hospital
University/General Hospital¹ 84 (23.6) 2.32 ± 0.84
3.42 0.01 1,2,5>2,4,5 Nursing/Rehabilitation hospital² 113 (31.7) 2.65 ± 0.85
Hospital³ 28 (7.9) 2.86 ± 0.85
Clinic⁴ 91 (25.6) 2.73 ± 0.83
Other⁵ 40 (11.2) 2.55 ± 0.99
Annual Salary (₩)
<25,000,000¹ 55 (15.4) 2.76 ± 0.67
6.91 0.00 5>1,2,3,4
25,000,000–<30,000,000 ² 88 (24.7) 2.74 ± 0.88 30,000,000–<35,000,000 ³ 86 (24.2) 2.72 ± 0.90 35,000,000–<40,000,000⁴ 40 (11.2) 2.68 ± 0.97
≥40,000,000⁵ 87 (24.4) 2.18 ± 0.79
Total 356 (100.0) 2.60 ± 0.87
Table 3. Necessity of professionalization according to subjects’characteristics
n(%)Variable Very
necessary Necessary Average Low Very
low Other Total χ2
Gender Male 49 (29.2) 78 (46.4) 28 (16.7) 10 (6.0) 2 (1.2) 1 (0.6) 168 (100.0)
12.153*
Female 35 (18.6) 98 (52.1) 49 (26.1) 4 (2.1) 1 (0.5) 1 (0.5) 188 (100.0) Age
20–29 13 (12.7) 55 (53.9) 32 (31.4) 2 (2.0) 0 (0.0) 0 (0.0) 102 (100.0)
45.593
***
30–39 21 (18.1) 57 (49.1) 28 (24.1) 6 (5.2) 2 (1.7) 2 (1.7) 116 (100.0)
40–49 27 (28.4) 48 (50.5) 15 (15.8) 4 (4.2) 1 (1.1) 0 (0.0) 95 (100.0)
≥50 23 (53.5) 16 (37.2) 2 (4.7) 2 (4.7) 0 (0.0) 0 (0.0) 43 (100.0)
Marriage UM 21 (13.6) 84 (54.5) 42 (27.3) 4 (2.6) 2 (1.3) 1 (0.6) 154 (100.0) 18.774
Married 63 (31.2) 92 (45.5) 35 (17.3) 10 (5.0) 1 (0.5) 1 (0.5) 202 (100.0) **
Education
College 36 (21.3) 78 (46.2) 47 (27.8) 6 (3.6) 1 (0.6) 1 (0.6) 169 (100.0)
28.939
* Bachelor 28 (20.3) 81 (58.7) 21 (15.2) 5 (3.6) 2 (1.4) 1 (0.7) 138 (100.0)
Master 12 (31.6) 15 (39.5) 8 (21.1) 3 (7.9) 0 (0.0) 0 (0.0) 38 (100.0)
Doctor 8 (72.7) 2 (18.2) 1 (9.1) 0 (0.0) 0 (0.0) 0 (0.0) 11 (100.0)
Total 84 (23.6) 176 (49.4) 77 (21.6) 14 (3.9) 3 (0.9) 2 (0.6) 356 (100.0)
*p<.05, **p<.01, ***p<.001, UM: unmarried
Doctor considered professionalization “very necessary”(72.7%, n = 8), which was statistically significant (p <0.05).
3.4 Job satisfaction according to work environment
The degree of job satisfaction according to work environment is shown in Table 4.
Those with 1–5 years of clinical experience showed the lowest job satisfaction(2.72 ± 0.91), and those with >20 years of clinical experience reported the highest job satisfaction(2.32 ± 0.83),
but the level of job satisfaction according to
years of clinical experience was not statistically
significant. Job satisfaction was lowest for those
working at the hospital level(2.86 ± 0.85) and
highest for those working at university/general
hospitals(2.32 ± 0.84, p <0.05). There was a
statistically significant difference in job satisfaction
according to annual salary(p <0.001); job
satisfaction was the lowest in physical therapists
in their 25 million won(2.76 ± 0.67) and highest
in those over 40 million won(2.18 ± 0.79).
Variable Very
necessary Necessary Average Low Very low Other Total χ2
Career (year)
1–5 13 (12.1) 60 (56.1) 30 (28.0) 3 (2.8) 0 (0) 1 (0.9) 107 (100.0)
41.487***
6–10 16 (18.4) 48 (55.2) 19 (21.8) 3 (3.4) 0( 0) 1 (1.1) 87 (100.0)
11–20 33 (28.0) 51 (43.2) 26 (22.0) 5 (4.2) 3 (2.5) 0 (0.0) 118 (100.0)
〉20 22 (50.0) 17 (38.6) 2 (4.5) 3 (6.8) 0 (0.0) 0 (0.0) 44 (100.0)
of hospitalType
University/General hospital 16 (19.0) 46 (54.8) 16 (19.0) 3 (3.6) 1 (1.2) 2 (2.4) 84 (100.0)
28.617 Nursing/Rehabilitation hospital 25 (22.1) 53 (46.9) 31 (27.4) 4 (3.5) 0 (0.0) 0 (0.0) 113 (100.0)
Hospital 5 (17.9) 13 (46.4) 9 (32.1) 0 (0.0) 1 (3.6) 0 (0.0) 28 (100.0) Clinic 29 (31.9) 47 (51.6) 12 (13.2) 3 (3.3) 0 (0.0) 0 (0.0) 91 (100.0) Other 9 (22.5) 17 (42.5) 9 (22.5) 4 (10.0) 1 (2.5) 0 (0.0) 40 (100.0)
Annual Salary
(₩)
<25,000,000 5 (9.1) 28 (50.9) 19 (34.5) 3 (5.5) 0 (0.0) 0 (0.0) 55 (100.0)
39.691**
25,000,000–<30,000,000 17 (19.3) 48 (54.5) 19 (21.6) 3 (3.4) 1 (1.1) 0 (0.0) 88 (100.0) 30,000,000–<35,000,000 16 (18.6) 48 (55.8) 18 (20.9) 2 (2.3) 0 (0.0) 2 (2.3) 86 (100.0) 35,000,000–<40,000,000 13 (32.5) 21 (52.5) 5 (12.5) 0 (0.0) 1 (2.5) 0 (0.0) 40 (100.0)
≥40,000,000 33 (37.9) 31 (35.6) 16 (18.4) 6 (6.9) 1 (1.1) 0 (0.0) 87 (100.0) Total 84 (23.6) 176 (49.4) 77 (21.6) 14 (3.9) 3 (0.8) 2 (0.6) 356 (100.0)
**p <.01, ***p <.001
Table 6. Necessity of professionalism system according to work environment
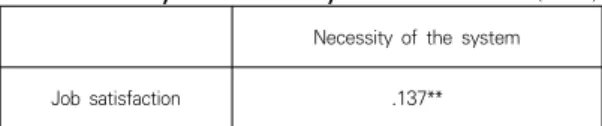
n(%)Table 5. Analysis of the correlation between satisfaction
and system necessity
(n=356) Necessity of the systemJob satisfaction .137**
**p<0.01
3.5 Correlation analysis of job satisfaction and tne necessity of professionalization There was a positive significant correlation (r
= 0.137, p <0.01) between job satisfaction and the need for professionalization. Therefore, it was thought that the lower the job satisfaction, the more professionalization was needed are shown in Table 5.
3.6 Attitudes toward professionalization according to work environment
The attitude of physical therapists toward professionalization according to work environment is shown in Table 6.
For those with ≤20 years of experience, professionalization was significantly considered
“necessary,” whereas for those with >20 years of experience, it was significantly regarded as “very necessary”(p <0.001). Professionalization was most commonly deemed “necessary” among all types of hospitals. For those earning annual salary <40 million won, professionalization was regarded as “necessary,” whereas it was significantly considered “very necessary” for those earning ≥40 million won annually(p <0.01).
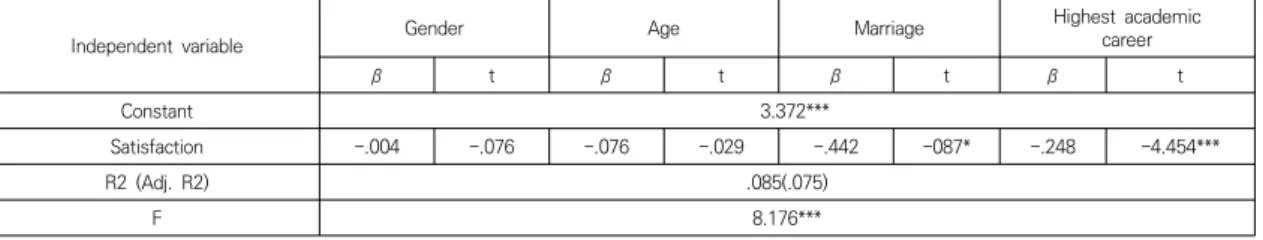
3.7 Effects of general characteristics on job satisfaction
To examine the effect of subjects' general characteristics on job satisfaction, job satisfaction was set as the dependent variable, and gender, age, marriage, and education were set as independent variables. Then regression analysis was performed by converting it into a dummy variable are shown in Table 7. The only general characteristic that affected job satisfaction was the educational background (β =
−0.248), for which the model explanatory power
was at a low level (R
2= 0.075).
Table 7. Effect of general characteristics on job satisfaction
Independent variable Gender Age Marriage Highest academic
career
β t β t β t β t
Constant 3.372***
Satisfaction −.004 −.076 −.076 −.029 −.442 −087* −.248 −4.454***
R2 (Adj. R2) .085(.075)
F 8.176***
*p <0.05, ***p <0.001
Independent variable Career Institution Salary
β t β t β t
Constant 2.859***
Satisfaction −.023 −.329 .101 1.872 −.207 −3.018*
R2 (Adj. R2) .062(.054)
F 7.794***
*p<0.05, ***p<0.001