• 검색 결과가 없습니다.

A Comparison of Systematic Sampling Designs for Forest Inventory

N/A
N/A
Protected

Academic year: 2021

Share "A Comparison of Systematic Sampling Designs for Forest Inventory"

Copied!
9
0
0

로드 중.... (전체 텍스트 보기)

전체 글

(1)

133

F OREST S OCIETY

A Comparison of Systematic Sampling Designs for Forest Inventory

Jong Su Yim 1 , Christoph Kleinn 1 , Sung Ho Kim 2 , Jin-Hyun Jeong 2 and Man Yong Shin 3 *

1 Department of Forest Inventory and Remote Sensing, Faculty of the Forest Sciences and Forest Ecology Georg-August University, Buesgenweg 5 D-37077 Göttingen, Germany

2 Division of Forest Resource Information, Korea Forest Research Institute, Seoul, Korea

3 Department of Forest Resources, College of Forest Science, Kookmin University, Seoul 136-702, Korea

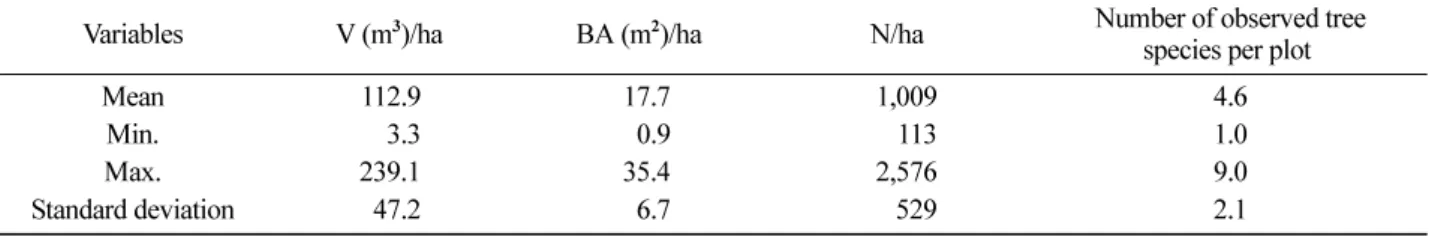
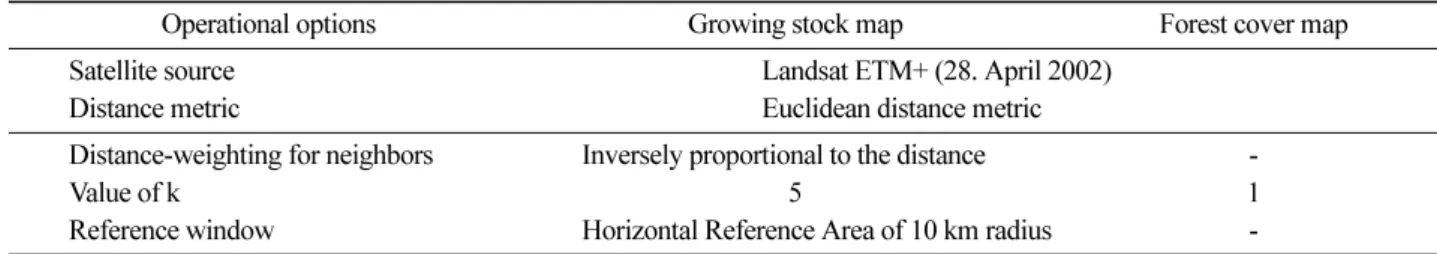
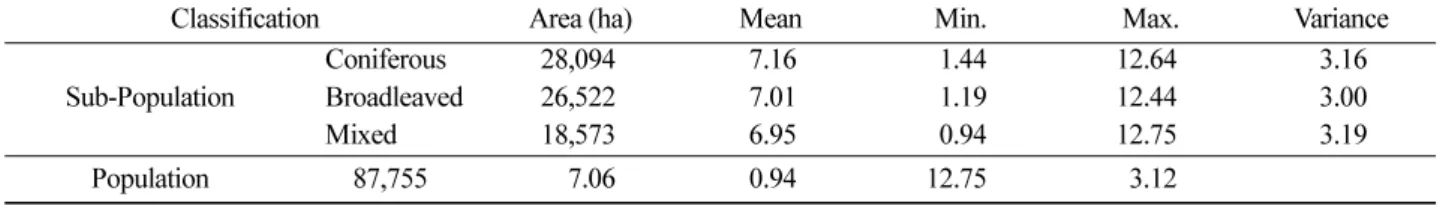
Abstract : This study was conducted to support for determining an efficient sampling design for forest resources assessments in South Korea with respect to statistical efficiency. For this objective, different systematic sampling designs were simulated and compared based on an artificial forest population that had been built from field sample data and satellite data in Yang-Pyeong County, Korea. Using the k -NN technique, two thematic maps (growing stock and forest cover type per pixel unit) across the test area were generated; field data ( n =191) and Landsat ETM+ were used as source data. Four sampling designs (systematic sampling, systematic sampling for post-stratification, systematic cluster sampling, and stratified systematic sampling) were employed as optimum sampling design candidates. In order to compute error variance, the Monte Carlo simulation was used ( k =1,000). Then, sampling error and relative efficiency were compared. When the objective of an inventory was to obtain estimations for the entire population, systematic cluster sampling was superior to the other sampling designs. If its objective is to obtain estimations for each sub-population, post-stratification gave a better estimation. In order to successfully perform this procedure, it requires clear definitions of strata of interest per field observation unit for efficient stratification.

Key words : forest inventory, systematic sampling, growing stock, artificial forest population, sampling sim- ulation

Introduction

In South Korea, the process of National Forest Inven- tory began in 1971 and a stratified systematic sampling with cluster plots was applied. Forest cover types were identified and delineated from 1:15,000 black and white aerial photos and then used as stratification criteria for field sampling. The main goal of the NFI was to provide information for the reforestation plan over the destroyed forest areas. Thus, the NFI addressed estimates of the total growing stock for the entire country, as well as for different stratifications such as forest cover types, dom- inant tree species, age classes, etc. for forest conditions, ownerships, and administrative units (KFRI, 1996). Despite increasing needs of information on forest resources and technological development, the inventory design remained the same until the 4 th NFI (1996-2005).

Currently, the NFI is in its fifth cycle (2006-2010) and has been reorganized and expanded to provide data and information about forest resources for sustainable forest management. The inventory design has changed to a systematic cluster sampling and the NFI has been carried out in about 20% of the total sample size over the entire country per year (KFRI, 2006). However, to search an efficient sampling design for forest resource assessment, more statistically based foundational research is required because most studies on sampling design for forest resources inventory in Korea were conducted on small study areas at a stand-level by Kim (1965 and 1973).

Since then, there have been few studies on this topic (KFS, 2004b; Shin and Han, 2006).

Two of the basic sampling designs are random sam- pling and systematic sampling. In large area forest inven- tories, systematic sampling has been widely applied because systematic samples are well-spread across a population of interest and give several advantages in practice (Kleinn and Morales, 2001). Another design is stratified

*Corresponding author

E-mail: [email protected]

(2)

sampling, which helps to reduce the error variance in many cases. Stratification can take two forms, depending on whether the ancillary information is used before or after the sample selection: stratified sampling (pre-strat- ification) and double sampling for stratification (post- stratification). Stratified sampling is feasible when the entire population can be divided into different sub-pop- ulations (e.g. forest cover types) since samples are inde- pendently selected in each stratum. This can be performed on maps, aerial photographs or satellite imagery. Post- stratification can be combined with different sampling designs, for example, systematic sampling with post- stratification (Saborowski and Cancino, 2007). In this approach, samples are taken under a given sampling design and are then stratified into strata; this means in the samples a categorical or indicator variable is recorded as stratification criterion. These variables indicate which sample belongs to which stratum. Furthermore, the three major sampling designs may be used not only individually, but also in combination with different sampling designs such as in two or multi-stage sam- pling and multi-phase sampling. Even though multi- stage and -phase sampling designs can produce a more precise estimation, they require a complicate estimator (Lanz, 2000). Therefore, a simple sampling design is preferred for large area forest resources assessment (EC, 1997).

Under normal circumstances, however, the necessary sample sizes in the evaluation of each sampling design cannot be realized over a large area. Computer simula- tions offer a cheaper and more flexible possibility. The main advantages of simulations are that they allow con- trolled experimentation and sensitivity analyses. Scott and Köhl (1993) developed an interactive computer pro- gram for an extensive forest inventory, called SIZE, which is able to simulate alternative sampling designs using combinations of several characteristics. In recent years, artificial populations for relatively large areas at a regional level have been computed and generated by combining information from digital satellite data and ground truth data. Notwithstanding the drawbacks of artifi- cial populations, which include deviations from reality, they also allow for the simulations of various sampling designs such as, for example, estimation of land use for

systematic sampling from a land use classified image (Dunn and Harrison, 1993), cluster plot optimization (Tokola and Shrestha, 1999), and sampling simulation for small area statistics using outputs of a large area for- est inventory (Katila and Tomppo, 2006).

The aim of this study is to support for determining an efficient sampling design for forest resources assessment in Korean forest conditions with respect to statistical effi- ciency. To do this, different systematic sampling designs that have been frequently applied to large area forest inven- tories were simulated and compared on the basis of an artificially generated forest population for a municipality unit.

Materials and Methods

1. Artificial forest population

In order to simulate various sampling design options, it is necessary to generate an artificial forest population with characteristics as close as possible to a realistic tar- get forest. An artificial forest population can be derived from the k -NN techniques by combining digital satellite data and forest inventory data (Franco-Lopez et al ., 2001; Yim et al ., 2007). The procedure consists of the following three main steps:

Modeling of a forest attribute of interest (growing stock map)

Production of a forest cover map for stratification

Generation of an artificial forest population by com- bining the two thematic maps

Using the k -NN technique, thematic maps of growing stock and forest cover types over a test area can be gen- erated. For this, field plots with a plot size of 0.05 ha ( n =191) were collected and then classified into three for- est cover types. The forest strata per plot were defined by the proportion of number of trees by dominant tree species (KFRI, 1996). Table 1 presents summary statis- tics from the field plots which served as training data. To improve the precision of estimates in the k -NN tech- nique, several operational options were applied (Yim et

al ., 2006). Additionally to perform stratified sampling, a forest cover map was also generated by using the clas- sified field data and non-forest points (39 points) and used as a baseline for stratification.

Table 1. Summary statistics based on field plot data served as training data (n=191).

Variables V (m 3 )/ha BA (m 2 )/ha N/ha Number of observed tree

species per plot

Mean 112.9 17.7 1,009 4.6

Min. 3.3 0.9 113 1.0

Max. 239.1 35.4 2,576 9.0

Standard deviation 47.2 6.7 529 2.1

(3)

2. Sampling simulation

The following four sampling designs that have been most commonly applied to large area forest inventories were compared: stratified systematic sampling, system- atic sampling, systematic sampling with post-stratifica- tion, and systematic cluster sampling. The characteristics of different sampling designs are summarized in Table 2.

In the Korean NFI, there are several possible types of stratification (KFRI, 1996). The stratification by forest con- ditions is performed with aerial photographs. This study used the generated thematic map of forest cover types as the basis for stratification. Since the stratum sizes in the artificial population could be easily calculated from the thematic map, the proportional allocation method was adopted (Table 3). Systematic sampling comprises a large group of sampling designs that have one important characteristic from a statistical point of view: the lack of randomization of the sample to be selected (Kangas, 1993). Despite the problems with variance estimation, systematic sampling has a series of advantages with respect to practical and statistical considerations (Table 2). Applying the SRS estimators to systematic sampling produces a conservative estimation of standard error;

that is, the true standard error is commonly over-esti- mated. When systematic sampling is applied, the spatial spacing between samples is an important factor that should influence precision. The spatial spacing applied for large area forest inventories vary with countries and forest conditions. In this study, four sample grid sizes (1 km, 1.5 km, 2 km, and 4 km) were analyzed. There are cases in which the systematic sampling can be combined with stratified sampling. Stratified systematic sampling is similar to STR except that the sample points are sys-

tematically selected within each stratum, where starting points are independently determined for each stratum.

This design was applied in the last NFI with a square grid size of 1 km (KFRI, 1996).

In systematic sampling with post-stratification (sys+post), the stratum proportions are estimated from the propor- tion of samples in each stratum. In this study, selected samples were post-stratified based on the thematic map of forest cover types such as pre-stratification (Table 3).

Systematic cluster sampling uses a cluster plot consisting Table 2. Summary of characteristics for different sampling designs (Cochran, 1977; Johnson, 2000; Köhl et al ., 2006).

Sampling design Advantages Disadvantages

Stratified random

Sampling (STR) more precise than SRS

− estimations for each stratum

− need for ancillary information for stratification

− time-consuming & expensive

− complex to organize samples Systematic sampling

(SYS)

− more precise than SRS

− simple to implement

− simple to explain & control

− well distributed samples

− easy to combine with other sampling designs

− lack of randomization of samples

− no general unbiased estimator

− “auto-correlation” between samples Stratified systematic

Sampling (sys+pre)

− more precise than STR

− well distributed samples

− simple to organize samples than STR

− need for ancillary information for stratification

− time-consuming & expensive Systematic sampling

for post-stratification (sys+post)

− estimations for each stratum

− meaningful sub-division

− quicker & less expensive than STR

− unknown sample sizes for each stratum

− laborious & dubious for stratification

− need for definitions of strata per observation unit Systematic cluster

Sampling (sys+clu)

− more information

− more precise for an equal sample size

− cost-effective need for the optimum cluster plot as the sampling unit Table 3. Mean estimators for the simulated systematic sampling designs (Cochran, 1977; Johnson, 2000).

Sampling designs Mean estimator Stratified sampling

Systematic stratified sampling Systematic sampling with

post-stratification Systematic cluster sampling where n : total sample size,

L : number of strata,

n h : sample size for each stratum h , : estimated mean per stratum h, N h : stratum size per stratum, W h : stratum weight per stratum,

: stratum weight per strafum h for post-stratificaion, y i : total per cluster i , and

m i : cluster size per cluster i.

y st W h y y

h 1 = L

∑ 1

N ---- N h y h

h 1 = L

= = ∑

y sts n h --- n y h

h 1 = L

= ∑

y post W h y h

h 1 = L

= ∑ y clu y i

m i

∑ ---

=

y h

W h

(4)

of various sub-plots instead of a single plot. Under sys- tematic sampling, clusters are distributed across the whole population using the pre-defined systematic inter- vals. This study employed a cluster plot design ( m =4) which has been applied in the current Korean NFI (KFRI, 2006). In most applications of clusters for nat- ural resources assessment, clusters contain different numbers of sub-plots. In this case, the ratio estimator can be applied (Table 3), with the cluster size serving as an ancillary variable.

Comparison

3.1 Sampling error

Because the samples are only subsets of the total pop- ulation, each estimate for any given sampling design will contain an error, so called “sampling error”. The results of repeated data collections using the same sampling design have a certain variance, which is due to the ran- domness of the sample. This variance can be estimated by the Monte Carlo simulation; this assumes that the samples are independently and identically distributed (Engeman et al ., 1994). The variance is most easily cal- culated as follows:

(1) where k is the number of simulations, is the estimated mean of the i th simulation and is the mean of the esti- mated means by repeated simulations. In this estimator, the denominator k -1 was used to estimate an unbiased variance in sampling without replacement. The square root of this variance is the standard error. Relative stan- dard error (SE%) can be calculated to compare the pre- cision for different sampling designs and grid sizes.

(2) 3.2. Relative efficiency

The relative efficiency (RE) is given by two unbiased estimators z 1 and z 2 of a variable z with variances Var ( z 1 ) and Var ( z 2 ), respectively. The efficiency of z 1 rela- tive to z 2 is given by

(3) In this study, the variance Var ( z 1 ) is calculated from SRS as a baseline and the variance Var ( z 2 ) is estimated for the simulated systematic sampling designs. If the effi- ciency is greater than 1, SRS is preferable; conversely, if its value for a candidate design is less than 1, this design is more precise than SRS (Köhl et al ., 2006).

Results

1. Artificial forest population

The applied options and their values for thematic maps are given in Table 4. The generated thematic maps were used as an artificial forest population.

In this study, the forest area in an artificial model for- est consists of cells (or grids) with a size of 25 m × 25 m and the set of cells within forest forms the population, as shown in Figure 1. In the NNC classified image, the for- est area is 73,196 ha. About 38% (28,094 ha) of the total forest area is occupied by coniferous forest, 36% by broadleaved forest, and 25% by mixed forest (Table 5).

The parametric value of growing stock per unit for the population and for each stratum of the artificial popula- tion is summarized in Table 5. The parametric mean value are calculated to be 7.16 m 3 , 7.01 m 3 , 6.95 m 3 per unit for coniferous, broadleaved, and mixed forests, respectively. In the case of the mixed forest, its variance is highest, which means that the variability among ele- ments is larger than the other forest cover types. The dif- ference in variance between strata, however, is very small.

2. Simulation of sampling designs 1) Sampling error

Each sampling design was simulated with different sample sizes without replacement and was repeated 1,000 times, respectively. When systematic sampling is applied, sample size is a random variable that varies with sample grid size (1 km, 1.5 km, 2 km and 4 km) and starting point for each simulation. Thus, mean sam- ple size was computed for each grid size, as presented in Table 6. Simple random sampling (SRS) as a baseline

vaˆr y˜ ( )

y i – y˜

( ) 2

i 1 =

∑ k

k 1 – ---

=

y y˜

SE vaˆr y˜ ( ) SE% , vaˆr y˜ ( ) --- 100 y˜ ×

= =

RE E 1 E 2 ---

⎝ ⎠ ⎛ ⎞ var z ( ) 2 var z ( ) 1 ---

=

Table 4. Applied characteristics for the growing stock and forest cover type maps within the k-NN process.

Operational options Growing stock map Forest cover map

Satellite source Landsat ETM+ (28. April 2002)

Distance metric Euclidean distance metric

Distance-weighting for neighbors Inversely proportional to the distance -

Value of k 5 1

Reference window Horizontal Reference Area of 10 km radius -

(5)

was compared to the simulated systematic sampling designs.

The SE% for systematic sampling (SYS), ranging from 0.81% to 3.54%, was slightly smaller than that for SRS, except for the grid size of 4 km. The SE% for the largest sample size was about four times smaller than that for the smallest sample size. This result was also observed for the other simulated systematic sampling

designs. The sampling error for stratified systematic sampling was similar to SYS. For reducing costs and obtaining improved precision through stratification, sys- tematic sampling with post-stratification was applied.

The SE% for this design ranged from 0.80% to 3.60%

and was similar to stratified systematic sampling. Fur-

thermore, this design yielded slightly more precise

Figure 1. Thematic maps used as an artificial forest population in this study: forest cover types (top) and growing stock per

hectare within the forest (bottom).

(6)

results than SYS when n>183. Systematic cluster sam- pling was superior to the other sampling designs, as pre- sented in Table 6. Additionally, as the distance between grids gets smaller, i.e., as sample size increases, the pre- cision becomes increasingly higher. In contrast to other sampling designs that include only one element, the cluster plot consists of four elements per cluster.

With respect to the distances between samples, a greater improvement in sampling error was observed between the sample grid sizes of 2 km and 4km for all simulated systematic sampling designs. The decrease in sampling error was relatively small compared to the increase in the number of samples from 183 to 732.

2) Relative efficiency

The error variance for SRS was used as a baseline to calculate relative efficiency. Figure 2 depicts the relative efficiency as a function of sample size. The efficiency of the sampling designs using the pre-stratification (STR and sys+pre) was small. For systematic sampling designs, the efficiency was higher than SRS, which increased with increasing sample size. When the same sampling effort was used, on average systematic sampling with

post-stratification (sys+post) had the highest efficiency.

The relative efficiency of systematic cluster sampling for all sample sizes was about two times higher than that of SRS.

Discussion

In this study, an artificial forest population for a county was built from forest inventory data and Landsat data through the k -NN technique. Despite several errors of the k -NN maps, they are feasible to simulate various sampling designs for a relatively large area at lower cost.

The uncertainty of the k -NN maps can be improved with a sufficient training dataset and multi-seasonal satellite data.

It is a known fact that the efficiency of stratified sam- pling depends upon the stratification. In the last NFI, the characteristics of stratification (e.g., stratum weight) for the forest conditions, however, were not used for the allocation of the samples. These stratifications were only used to select samples within each stratum and to esti- mate total growing stocks (KFRI, 1996). Aerial photos were used to identify the information about stratification Table 5. Summary statistics of growing stock (m 3 ) per pixel unit for each stratum for the given artificial forest population.

Classification Area (ha) Mean Min. Max. Variance

Sub-Population Coniferous 28,094 7.16 1.44 12.64 3.16

Broadleaved 26,522 7.01 1.19 12.44 3.00

Mixed 18,573 6.95 0.94 12.75 3.19

Population 87,755 7.06 0.94 12.75 3.12

Variance: the variance per element of the population and sub-populations

Figure 2. Relative efficiency for different sampling strategies and different sample sizes, where SRS (simple random

sampling), SYS (systematic sampling), Sys+pre (stratified systematic sampling), Sys+post (systematic sampling with post-

stratification), and Sys+clu (systematic sampling with the cluster of 4 sub-plots).

(7)

criteria for forest conditions. However, photograph-based stratification process was laborious and expensive (Kim

et al ., 1989). Since aerial photographs were mainly used to estimate areas for different stratifications by forest conditions, the characteristics of the forest conditions would not contribute to the precision of estimates.

In the given artificial forest population, the differences in mean and variance of growing stock between strata are similar (Table 5), because the forest population was derived from a small number of samples. This means that there is not much benefit to stratifying the given population by forest cover types. If each forest cover type is sub-stratified into age classes which are closely correlated to growing stock, then the benefit of stratifi- cation can be realized.

In pre-stratification procedure, there are several factors utilized for the selection of samples such as stratum weight and stratum size, and sample size under stratified systematic sampling. These factors are sensitive to con- ditions of the strata at a point in time. If the stratification criteria change over time, the factors must change according to the given strata at different times. The strat- ifications can be divided into two types; political units

and ownerships are time-invariant, whereas stratification criteria for forest conditions are time-variant. In the last NFI, the samples were selected depending upon forest conditions so that they may change at a future time.

Considering the objective of the current NFI that pro- vides reliable information about forest resources and monitor their change over time as well, pre-stratification by time-variant variables (e.g. forest types) is inappro- priate to the task of monitoring forest resources for changes (Scott, 1998).

Categorical information about such forest conditions can be obtained through post-stratification. When com- pared to pre-stratification, the variance of the post-strat- ification estimator is higher because strata sizes are estimated. This result was also observed in this study;

post-stratified systematic sample gave more precise than stratified systematic sample (Table 6). It is concluded that post-stratification is to be a very useful and cost- effective approach for large area forest inventories. In order to apply this approach to the Korean NFI, it is nec- essary to have clear definitions of strata per field obser- vation unit (e.g., forest cover types per sub-plot). If an automated process cannot be used to stratify, or if the Table 6. Summary of estimations by sample size under different sampling techniques.

Simple random sampling

Sample size 7320 3250 1830 4600

Mean (m 3 ) 7.0550 7.0570 7.0550 7.0660

Variance 0.0039 0.0095 0.0174 0.0580

SE 0.0600 0.1000 0.1300 0.2400

SE% 0.8900 1.3800 1.8700 3.4100

Grid interval 1 km*1 km 1.5 km*1.5 km 2 km*2 km 4 km*4 km

Stratified systematic sampling

Sample size* 7340 32600 1850 4800

Mean (m 3 ) 7.0560 7.0550 7.0540 7.0720

Variance 0.0038 0.0090 0.0163 0.0673

SE 0.0600 0.0900 0.1300 0.2600

SE% 0.8700 1.3400 1.8100 3.6700

Systematic sampling

Sample size* 7320 3250 1830 4600

Mean (m 3 ) 7.0580 7.0540 7.0630 7.0650

Variance 0.0033 0.0083 0.0162 0.0641

SE 0.0600 0.090v 0.1300 0.2500

SE% 0.8100 1.2900 1.8100 3.5900

Systematic sampling with post-stratification

Sample size* 7320 3260 1830 460

Mean (m 3 ) 7.0560 7.0560 7.0570 7.0670

Variance 0.0032 0.0079 0.0158 0.0644

SE 0.0600 0.0900 0.1300 0.2500

SE% 0.8000 1.2600 1.7800 3.6000

Systematic cluster Sampling

Sample size* 7300 3250 1840 460

Mean (m 3 ) 7.0110 7.0040 7.0080 6.9800

Variance 0.0012 0.0045 0.0071 0.0265

SE 0.0300 0.0700 0.0800 0.1600

SE% 0.4900 0.9500 1.2000 2.3100

Sample size* : mean sample size according to systematic selection

(8)

strata are not clearly defined, not only can it be a dif- ficult and time-consuming task for the field crew, but it may also cause classification errors depending on the interpreter’s decision.

The current NFI has adopted systematic sampling. In this NFI, a sample grid size of 4 km, which is driven by the pre-defined total sample size in the last NFI, has been applied (KFRI, 2006). Although the spatial spacing between samples is an important factor that affects the precision, it was not considered in the allocation of sam- ples, because the total sample size was affected more by the specified precision requirement and budget available.

In terms of forest proportion by region over the country in South Korea, the southwestern region is low flat land with a small forest proportion on average, whereas the northeastern region (in particular, Kyung-Buk and Gang- won provinces) includes highly mountainous areas with a large forest proportion (KFS, 2004a). In this context, there is a need for more research on an appropriate spa- tial spacing based on the forest characteristics of the population and provinces: for example, the sample grid sizes for the German NFI varied by states (BMELV, 2001). The application of varying sample grid sizes via forest proportions is expected to improve the precision at the national and provincial levels.

In South Korea, most of the time within one working day has been spent to reach the samples due to the lim- ited accessibility and hilly and mountainous topography.

According to a pilot time study (KFS, 2004b), the aver- age travel time from an office to a sample is at least two hours. In addition, forest variables of interest in the field increase to provide multi-sources information and then the inventory time per sample is required more than one hour. Consequently, it is hardly possible to measure more than two samples within one working day. In order to reduce the traveling time and obtain more additional information at each sample, a cluster plot as the sam- pling unit was applied. When comparing different plot designs (one element and four elements per cluster), for 184 samples, the one element design requires at least 92 days, whereas the cluster plot design requires only 46 days.

Nevertheless, the difference in sampling error between the two plot designs was small (Table 6).

Conclusion

The scope of the Korean NFI is expanded to support sustainable forest management planning. In this context, forest variables of interest in the field are increasing and therefore the optimum sampling design for field data collection is needed.

If the objective is to obtain estimates for the entire country, systematic sampling is considered to be the

most cost-efficient and practical sampling design. It not only achieves the objective, but the systematic sample is fixed and therefore allows the monitoring of net changes in forest resources over time. Since using a cluster plot reduces traveling costs, it can provide more information at lower cost.

The NFI also provides data and information for the entire country, as well as for different stratifications. In order to obtain stratifications by forest conditions, either ancillary information is required (pre-stratification), or the collected samples have to be post-stratified. While the former may be expensive and time-consuming, the latter might be laborious and the stratification procedure may be indefinite. If forest strata by forest conditions at a field observation level are clearly defined, estimates for different stratifications can also be provided and the precision can be improved by means of a post-stratifi- cation procedure.

Acknowledgement

The authors would like to thank the anonymous reviewers of this paper for their concrete suggestions to improve this paper significantly. This work was carried out with the support of ‘Forest Science & Technology Projects (Project No. S120707L1101104) provided by Korea For- est Service.

Literature Cited

1. Cochran, W.G. 1977. Sampling techniques. 3 rd edition.

John Wiley & Sons. pp.428.

2. Dunn, R. and Harrison, R.A. 1993. Two-dimensional sys- tematic sampling of land use. Applied Statistics 42(4):

585-601.

3. Engeman, R.M., Sugihara, R.T., Pank, L.F. and Dusen- berry, W.E. 1994. A comparison of plotless density esti- mators using Monte Carlo simulation. Ecology 75(6):

1769-1779.

4. European Communities (EC). 1997. Study on European Forestry Information and Communication System. Reports on forestry inventory and survey systems. - Volume 1 (pp.673) and Volume II (pp.655).

5. Federal Ministry of Food, Agriculture and Consumer Protection in Germany (BMELV). 2001. Survey instruc- tions for Federal Forest Inventory II. pp.106.

6. Franco-Lopez, H, Ek, A.R. and Bauer, M.E. 2001. Esti- mation and mapping of forest stand density, volume and cover type using the k -nearest neighbor method.

Remote Sensing of Environment 77: 251-274.

7. Johnson, E.W. 2000. Forest sampling desk reference.

CRC Press LLC. pp.985.

8. Kangas, A.1993. Estimating the attributes of systematic

(9)

cluster sampling by model based inference. Scandina- vian Journal of Forest Research 8: 571-582.

9. Katila, M. and Tomppo, E. 2006. Sampling simulation on multisource output forest maps - an application for small areas. pp. 613-624. In Caetano, M and Painho, M. (eds.), Processing of the 7th International symposium on Spatial Accuracy Assessment in Natural Resources and Environmental Sciences. July 5-7, 2006. Lisboa, Insti- tuto Geográfico Português.

10. Kim, K.D. 1965. Studies on sampling unit. Journal of Korean Forest Society 4: 26-29.

11. Kim, K.D. 1973. On study of forest sampling methods in natural deciduous forest. Journal of Korean Forest Society 17: 35-42.

12. Kim, K.D, Lee, S.H. and Kim, C.M. 1989. Classifica- tion and mapping of forest type using Landsat TM and B & W infrared photographs. Journal of Korean Forest Society 78(3):263-273.

13. Kleinn, C. and Morales, D. 2001. Tree resources out- side the forest project. WP4 Report: Development of sampling strategies. CATIE, Costa Rica. pp.51.

14. Köhl, M., Magnussen, S. and Marchetti, M. 2006. Sam- pling methods, Remote Sensing and GIS Multiresource Forest Inventory. Springer. pp.373.

15. Korea Forest Research Institute (KFRI). 1996. Manual of the fourth National Forest Inventory in South-Korea.

pp.49.

16. Korea Forest Research Institute (KFRI). 2006. Manual of the fifth National Forest Inventory in South-Korea.

pp.34.

17. Korea Forest Service. 2004a. Statistical yearbook of Forestry. pp.424.

18. Korea Forest Service. 2004b. The reorganization of National Forest Inventory System by a change of demands of society and international process for forest

resource III. pp.284.

19. Lanz, A. 2000. Optimal sample design for extensive forest inventory. Dissertation of Swiss federal institute of technology in Zurich. pp.250.

20. Saborowski, J. and Cancino, J. 2007. About the bene- fits of post-stratification in forest inventories. Journal of Forest Science 53(4): 139-148.

21. Scott, C.T. 1998. Sampling Methods for Estimating Change in Forest Resources. Ecological Applications 2:

228-233.

22. Scott, C.T. and Köhl, M. 1993. A method of comparing sampling design alternatives for extensive inventories.

Mitteilungen der Eidgenössischen Forschungsanstalt für Wald, Schnee und Landschaft 68(1): 3-62.

23. Shin, M.Y. and Han, W.S. 2006. Development of a for- est inventory system for the sustainable forest manage- ment. Journal of Korean Forest Society 95(3): 370-377.

24. Tokola, T. and Shrestha, S.M. 1999. Comparison of cluster-sampling techniques for forest inventory in southern Nepal. Forest Ecology and Management 116: 219-231.

25. Yim, J.S., Magdon, P., Kleinn, C. and Shin, M.Y. 2006.

Estimation of forest attributes by integrating satellite imagery and field plot data. pp.131-140. In: Kappas, M., Kleinn, C. and Slobada, B.(Ed.), Global change issues in developing and emerging countries. Proceed- ings of the 2 nd Goettingen GIS and Remote Sensing Days, 4-6. Oct., 2006, Goettingen, Germany.

26. Yim, J.S., Gong, J.S., Kim, S.H. and Shin, M.Y. 2007.

Forest thematic maps and forest statistics using the k - Nearest Neighbor technique for Pyeongchang-Gun, Gangwon-Do. Journal of Korean Forest Society 96(3):

259-268.

(Received October 27, 2008; Accepted January 21, 2009)

수치

Table 1. Summary statistics based on field plot data served as training data (n=191).
Table 4. Applied characteristics for the growing stock and forest cover type maps within the k-NN process.
Figure 2. Relative efficiency for different sampling strategies and different sample sizes, where SRS (simple random sampling), SYS (systematic sampling), Sys+pre (stratified systematic sampling), Sys+post (systematic sampling with  post-stratification), a

참조

관련 문서

내삶을 바꾸는 숲, 숲 속의 대한민국.. KOREA FOREST

key words: forest healing, forest healing factor, forest healing program, forest for healing, urban forest.. 특히 급 격한 도시화 및 산업화에 따라 여가시간

Incheon Metropolitan City's green projects took first place in the 2016 Green Fund Support Program organized by the Korea Forest Welfare Institute. The ‘Eco Garden’ plan

1.7.3 Info sys as a tool for cooperative urban planning - Info sys is a tool for cooperation. - Three layers

In the broad approach, a country would define a system of forest management practices (without the requirement that a specified forest management practice

Table 5.4 Classified Train data in Decision Tree 81 Table 5.5 Classified Train data in Random Forest 83 Table 5.6 Result of Logistic Regression 85 Table 5.7 Classified Train

 The objective of this column is to obtain a purified methanol product at column top and demethanolized stream as a bottom product before releasing into the environment.8.

• In an unbiased sampling scheme with total n samples for these two strata, nP(A) or na samples are used for stratum A and nP(R~A) or n(1-a) are used for stratum R~A..