ABBREVIATIONS
aT : Korea Agro-Fisheries & Food Trade Crop CGIAR : Consultative Group for International Agricultural
Research
CIAT : International Center for Tropical Agriculture FAO : Food and Agricultural Organization
GRiSP : Global Rice Science Partnership IRRI : International Rice Research Institute
MAFRA : Ministry of Agriculture, Food and Rural Affairs of Korea
RDA : Rural Development Administration of Korea SK : Statistics Korea
USDA : United States Department of Agriculture
Rice, globally, is a socially and economically important crop. It is a staple food of more than a half of the world’s population (IRRI et al., 2013). Rice provides 21% of global human per capita energy and 15% of per capita protein (Gnanamanickam, 2009). Today, rice is cultivated in over 100 countries coming from all continents except Antarctica (FAO, 2017a; USDA, 2017). There are about 144 million rice farm families in the world comprising 25% of total world farmers, a significantly large number. In 2016, the rice harvest area was only 8% of the global crop cultivation area but the amount of production was 30% and the economic value was 13% of the world crop value; hence, the amount of production per unit area and the economic value are greater than those of the other crops (CGIAR 2017, IRRI 2017).
Review of Rice: Production, Trade, Consumption, and Future Demand in Korea and Worldwide
Jong-Min Jeong 1 , Eun Chong Kim 2 , Shoba Venkatanagappa 2 , and Jeom-Sig Lee 1,2,†
ABSTRACT Being a staple food for more than half of the population of the world and South Korea, rice is an important crop.
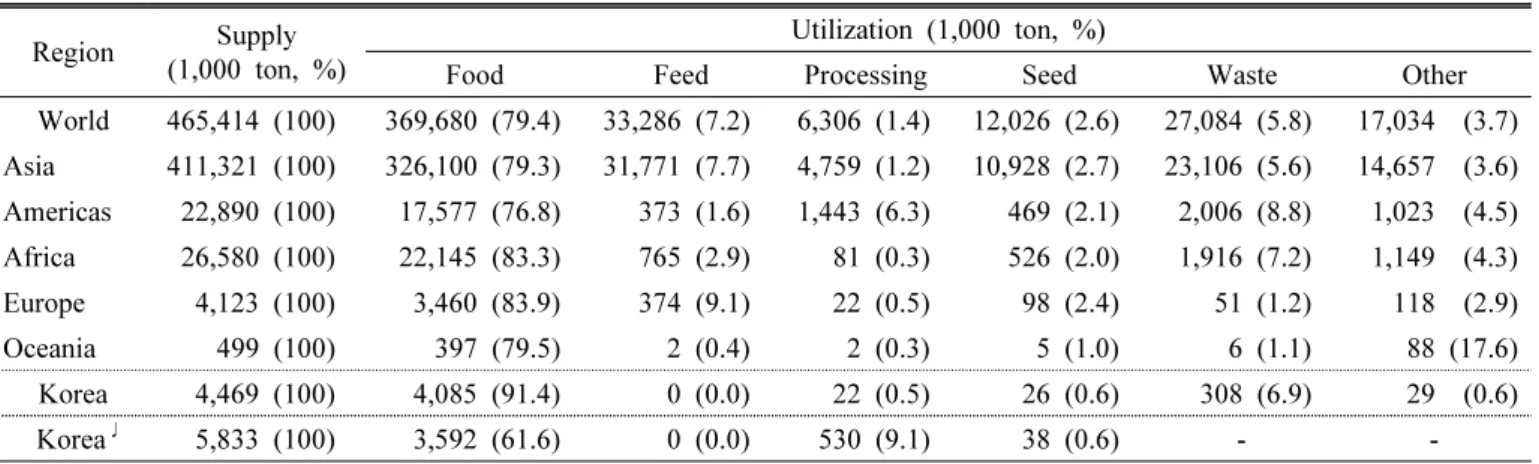
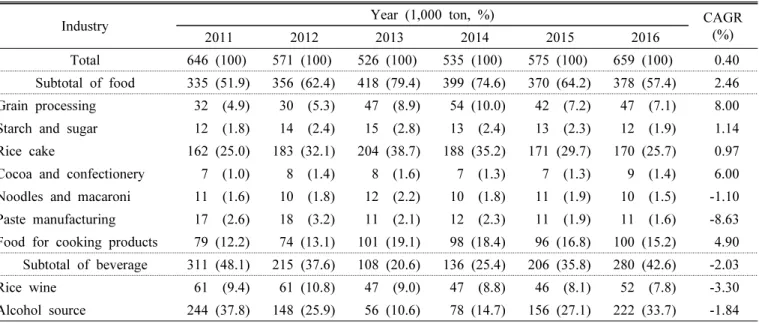
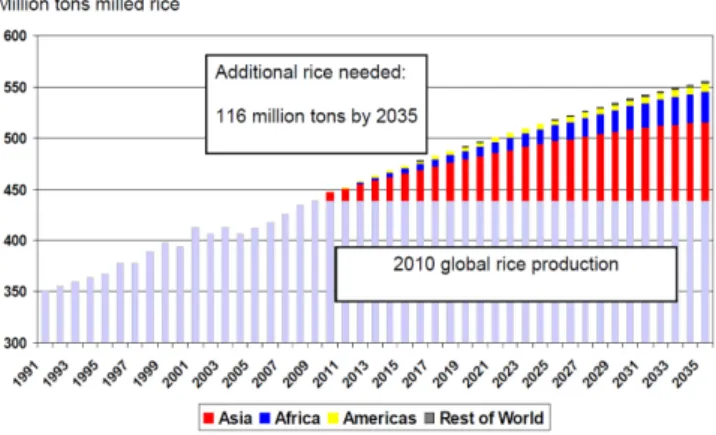
For the past 20 years, global paddy rice cultivation area and production have shown an annual growth of 0.46% and 1.61%, respectively. Global rice consumption for food and processing has increased by 1.37% and 3.68%, respectively. Due to the main reason for such increasing human population, it is expected that from 439 million tons in 2010, additional 116 million tons will be needed in 2035. Global rice imports and exports have doubled in the last 20 years. However, in spite of such increment, global rice exports in 2013 were 8.4% of the total production. It is thought that rice protection policies in the producing countries are the main reason for such small scale of rice trading. In the past 5 years, India recorded the largest growth rate in rice exports (51.4%), whereas China showed the largest growth rate in imports (61.0%). For global utilization of milled rice during the same period, approximately 79.4% was used as food, 7.2% as animal feeds, and 1.4% for processing. Regionally, Asia has shown a similar pattern to the global rice usage, whereas utilization for processing in America, for food in Africa, and for animal feed in Europe was relatively higher than the global rice usage. Korea’s cultivation area and production since the last 5 years, are 0.5% and 0.8%
of those of the world, respectively. Its annual rice export is approximately 3,000 tons, which is 0.01% of the global rice export.
Korea’s rice utilization is high for food and low for feed and for processing relative to global rice utilization. Therefore, a review must be conducted to increase Korea’s utilization of rice for processing and for feed production.
Keywords : consumption, demand, global rice, Korean rice, production, trade
DOI : https://doi.org/10.7740/kjcs.2017.62.3.157Review Aticle
ⓒ 본 학회지의 저작권은 한국작물학회지에 있으며, 이의 무단전재나 복제를 금합니다.
This is an Open-Access article distributed under the terms of the Creative Commons Attribution Non-Commercial License (http://creativecommons.org/licenses/by-nc/3.0) which permits unrestricted non-commercial use, distribution, and reproduction in any medium, provided the original work is properly cited.
1)
National Institute of Crop Science, Rural Development Administration, Jeonju 55365, Korea
2)
Plant Breeding Division, International Rice Research Institute, Los Banos, Philippines
†
Corresponding author: Jeom-Sig Lee; (Phone) +82-31-695-1845; (E-mail) [email protected]
<Received 28 May, 2017; Revised 21 July, 2017; Accepted 27 July, 2017>
Rice in Korea is also a socially and economically important crop. It holds the highest proportion in agriculture and forestry where there are 635 thousand rice cultivating households which comprises 58% of the total farm households. The value of rice production in 2015 was highest being $7.5 billion which is about 16% of the gross agricultural and forestry production value (MAFRA, 2016a). The value-added of rice is approximately twice the total agricultural production value (RDA, 2011). Today’s oversupply of rice is greatly affecting the society of Korea. The main reason is that the decline in rice consumption is higher than the decline in rice supply (production and stocks). In other words, the declining rice consumption and importing of rice has resulted in excess stocks. It has been observed that the Korean rice is facing a crucial turning point where the social problems such as tariffication of rice imports and decreased income of the rice farmers.
This paper reviewed rice production, trade, consumption and demand of the world and Korea over the past 20 years to provide basic information to promote rice consumption and to propose tariff measures on rice imports.
Rice cultivation and production
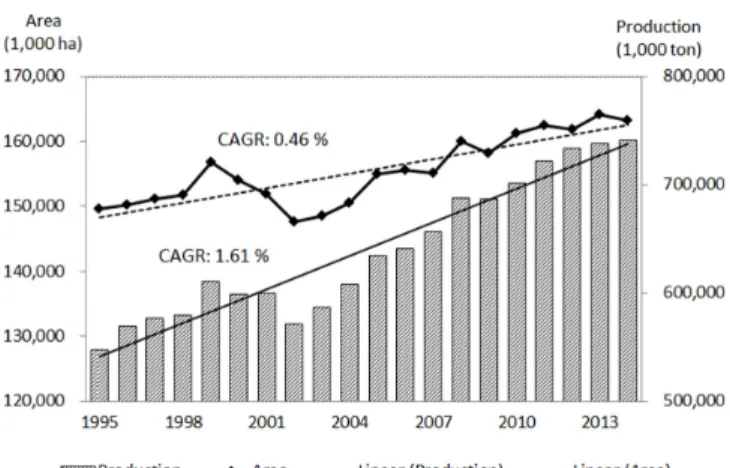
The global paddy rice harvested area for the past 20 years (1995~2014) had been increasing from 149.6 million hectares in 1995 to 163.2 million hectares in 2014, an annual
increase of 0.46% (Fig. 1). The paddy rice production also increased from 547.4 million tons in 1995 to 740.9 million tons in 2014, an approximate increase of 1.61% per year.
Therefore, it is shown that the production increase is affected more by the increase in quantity per unit area than the increase in cultivation area. According to the preceding research, the global paddy rice production increased by 130%
from 1966 to 2000. About 84% of the rice production growth has been attributed to modern framing technologies such as semi-dwarf, early-maturing varieties that can be planted up to three times per year and are responsive to nitrogen fertilizer (Kush, 2004; Maclean et al. 2002). According to the recent report by IRRI et al. (2013), production increased by 2.24% per year from 1961 to 2010 which is comprised of 1.74% by the increase of quantity of production per unit area and 0.49% by the increase of cultivation area. It was concluded that the phenomenon is mostly caused by the increase of production quantity per unit area.
For the last five years (2010~2014), the global paddy rice harvested area was 162.7 million hectares, paddy rice production was 741.5 million tons, and yield was 4.47 tons per hectare (Table 1). The proportion of cultivated area by region was 88.4% in Asia, 6.9% in Africa, 4.2%
in America, 0.4% in Europe, and 0.1% in Oceania. The paddy rice yield per hectare by region in increasing order was Oceania, Europe, America, Asia, and Africa. The paddy rice harvested area and production of Korea were 0.5%
and 0.8% of those of the world respectively. The yield per hectare was higher than the global average but was similar to the nearby nations like China and Japan. On the other hand, it was lower than that of the nations such as USA, Australia, Spain, and Greece and so on.
Today, rice is cultivated on over 100 countries from every continent except Antarctica but the top 10 countries account for 85% of the rice production (FAO, 2017a). Paddy rice production by region is 90% in Asia where one to three countries within this region produce the large part. There- fore, the global rice production is concentrated on some countries among and within the regions. It is assumed that there is a high probability that the supply will be greatly affected if the production decreases in some of the main rice producers due to some reasons such as the climate change in the future.
Fig. 1. Changes in global paddy rice cultivation area and production during the past twenty years. Data Source:
FAOSTAT (1995~2014). Compound annual growth rate
(CAGR %) was calculated from the following formula
(CAGR (%) = (A/B) × 100) ^ (1/N)-1, A = value in
the first year (1995), B = value in the last year (2014),
and N = number of years in a period (20).
Rice trade
The global import and export doubled from 25 million tons and 27 million tons respectively in 1994 to 56 million tons and 64 million tons respectively in 2013 (Table 2).
During the same period, the import increased 4.73% per
year and the export increased 4.43% annually; the average annual growth rate of those was higher than the production growth rate which is 1.71%. Despite such growth rate, the rice export in 2013 is only 8.4% of the total production.
The main reason the global trade of rice is low (20% of Table 1. Global and regional paddy rice harvested area, production and yield during the last five years (2010~2014).
Region and country Harvested area (1,000 ha, %)
Production (1,000 ton, %)
Yield (ton/ha)
World 162,704 (100.0) 727,289 (100.0) 4.47
Asia 143,893 (88.4) 667,023 (90.4) 4.57
India 43,523 (26.7) 155,213 (21.3) 3.57
China 30,168 (18.5) 202,223 (27.3) 6.70
Indonesia 13,507 (8.3) 68,682 (9.4) 5.08
Bangladesh 11,434 (7.0) 51,009 (7.0) 4.46
Thailand 11,577 (7.1) 35,584 (4.9) 3.07
Japan 1,592 (1.0) 10,613 (1.5) 6.67
Americas 6,775 (4.2) 36,683 (5.0) 5.42
Brazil 2,517 (1.5) 12,044 (1.7) 4.80
USA 1,158 (0.7) 9,433 (1.2) 8.18
Colombia 491 (0.3) 2,889 (0.4) 4.30
Peru 383 (0.2) 2,889 (0.4) 7.53
Ecuador 369 (0.1) 1,529 (0.2) 4.15
Africa 11,272 (6.9) 28,076 (3.9) 2.49
Nigeria 2,719 (1.7) 5,215 (0.7) 1.92
Guinea 1,555 (1.0) 1,870 (0.3) 1.20
Madagascar 1,103 (0.7) 4,235 (0.6) 3.86
Tanzania 988 (0.6) 2,303 (0.3) 2.34
Mali 642 (0.4) 2,068 (0.3) 3.38
Europe 682 (0.4) 4,513 (0.6) 6.65
Italy 233 (0.1) 1,485 (0.2) 6.39
Russian 196 (0.1) 1,030 (0.1) 5.23
Spain 116 (0.1) 899 (0.1) 7.75
Greece 31 (0.0) 236 (0.0) 7.53
Portugal 30 (0.0) 178 (0.0) 5.90
Oceania 82 (0.1) 774 (0.1) 9.34
Australia 78 (0.0) 764 (0.1) 9.95
Fiji 3 (0.0) 6 (0.0) 2.51
Solomon 1 (0.0) 3 (0.0) 2.03
Papua New Guinea 0.4 (0.0) 1 (0.0) 1.98
Micronesia 0.1 (0.0) 0.2 (0.0) 1.64
Korea 849 (0.5) 5,620 (0.8) 6.63
Data source: FAOSTAT (2010-2014). The countries belonging to each region were selected from the top five countries based
on the harvested area except Japan.
wheat and 10% of corn) was reported as following: firstly, the tendency of instant consumption of rice in the place of production; secondly, the implementation of strict price assistance and food policies on import and export to the producers for food security of the Asian countries that produce around 90% of rice; lastly, the subdivision of rice according to the ecotype (Indica, Japonica, Jasmine), intensity of processing (paddy rice, steamed rice, rice), and quality grade (broken rice ratio) (Muthayya et al., 2014; IRRI et al., 2013).
Especially, the market for Japonica, favorite medium-short grain rice, is only 10% of the overall rice trade (RDA 2011).
By observation, the reason for such low trading of Japonica rice is because of its low production (10% of the overall rice production) and preference limited to nations like Korea, Japan, and some parts in Europe.
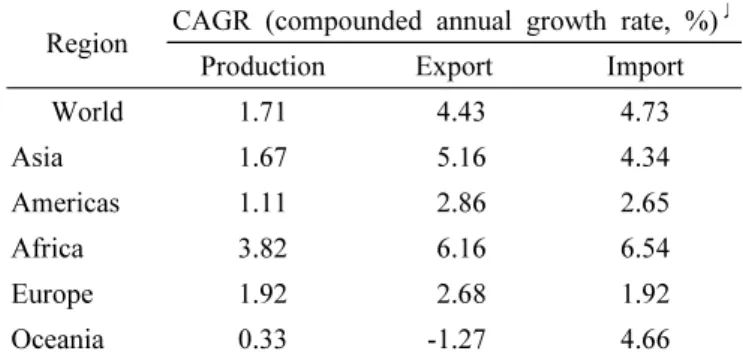
The average annual growth rate of export and import in Africa is 6.16% and 6.54%, respectively, which are greater than the average global export (4.43%) and import (4.73%) (Table 3). Such high increase of average annual growth rate is caused by the growth of rice consumption per capita from 15 kg in 1970 to 39 kg in 2013 in Western Africa where rice became an important food resource next to cassava and corn (FAO, 2016; IRRI et al., 2013). On the other contrary, export in Oceania decreased by 1.27% and import increased by 4.66% annually. This resulted from the decrease in rice production of Australia which produces 90% of the rice in Oceania.
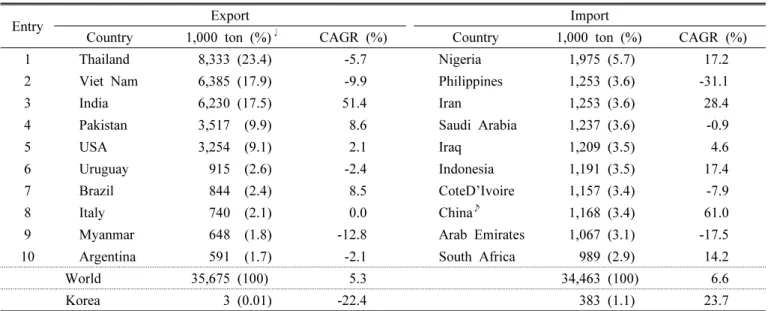
The import and export of milled rice during the last 5 years (2009~2013) of top 10 countries is shown in Table 4.
The average annual growth rate of export is highest in India (51.4%) while import is highest in China (61.0%).
Thailand, Vietnam, and India makes up 59% of the global export while 9 countries including Nigeria, Philippines, Iran, and China imported more than a million tons in a year.
During the same period, Korea exported 3 thousand tons of milled rice a year which is equivalent to 0.01% of the global export and imported 383 thousand tons which is 1.1% of the global import. The declination of the average annual growth rate of export by 22.4% is because the export decreased from 4.5 thousand tons in 2009, the year that had highest export, to 1.7 thousand tons in 2013.
However, the export increased to 2.4 thousand tons in 2016 and still in its slowly increasing trend (aT 2017).
Changes in ranking of major countries in milled rice import and export since 1990 to present are shown in Table 5.
Table 3. Compared with the compounded annual growth rate by region for paddy rice supply and trade during the last twenty years (1994~2013).
Region CAGR (compounded annual growth rate, %)
♩Production Export Import
World 1.71 4.43 4.73
Asia 1.67 5.16 4.34
Americas 1.11 2.86 2.65
Africa 3.82 6.16 6.54
Europe 1.92 2.68 1.92
Oceania 0.33 -1.27 4.66
Data source: FAOSTAT (1994~2013).
Table 2. Changes in global paddy rice supply and trade during the last twenty years (1994~2013).
Year Production
(1,000 ton)
Export (1,000 ton, %
♩)
Import (1,000 ton, %)
1994 538,309 27,276 (5.1) 25,029 (4.7)
1995 546,944 34,334 (6.3) 31,133 (5.7)
2000 598,425 36,281 (6.1) 32,585 (5.5)
2005 633,771 45,738 (7.2) 41,202 (6.5)
2010 700,923 52,467 (7.5) 47,142 (6.7)
2013 742,800 62,144 (8.4) 56,401 (7.6)
CAGR (%)
♪1.71 4.43 4.73
Data source: FAOSTAT (1994~2013).
♩
(%) was calculated the percentage of each value relative to production.
♪CAGR (%): Compound annual growth rate.
Thailand had the highest rank in export until 2010, but India has become the highest ranker in 2013. Brazil was the major milled rice importing county but ranked 7th in the export in 2013. Moreover, China was a major exporter
and importer but imported the most during the year 2013.
In the global milled rice export and import, Korea con- tributed 0.1% and 1.1% respectively. The increase of milled rice import in Korea is due to the Minimum Market-Access Table 4. Top ten countries of milled rice import and export during the last five years (2009~2013).
Entry Export Import
Country 1,000 ton (%)
♩CAGR (%) Country 1,000 ton (%) CAGR (%)
1 Thailand 8,333 (23.4) -5.7 Nigeria 1,975 (5.7) 17.2
2 Viet Nam 6,385 (17.9) -9.9 Philippines 1,253 (3.6) -31.1
3 India 6,230 (17.5) 51.4 Iran 1,253 (3.6) 28.4
4 Pakistan 3,517 (9.9) 8.6 Saudi Arabia 1,237 (3.6) -0.9
5 USA 3,254 (9.1) 2.1 Iraq 1,209 (3.5) 4.6
6 Uruguay 915 (2.6) -2.4 Indonesia 1,191 (3.5) 17.4
7 Brazil 844 (2.4) 8.5 CoteD’Ivoire 1,157 (3.4) -7.9
8 Italy 740 (2.1) 0.0 China
♪1,168 (3.4) 61.0
9 Myanmar 648 (1.8) -12.8 Arab Emirates 1,067 (3.1) -17.5
10 Argentina 591 (1.7) -2.1 South Africa 989 (2.9) 14.2
World 35,675 (100) 5.3 34,463 (100) 6.6
Korea 3 (0.01) -22.4 383 (1.1) 23.7
Data source: FAOSTAT (2009~2013).
♩
(%): Represents the ratio of each country’s exports and imports to the world.
♪China: China mainland.
Table 5. Changes in ranking of major countries in milled rice import and export over the last twenty years (1990~2013).
Country Ranking
♩of export by year
Country Ranking of import by year
1990 2000 2010 2013 1990 2000 2010 2013
India 6 6 5 1 China - - 8 1
Thailand 1 1 1 2 Nigeria - 5 2 2
Viet Nam 3 2 2 3 Iran 2 3 5 3
Pakistan 4 5 3 4 Benin - - - 4
USA 2 4 4 5 Iraq 6 2 6 5
Uruguay 9 7 7 6 South Africa - - - 6
Brazil - - - 7 Saudi Arabia - 4 4 7
Italy 5 8 6 8 Senegal 4 - - 8
Argentina - - - 9 Malaysia 9 10 7 9
Myanmar - - - 10 CoteD’Ivoire 7 - 9 10
Egypt - - 8 - Philippines 1 8 1 -
China 8 3 9 - Brazil 3 9 10 -
Australia 7 9 - - Bangladesh 5 - - -
%
♪88.0 88.8 85.5 87.5 %
♪28.3 38.1 37 38.7
Korea (1,000 ton) 0.5 0.1 3.8 1.5 Korea (1,000 ton) 2 155 321 580
Data source: FAOSTAT (1990~2013).
♩