pISSN 1229-3008 eISSN 2287-6251
Progress in Superconductivity and Cryogenics
Vol.17, No.2, (2015), pp.41~44 http://dx.doi.org/10.9714/psac.2015.17.2.041
```
1. INTRODUCTION
High-temperature superconducting (HTS) coil is widely used in many applications because of its high critical current density in low temperature[1, 2]. However, HTS coil has a disadvantage in aspect of thermal conductivity compared to low-temperature superconductors (LTS) [3].
Low thermal conductivity of HTS makes heat concentrate easier. When superconducting-to-normal (S/N) transition occurs, current flowing through normal zone generates heat because of resistance and heat generation is accelerated as S/N transition progresses. Heat concentration can cause partial burn-out in the HTS applications[4, 5].
Critical current (Ic) of the HTS coil is affected by density distribution and direction of magnetic field[6]. When the dimension and operating current of the coil is fixed, density distribution and direction of the magnetic field around the coil can be calculated. If the HTS tape has homogeneous Ic distribution characteristic, quench will occur almost fixed point. But in real experiments, burn-out point in the HTS coil varies in wide range even if the HTS coil doesn’t have any damages or defects. That is because HTS tape cannot have homogeneous Ic characteristic. In this case, if central limit theorem is applied to Ic
distribution of HTS tape, the point which has the highest possibility to initiate S/N transition can be predicted stochastically.
In this paper, statistical analysis about initiation of S/N transition is performed by MATLAB when the Ic of the
HTS tape has Gaussian distribution along its length. After applying Gaussian distribution for the coil, Ic of entire coil will be calculated. By iterating large enough trials of calculation for virtual random coil, it can be verified that if mean and standard derivation of Ic are known, the layer where S/N transition is initiated can be predicted statistically. Small size of single pancake HTS coil is modeled and Ic-B data of YBCO is used as reference.
2. NUMERICAL CALCULATION 2.1. Calculation method
To calculate Ic distribution in the HTS coil, finite element method (FEM) is used. Superconducting layer is divided into many meshes. After meshing the layer, Jc for each mesh is calculated by generalized Kim model. The equation for generalized Kim model[7] is
𝐽𝑐(𝐵) = 𝐽𝑐0/(1 +𝐵𝐵
0)𝛽 (1)
where Jc0 = 2.5 x 10¹⁰ A/m2, B0 = 0.13 and β = 0.743. All the parameters are calculated based on an average of the measured Jc(B,θ) data between 0 - 0.7 T for a short sample of SCS4050 2G HTS wire at 77 K. Additional information for the equation (1) is in ref. [7]. With dimension parameters and operating current of the HTS coil, the magnetic field for each mesh can be calculated by
Statistical analysis for HTS coil
considering inhomogeneous I
cdistribution of HTS tape
Hongwoo Jin, Jiho Lee, Woo Seung Lee, and Tae Kuk Ko* Yonsei University, Seoul, Korea
(Received 23 February 2015; revised or reviewed 15 June 2015; accepted 16 June 2015)
Abstract
Critical current of high-temperature superconducting (HTS) coil is influenced by its own self magnetic field. Direction and density distribution of the magnetic field around the coil are fixed after the shape of the coil is decided. If the entire part of the HTS tape has homogeneous Ic distribution characteristic, quench would be initiated in fixed location on the coil. However, the actual HTS tape has inhomogeneous Ic distribution along the length. If the Ic distribution of the HTS tape is known, we can expect the spot within the HTS coil that has the highest probability to initiate the quench. In this paper, Ic distribution within the HTS coil under self-field effect is simulated by MATLAB. In the simulation procedure, Ic distribution of the entire part of the HTS tape is assume d to follow Gaussian-distribution by central limit theorem. The HTS coil model is divided into several segments, and the critical current of each segment is calculated based on the-generalized Kim model. Single pancake model is simulated and self-field of HTS coil is calculated by Biot-Savart’s law. As a result of simulation, quench-initiating spot in the actual HTS coil can be predicted statistically. And that statistical analysis can help detect or protect the quench of the HTS coil.
Keywords: critical current, HTS coil, Ic distribution, self-field degradation, quench detection
* Corresponding author: [email protected]
Statistical analysis for HTS coil considering inhomogeneous Ic distribution of HTS tape
TABLEⅠ
SPECIFICATION OF THE SIMULATED HTS COIL.
Parameters Value
HTS Conductor YBCO
Conductor width; thickness 4.8 mm; 0.2 mm
HTS layer thickness 1 μm
Inner Radius 65 mm
Outer Radius 71 mm
Height 4.8 mm
Ic of HTS tape 120 A
Turns 30
Operating current 75 A
Fig. 1. Magnetic field vector around single pancake HTS coil.
Fig. 2. Ic-B data from AMSC for Amperium HTS tape.
Biot-Savart’s law. In calculation procedure, azimuthal directional length is divided into 10 meshes and axial directional length is divided into 30 meshes because the width of the HTS tape is much longer than the thickness of superconducting layer. By integrating Jc of each mesh, Ic
value for each layer can be calculated. Because single pancake coil is symmetric with respect to z-axis, the magnetic field around the HTS coil is also symmetric. It can be assumed that all the points along same layer have same Ic value when HTS tape has homogeneous Ic
characteristic. For entire calculation procedure, it is assumed that S/N transition initiates from the point which has the lowest Ic value. That is because if the point has the lowest Ic value, that point should have the highest voltage inevitably. The specification for simulated HTS coil is in TableⅠ. Most of parameters are randomly chosen. Fig. 1 is visualized magnetic field around the HTS coil in
Fig. 3. Ic degradation caused by self-field on homogeneous HTS coil.
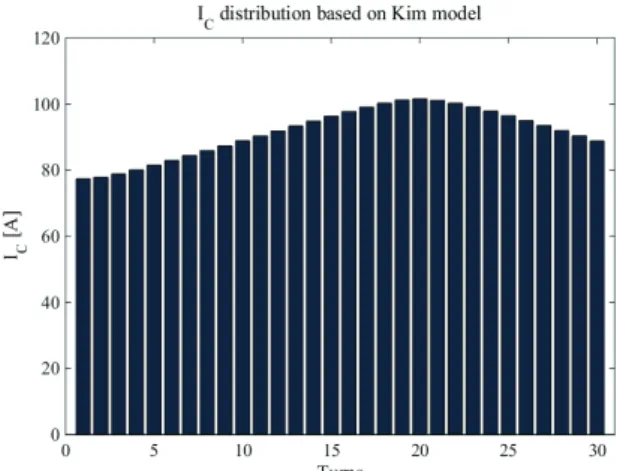
Fig. 4. Ic distribution of homogeneous HTS coil.
cylindrical coordinate. Length of the arrow represents the intensity of magnetic field.
2.2. HTS tape with homogeneous Ic distribution
First, the HTS tape is assumed to have homogeneous Ic
characteristic over its entire part. Then, Ic distribution in the HTS coil is only affected by the magnetic field if it doesn’t have any damage or external defects. To figure out the effect of the magnetic field only, Ic-B data for Amperium YBCO HTS tape from AMSC is used as a reference[8]. Even if the parameters from SCS4050 2G HTS wire is used in eq. (1), it is reasonable to use the data from AMSC wire in this section because both wires are based on YBCO superconducting layer and Ic-B degradation plots for both wires are very similar to each other. All the Ic-B data are exponentially fitted because few numbers of data are provided. Plots of the data are shown in Fig. 2. The effect of magnetic field is visualized on Fig.
3. The colorful rectangle is the cross section of 30 turn homogeneous single pancake HTS coil. Values beside color bar are normalized Ic [Ic(B,T)/Ic(0,77 K)] value. The width of HTS tape is divided into 20 segments along r-axis to calculate Ic of each part in HTS coil. Each segment is dealt as independent superconductor. The part which has the highest Ic gets yellow color and it goes to blue color as the Ic of the part decreases. In this simulation, the Ic of the inner most layer shows the weakest normalized Ic value.
42
Hongwoo Jin, Jiho Lee, Woo Seung Lee, and Tae Kuk Ko
Fig. 5. S/N transition initiating point by turns.
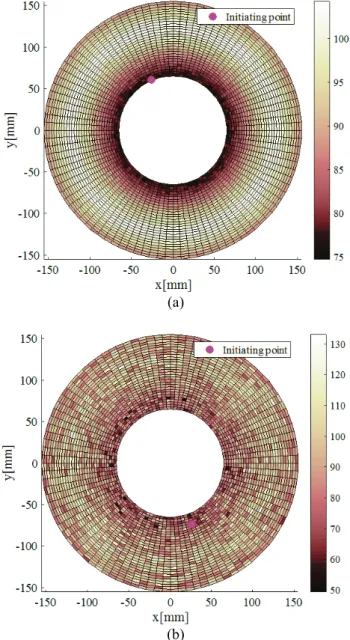
(a)
(b)
Fig. 6. Overview of HTS coil Ic distribution which has standard deviation of (a) 1 A (b) 10 A.
Fig. 4 represents Ic of each layer in the homogeneous coil. This value is calculated with generalized Kim model.
1 means the inner most layer and 30 means the outer most
(a)
(b)
Fig. 7. Ic distribution for each layer which has standard deviation of (a) 1 A (b) 10 A.
layer. The inner most layer has the lowest Ic value (77.4 A).
This is same result with the simulation performed with Ic-B data from AMSC. That means if HTS tape has ideally homogeneous Ic distribution for its entire part, S/N transition always occurs at the inner most layer as long as other factors doesn’t affect to the HTS coil.
2.3. HTS tape with Gaussian Ic distribution
To apply Gaussian distribution to Ic of HTS coil, the mean of Ic distribution is selected as 120 A which is same with Ic of the HTS tape. To confirm the difference caused by standard deviation, three kind of standard deviation is selected; 1 A, 5 A, 10 A. To calculate Ic values distributed in the coil, the coil is divided into 100 segments along azimuthal direction. With same specification, the calculation is iterated 10000 times which is considered as large enough number. Fig. 5 shows the number of the S/N transition initiation out of 10000 trials for each layer. As the standard deviation of the HTS tape gets lower, S/N transition usually initiates from inner layer. However, if standard deviation of the tape is large enough, it is possible that S/N transition initiates from outer layer. To confirm 43
Statistical analysis for HTS coil considering inhomogeneous Ic distribution of HTS tape
the effect of standard deviation, overview of Ic distribution for randomly selected coil is shown in Fig. 6. For better demonstration of the coil, the thickness of the tape is multiplied by 3 in Fig. 6. (a) and (b) have 1 A and 10 A of standard deviation respectively. Initiating point means the mesh which has the lowest Ic value. When standard deviation of tape is 1 A, dark meshes are concentrated inner side of the coil. However, when standard deviation of the tape is 10 A, dark meshes are observed all around the coil even in the outer most layer. Fig. 7 represents Ic
distribution for each layer of random coil. The lowest Ic
value of each turn from the data of Fig.6 is selected as the Ic
value of each turn. It is very similar to homogeneous coil when standard deviation is 1 A. The lowest Ic mesh appears first or second layer in most case. It is same result with Fig.
5. However, when standard deviation is 10 A, Ic of each layer fluctuates very much. In this sample, 2nd, 5th, 8th layer have similar value which can cause S/N transition. That shows initiation range of S/N transition change with the characteristic of the HTS tape.
3. CONCLUSION
Statistical analysis about Ic distribution of HTS coil which follows Gaussian distribution is performed. It is verified that Ic distribution changes if the parameters of the tape is changed. If the distribution parameters of the coil can be obtained, quench detection and protection can be supported because the stochastic range of quench can be calculated with this analysis. Even if the single values of the parameters are used in this paper, it can be generalized by changing the parameters. Furthermore, accuracy of the result can be improved by getting more precise Ic-B data or Ic calculation method. However, in this study, it is assumed that Ic distribution of the HTS wire is Gaussian distribution along its length. Therefore further study in case that HTS wire has another Ic distribution is needed to apply this study on real applications.
REFERENCE
[1] L. Xiao et al., "Fabrication and Tests of a 1 MJ HTS Magnet for SMES," IEEE Transactions on applied superconductivity., vol. 18, No. 2, 2008.
[2] J. Bascuñán et al., "An LTS/HTS NMR Magnet Operated in the Range 600-700 MHz," IEEE Transactions on applied superconductivity., vol. 17, No. 2, 2007.
[3] J. Lehtonen, R. Mikkonen and J. Paasi, "A numerical model for stability considerations in HTS magnets," Supercond. Sci. Technol., vol. 13, pp. 251-258, 2000.
[4] K. W. Nam, C. J. Lee, D. K. Park, T. K. Ko and B. Y. Seok,
"Thermal and Electrical Analysis of Coated Conductor Under AC Over-Current," IEEE Transactions on applied superconductivity., vol. 17, No. 2, 2007.
[5] S. P. Virostek, M. A. Green, F. Trillaud and M. S. Zisman,
"Fabrication, Testing and Modeling of the MICE Superconducting Spectrometer Solenoids," IPAC’10, Kyoto, Japan, May. 2010.
[6] Yuri V. Cherpak et al., "Critical Current Density of HTS Single Crystal YBCO Thin Films in Applied dc Field," IEEE Transactions on applied superconductivity., vol. 15, No. 2, 2005.
[7] Mark D. Ainslie, D. Hu, J. Zou and David A. Cardwell, "Simulating and the In-Field AC and DC Performance for High-Temperature Superconducting Coils," IEEE Transactions on applied superconductivity., vol. 25, No. 3, 2015.
[8] http://www.amsc.com/library/AMPIcBT_AN_A4_0112.pdf
44