Competition Analysis to Improve the Performance of Movie Box-Office Prediction
Guijia He
†⋅Soowon Lee
††ABSTRACT
Although many studies tried to predict movie revenues in the last decade, the main focus is still to learn an efficient forecast model to fit the box-office revenues. However, the previous works lack the analysis about why the prediction errors occur, and no method is proposed to reduce the errors. In this paper, we consider the prediction error comes from the competition between the movies that are released in the same period. Our purpose is to analyze the competition value for a movie and to predict how much it will be affected by other competitors so as to improve the performance of movie box-office prediction. In order to predict the competition value, firstly, we classify its sign (positive/negative) and compute the probability of positive sign and the probability of negative sign. Secondly, we forecast the competition value by regression under the condition that its sign is positive and negative respectively. And finally, we calculate the expectation of competition value based on the probabilities and values. With the predicted competition, we can adjust the primal predicted box-office. Our experimental results show that predictive competition can help improve the performance of the forecast.
Keywords : Movie Box-Office, Box-Office Prediction, Performance Improvement, Competition Analysis, Competition Prediction
영화 매출 예측 성능 향상을 위한 경쟁 분석
하 귀 갑
†⋅이 수 원
††요 약
영화 매출에 대한 연구가 많이 있었지만 공통적인 핵심주제는 영화 매출에 대한 효율적인 예측모델을 훈련하는 것이다. 그러나 과거의 연구 에서는 예측 오차를 발생시키는 요인에 대한 분석이 부족하여 이러한 오차를 줄이는 방법에 대한 연구가 이루어지지 않았다. 본 연구에서는 같 은 시기에 개봉되고 있는 영화들 간의 영향이 예측 오차에 대한 주요인이라는 가정하에 한 영화가 다른 경쟁영화에서 영향을 받는 정도(경쟁 값)를 분석하여 영화매출예측 성능을 향상시키는 것을 목표로 한다. 경쟁값을 예측하기 위하여, 먼저 경쟁값의 극성(양수/음수)에 대해 분류하 고 양수의 확률과 음수의 확률을 계산한 다음 회귀분석을 이용하여 양수인 값과 음수인 값을 예측한다. 마지막으로, 확률값과 예측값을 통하여 경쟁값의 기댓값을 계산하여 초기 예측된 매출을 보정한다. 실험 결과에 의하면 제안 방법을 통하여 영화 매출 예측의 정확도가 향상됨을 알 수 있었다.
키워드 : 영화 매출, 매출 예측, 성능 향상, 경쟁 분석, 경쟁 예측
1. Introduction
1)The movie industry is of high risk due to its unpredictability. The budget of a movie generally covers millions, tens of millions of dollars and sometimes even more. However, a big-budget film may fail to recover its cost while a small-budget film may become a black horse.
†비 회 원 : 숭실대학교 컴퓨터학과 박사과정
††정 회 원 : 숭실대학교 소프트웨어학부 교수 Manuscript Received : June 29, 2017 First Revision : July 28, 2017 Accepted : August 18, 2017
* Corresponding Author : Soowon Lee([email protected])
Therefore, in order to control the costs and to reduce investment risks, an urgent problem is how to forecast the box-office revenues of a movie.
In the last decade, a lot of methods are proposed to
analyze or predict the movie revenues. However, the
prediction models proposed in previous studies remain two
problems. The first one is whether a single model can fit all
movies well. He and Lee have talked about it in their article
[1], and they attempted to solve the problem by learning
multiple models (Multi-model). The other problem is
whether there exists a competitive relation among the
movies that are launched in the same period and whether
the competition can influence the gross revenue of movies.
The movie, “Warcraft: The Beginning”, is one of the most popular movies in 2016. An interesting thing is that the original release date of the movie was set on March 11, 2016, but then it was pushed back three months and set on June 16, 2016. This was primarily down to the fact that Disney announced, “Star Wars: Episode VII - The Force Awakens” would be launching on the same date. This instance shows that the competition from other movies in the same launch period would influence the box-office revenues. Unfortunately, nearly all previous studies did not consider the competition as one part of their prediction models.
In this work, we suppose the error of a primal forecast model (e.g., Multi-model) is caused by the competition between movies. Hence, our purpose is to build an adjustment model to correct the results of the primal forecast model by predicting the competition. With the predicted competition, we can further reduce the prediction errors. The main contribution of this paper is to propose an adjustment model to quantitate the competition between the movies so as to reduce the prediction error of movie box-office. To the best of our knowledge, this is the first study that shows how to predict and quantitate competitive influence of movies.
The contents of this paper are organized as follows. The next section reviews some previous studies about movie box-office gross prediction. Then the architecture of our system and the proposed method are described in the third section. In the experiment section, we explain detailed procedure of the adjustment model, and then we compare our results with the previous research. Finally, we conclude our work in the last section.
2. Related Work
In this section, first we review some of previous works, and then, we illustrate our competition analysis research, that is the main difference between our research and previous works.
2.1 Box-office Prediction
The basic idea of the box-office prediction method is that the movie itself can determine its destiny, that is its gross revenue. An earlier research to predict box-office revenues of movies using metadata is reported by Simonoff and Sparrow [2]. They crawled the metadata of movies from an Online movie database named IMDB (www.imdb.com). And then they conducted two experiments, prediction prior to
release and after the first weekend of release. Meanwhile, they divided their dataset into two groups according to whether the number of screens is more than 10. They found that the accuracy of predictions obviously increases after the first weekend of release for the movies opening on more than 10 screens. Although the division according to 10 can explain their dataset to some extent, it is not a standard division for other datasets. Hence, an automatic partition method is needed to apply to an arbitrary dataset. Inspired by Simonoff’s study, in He and Lee’s research [1], they utilized EM (Expectation Maximization) algorithm to automatically divide dataset into several groups. And thenfor each group, they learned an independent model.
When to forecast box-office of a movie, they selected the most appropriate one from the learned models and predicted its revenues. Moreover, Vany and Walls analyzed the relation between star power and movie box-office gross [3].
And in Sharda and Delenstudy [4], the forecasting problem is converted into a classification problem based on neural networks.
Besides above, some researchers tend to forecast movie box-office revenues by combining social data. The social- based method considers that the gross revenue of a movie would be affected not only by the movie itself but also by public participation [5]. Social data influences movie revenues mainly in two ways: volume and valence. The volume means the total number of times that a movie occurs on the Internet (e.g. news). The valence stands for the polarity of the sentiment of the public, positive or negative for example. Liu [6] and Duan et al. [7] named social data as word-of-mouth (WOM) and examined how it helps explain box-office revenue of movies. Besides them, Zhang and Skiena predicted movie gross through news analysis [8].
Liu et al. built a model named ARSA using blogs to predict sales performance in movie domain [9]. Asur and Huberman used the chatter from Twitter to forecast box-office revenues for movies [5]. In contrast, Joshi [10] and Yu [11]
paid their attention to analyzing movie reviews. Moreover, Ding et al. [12] made a prediction for movie video popularity, and they found that the sentiment propagation is very important and helpful for the prediction. Similarly, Kim et al.
[13] conducted a series of experiments to forecast box-office using machine learning algorithms based on social data.
Furtherly, according the latest report from Bhave et al [14], the integration of both the metadata and the social data can lead to more accuracy.
2.2 Competition Prediction
With the help of text mining and sentiment analysis
Fig. 1. Architecture and Process of our System techniques to handle the social data, above reports
demonstrated that social data can help forecast movie revenues. In our work, we also use the social data to help increase the prediction precision, but there are some differences in our work from previous works.
The first one is we do not use the social data to directly forecast the box-office gross. The reason is that we think the movie itself can tell more. Because the metadata of a movie represents its value and the value would be reflected by its revenue. Therefore, we only use the metadata to predict the revenues of a movie. Nevertheless, most of the movies cannot convert its value in to revenues because there exist some contingency factors. We consider them as the competition between the movies that are launched in the same period.
Obviously, social data is a potential variable that can influence the competition. Hence the second difference from previous works is that we build a model using social data to quantitate the competition in our work. By the competition prediction, we can adjust the predicted value based on the metadata so as to increase the forecast precision.
The concept of competition has been mentioned in Sharda’s paper [4]. However, the definition of competition is very different between their work and our work. In their work, the competition is defined as three binary pseudo variables (High Competition, Medium Competition, and Low Competition) based on the release month of movies. For example, they assigned ‘High Competition’ to the movies that are released in the months of June and November;
‘Medium Competition’ to the movies released in the months of May, July and December, and ‘Low Competition’ to the movies released in the rest of the months. And then the competition is used as a feature of the classification model.
To some extent, the competition in their study is a variation of the feature ‘release date’ rather than the relation with other movies.
By contrast, in our work, we define the competition as the relationship between the movies launched in the same period, and the relationship would further influence their box-office revenues with each other. Therefore, we conduct an adjustment model to predict the competition so as to improve the prediction performance. In the experiment section, we will show that the adjustment model can yield the better result than that using competition features.
3. System Architecture and Methodology
3.1 Procedures
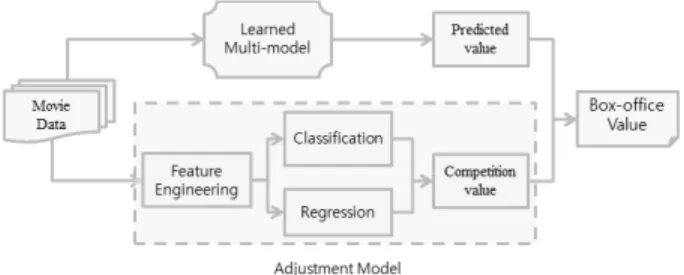
Fig. 1 shows the architecture and process of our system.
The prediction is made by three steps. The first step is to
make a general prediction for each movie based on the Multi-model, a forecast model proposed in He and Lee’s research [1]. And at the second step, we predict the competition value by the adjustment model. With the competition value, at the third step, we further calculate the final box-office revenues using the forecasted competition value. The following parts show the details.
3.2 Multi-model
The Multi-model is proposed by He and Lee in their research [1]. They found that it is not enough to learn only one model for the entire dataset. Therefore, they divided the dataset into several groups by EM (Expectation Maximization) algorithm, and for each group, an independent model is learned. When to predict the box-office of a movie, they select the most appropriate model based on its metadata and make the prediction. In our work, we use their Multi-model to forecast the box-office revenues of movies.
With the predicted results, we conduct the adjustment model in order to make the final prediction by predicting the competition. In addition, the primal forecast model like the Multi-model can be replaced with some other ones.
3.3 Adjustment Model
The predicted value in the above section just represents the box-office gross of movies in the ideal situation.
However, in the market, almost every movie would be influenced more or less. For example, someone would try to watch a movie that obtains many good comments even if the movie is not in his/her plan. Moreover, people nearly cannot watch all of the movies in the same period. Usually, they tend to carefully compare the movies which belong to similar genres and choose one to watch. This situation shows that competition exists among the movies, particularly among the similar movies released in the same period.
1) Definition
In this work, we suppose the prediction errors come from
the competition between movies, and we define the com-
petition as follows.
(1)
Where Multi(x) is the predicted value of our Multi-model and Real(x) is the real box-office revenues of the movie x.
Moreover, screen(x) is the number of screens of a movie at the first weekend. Therefore, the variable competition(x) stands for the error rate caused by other films. Here, we only consider the movies which the number of screens is more than a threshold δ would be influenced by other competitors.
In addition, a positive competition value means over- estimation and a negative value represents the under- estimation. Furthermore, if we know the competition value of a movie, we can calculate the real box-office gross of the movie according to the predicted value of the Multi-model.
Hence, we aim to predict the competition value of a movie using the features defined above.
2) Process
The prediction procedure mainly includes two steps:
classification and regression. The classification step is used to predict the probability of each sign (positive and negative), and the regression step aims to predict the value of the competition. Finally, expected value of the competition can be predicted based on the above results. The details are described as follows.
3) Feature Engineering
In order to predict the competition between movies, we define some variables to quantitate the influence of competition.
a) Sentiment: The sentiment stands for the public opinions and its value ranges from -1 to 1. If the sentiment value of a movie is positive, that means the movie enjoys a good reputation and vice versa. The sentiment analysis is based on the critics' reviews provided in Joshi’s dataset [10]. We calculate the sentiment values according to the presence of polar words in the reviews using SentiWordnet, that is a lexical resource for opinion mining [15].
b) Last-week-more-screen: We suppose that the movies with the number of screens more than a threshold δ would be influenced significantly, while the movies under the threshold would be not. Therefore, this feature records how many movies met the threshold condition in the last week. The movies in the last week may still remain their competitiveness.
c) This-week-more-screen: For a movie, similarly, this feature stands for the number of other movies which screens are over the threshold δ in this week. These movies may become potential competitors.
d) Last-week-less-prediction: Based on the Multi-model, the box-office revenues of movies in the last week can be predicted. Compared with their real gross, we can confirm whether the real gross of a movie is more than the prediction or not. If a movie is underestimated in the last week, the movie may still be a popular and powerful film in this week. Otherwise, it may be powerless. The feature records the number of the movies that are underestimated in the last week.
e) Last-week-more-prediction: As above, the feature counts the number of the movies that are overestimated in the last week.
f) Las-week-similar-movie: For a target movie, in general, the obvious influence may come from similar movies. If a person wants to select a movie of his/her favorite genre to watch, he/she would like to find and compare lots of similar movies. Since most of the movies would continue to be on the show more than two weeks, this feature is used to record how many similar movies are launched in the last week. Here, we consider two movies are similar if they possess a lot of same genres. In our dataset, there are twenty-one genres in total, such as Action, Comedy, Drama, Horror, Science Fiction and so on. Generally, a movie possesses one or several genres. As the following formula shown, Genres
irepresents the set of genres of movie
i, and the similarity is defined as the percentage of common genres in two movies. If the similarity of movie
iand movie
jis more than a threshold θ, we consider the two movies are similar.
∪
∩
(2)
g) This-week-similar-movie: Similarly, the feature describes the number of similar movies that are launched in this week.
4) Classification
The classification step is to make a decision on the sign
of competition values, positive or negative. We train a
decision tree for the classification, and each time we select
the feature that can maximize the entropy gain to divide
the tree. The classification results of a film are the
probability values of positive sign and negative sign. In
addition, the sum of the two probabilities is one.
Feature Value Illustration
Box-office $ 77,073,388 The gross of the movieduring the first weekend Screens 3735 The number of screens
on the first week
MPAA_Rate PG-13
Motion Picture Association of America
rating Genre [Drama, Mystery,
SuspenseThriller]
Twenty-one types in total Highest_Acotrs [Tom Hanks,
Ian Mckellen]
Top 50 highest-grossing actors and actresses Oscar_Actors [Tom Hanks] Winners and nominees Oscar_Directors [Ron Howard] Winners and nominees Release_Date 2006-05-19 The date when the
movie is launched
Holiday [Summer]
Holiday includes Summer, Memorial day,
Christmas day etc.
Reviews
"Da Vinci's"
supporting cast is less successful for a variety of reasons.
The Hollywood mystery of the moment is whether it's going to pay off.
The critics' reviews for the movie are crawled from several web sites.
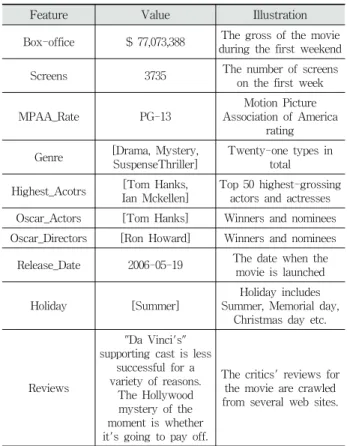
Table 1. An Example of Dataset for Movie “The Da Vinci Code”
5) Regression
The regression step aims to predict the competition value by fitting a line to the training dataset. Since there may exist differences between the movies with a positive sign and the ones with a negative sign, we separately train two linear regression models to make predictions. Concretely, we divide the training dataset into two sets according to the sign of the competition values. Next, we independently train two linear models, the positive regression model, and the negative regression model, from the two sets. And then, for each movie in the test set, we use the two learned models to predict two competition values. One of the values represents the predicted result when the sign of competition is positive and the other one stands for the forecast when the sign is negative.
6) Competition Value
Through the above two steps, we can obtain the probability (classification step) and the value (regression step) of both the positive and the negative competition for a movie. Therefore, we can predict the competition value by its expectation by the following formula 3, where stands for the positive sign and means the negative sign. indicates the probability of competition with the sign, and is the predicted competition value by the regression model with the sign.
With the predicted competition value, we can infer the approximate real value by formula 4.
(3)
(4)
4. Experiments
4.1 Basic Dataset
In this study, we use the dataset provided by Joshi et. al.
in their research [10]. Also, the dataset is used to learn the Multi-model in He’s article [1]. The dataset contains 1718 movies from 2005 to 2009, and each movie includes metadata and reviews, crawled from two websites: Meta-Critic (www.metacritic.com) and The-Numbers (www.the-numbers.
com). Furthermore, the dataset is partitioned into training, development and test sets. Concretely, the training set contains 1147 movies from 2005 to 2007, the development set contains 317 movies in 2008, and the test set contains 254 movies during 2009. Table 1 shows an example of the movie
“The Da Vinci Code”.
4.2 Competition Prediction
With above movie information, we conduct a series of experiments by Java language. Concretely, we use Weka API to learn the classification model and use R API to learn the regression model. In addition, we implement the experiments by the default settings. The details are described as follows.
1) Learning Dataset
Based on the learned Multi-model, we make predictions on the training set and then we calculate the prediction errors. In this work, we consider the errors are caused by the competition between the movies launching at the same period. Therefore, our purpose is to learn a competition (error) model using the training set and to forecast the competition (error) rate of the test set so as to infer the actual values.
Through formula 1, the competition value of each movie in the training dataset can be calculated. Thus, the training dataset can be seen as two parts according to the sign of competition values, the positive set, and the negative set.
For each set, we aim to learn a linear regression model to
fit the competition values. However, there are a lot of
movies which competition value is small. We think they can
not reflect the significant competitive capability and we do
not use them to learn the model. Concretely, for each set, we rank the movies in ascending order according to their absolute competition values. Then we remove the top α percent of movies and only retain the ones with a large absolute competition value. The collected movies are used to learn one classifier and two regression models.
2) Sign Classification
The purpose of the sign classification is to compute the probabilities that the competition value of a movie belongs to the positive sign and the negative sign. In order to give a visualized description about the factors that would influence the box-office for a movie, in our work, we apply the decision tree algorithm to classify the sign of movies.
Fig. 2 shows the generated decision tree.
Fig. 2. Decision Tree of Competition Classification
Fig. 2 shows that the similar movies in this week are very powerful competitors and they would reduce the predicted box-office revenues by Multi-model. Besides that, the movies with more screens are important either. An interesting finding is that if no movies are over predicted in the last week, the target movie may be overestimated.
Because it implies there are some movies which are underestimated in the last week, and they are latent competitors in this week. Moreover, if there are no similar movies both in this week and last week, it is good news because it implies the target movie would earn more revenues. In addition, sometimes the sentiment of public may decide the fate of a movie. In the next step, we will predict the competition value using linear regression models.
3) Value Regression
The competition value is predicted by linear regression models in our work. We learn two regression models: the positive model and the negative model, based on the positive set and the negative set collected above. Thus, when we predict the competition value of a movie, we use the two
regression models to generate two prediction results. The one represents the competition value if its sign is positive, and the other one stands for the value if its sign is negative.
Since we classified the sign of competition value at the last step, we can obtain the probability of each sign. Therefore, the problem of prediction can be converted to calculate the expected value of competition by formula 3. Then we use the expected value to adjust the prediction by Multi-model and to calculate the final prediction of box-office revenues.
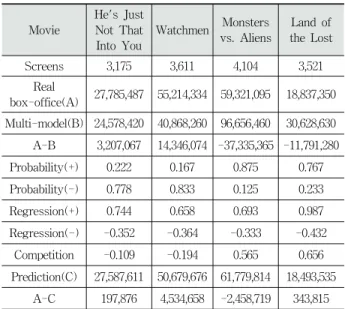
The following Table 2 shows several instances of the calculation procedure.
Movie
He's Just Not That Into You
Watchmen Monsters vs. Aliens
Land of the Lost Screens 3,175 3,611 4,104 3,521
Real
box-office(A) 27,785,487 55,214,334 59,321,095 18,837,350 Multi-model(B) 24,578,420 40,868,260 96,656,460 30,628,630 A-B 3,207,067 14,346,074 -37,335,365 -11,791,280
Probability(+) 0.222 0.167 0.875 0.767
Probability(-) 0.778 0.833 0.125 0.233
Regression(+) 0.744 0.658 0.693 0.987
Regression(-) -0.352 -0.364 -0.333 -0.432
Competition -0.109 -0.194 0.565 0.656
Prediction(C) 27,587,611 50,679,676 61,779,814 18,493,535 A-C 197,876 4,534,658 -2,458,719 343,815
Table 2. Examples of the Calculation
Through the table, there are large gaps between the real box-office revenues and the values forecasted by Multi- model. Fortunately, we can adjust the prediction by the calculated competition value. As shown in the above table, the final results are much better than those predicted by Multi-model, and they are closed to the real box-office revenues.
4) Parameter Selection
There are three parameters in our adjustment model: δ,
α,and θ, where δ represents the number of screens, α means
the deletion percent of movies, and θ stands for the
similarity. In order to choose appropriate parameters, we
perform a grid search and evaluate the performance on the
development set. Concretely, we change δ from 0 to 3000
step by 500, α from 0.05 to 0.4 step by 0.05, and θ from 0.05
to 0.55 step by 0.05. For each combination of the parameters,
we evaluate the correlation and MAE on the development
set. Our goal is to find out the best combination of the
parameters that can maximize the prediction performance on
the development set. And we expect that the best parameters can also achieve the best performance on the test set. Here we define a new evaluation function named importance to assess the performance of the parameters. As shown in the formula 5, the importance is defined according to the classic F-measure [16], and it tries to make a tradeoff between Pearson’s correlation and MAE. Therefore, a large value of importance means the correlation is large and the MAE is small. By calculating the importance of each combination of the parameters on the development set, we select the combination with the highest importance score, and use it to train the adjustment model.
(5)
4.3 Performance Measurement
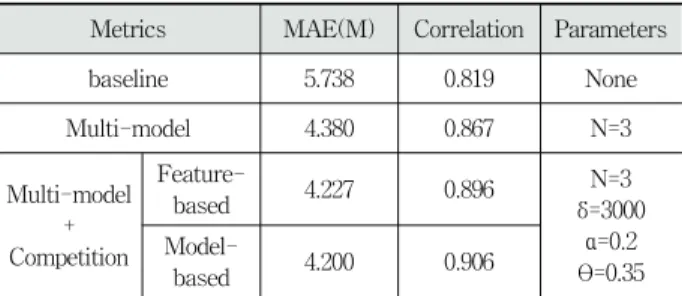
As mentioned above, we consider the competition between movies may influence the box-office revenues, and we aim to adjust the predicted value of Multi-model by forecasting the competition value of each movie. In order to demonstrate the effect of our adjustment model, we compare the prediction values of Multi-model with the results by combining Multi-model and the adjustment model. Due to the dataset we used in this work is provided by Joshi et al.
[10], so it is reasonable to use their work as the baseline. In addition, we conduct an experiment to train a ‘new’
Multi-model by using metadata features along with the competition features. This experiment aims to show whether the adjustment model (model-based) is more powerful than the competition features (feature-based). The comparison results are shown in Table 3.
Metrics MAE(M) Correlation Parameters
baseline 5.738 0.819 None
Multi-model 4.380 0.867 N=3
Multi-model + Competition
Feature-
based 4.227 0.896 N=3
δ