• 검색 결과가 없습니다.

A 1:1 exercise-to-rest period ratio needed by animals to restore energy sources and replenish anti-oxidative status after exercise

N/A
N/A
Protected

Academic year: 2022

Share "A 1:1 exercise-to-rest period ratio needed by animals to restore energy sources and replenish anti-oxidative status after exercise"

Copied!
6
0
0

로드 중.... (전체 텍스트 보기)

전체 글

(1)

http://e-nrp.org

A 1:1 exercise-to-rest period ratio needed by animals to restore energy sources and replenish anti-oxidative status after exercise

Ma-Young Yeom and Youn-Ok Cho

§

Department of Food and Nutrition, Duksung Women's University, 33 Samyangro 144, Dobong-Gu, Seoul, 01369, South Korea

BACKGROUND/OBJECTIVES: Successful recovery of an animal from exercise is essential, especially prior to the next exercise session. This study was conducted to find an effective exercise-to-rest period ratio for the restoration of energy sources and replenishment of anti-oxidative status in tissue after exercise.

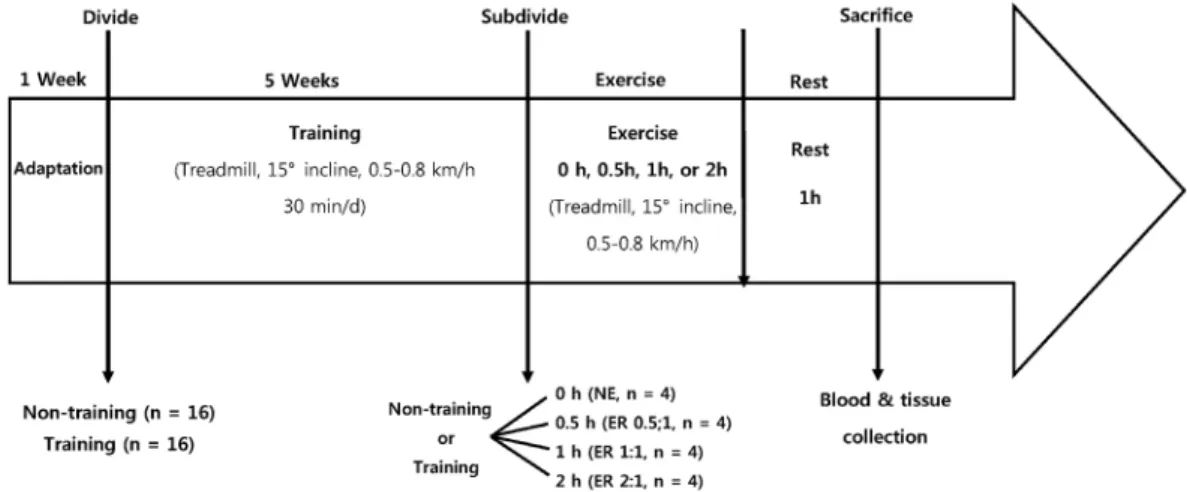
MATERIALS/METHODS: Thirty-two rats were assigned to either non-training or training exercise groups for 5 weeks. After that period, the two groups were subdivided into four smaller groups: non-exercise (NE), exercise 0.5 hour and rest 1 hour (ER0.5:1), exercise 1 hour and rest 1 hour (ER1:1), exercise 2 hours and rest 1 hour (ER2:1).

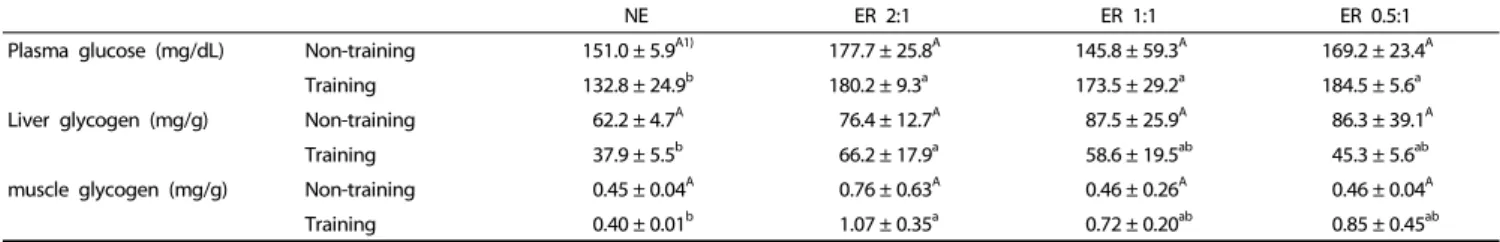
RESULTS: In the training group animals and compared to the NE group, the levels of plasma glucose after the rest period were significantly high in all ER groups but highest in the ER2:1 group. Similarly, the liver glycogen level was highest in the ER2:1 group. The plasma FFA level reached the highest level in the ER2:1 group but was similarly high in the ER0.5:1 group.

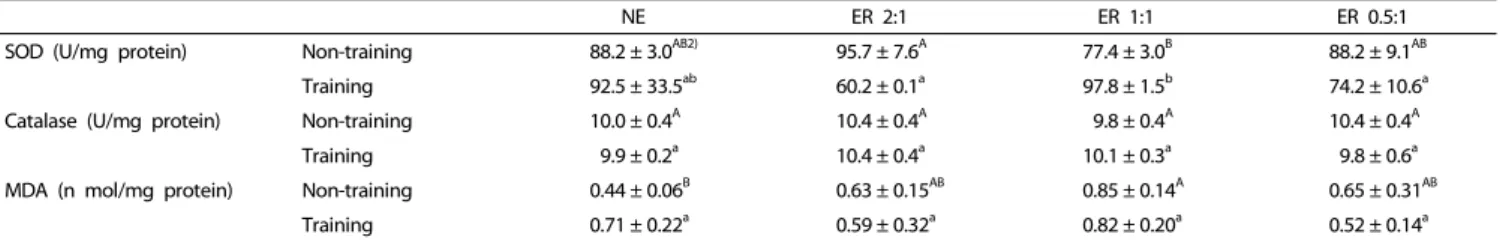
Liver TG level was unchanged in the ER2:1 and ER1:1 groups but was significantly high in the ER0.5:1 group. Muscle TG levels were decreased in all three ER groups. Plasma protein levels were significantly high in the ER2:1 and ER0.5:1 groups. In both training animal and non-training animals, the liver protein levels did not change significantly between the NE and ER groups, irrespective of the exercise-to-rest ratio. In the training animal group, muscle protein level was significantly low in the ER2:1 and ER0.5:1 groups. The activity levels of superoxide dismutase and catalase, as well as the malondialdehyde concentration, were not significantly different between NE and ER groups, irrespective of the exercise-to-rest period ratio.

CONCLUSIONS: These results indicate that animals provided with a 0.5:1 to 1:1 exercise-to-rest period ratio can restore their muscle energy sources and recover their anti-oxidative defense system.

Nutrition Research and Practice 2019;13(1):17-22; https://doi.org/10.4162/nrp.2019.13.1.17; pISSN 1976-1457 eISSN 2005-6168 Keywords: Exercise, rest, restoration, training, energy source

INTRODUCTION 3)

Prior to the next exercise session, rapid recuperation of an already exercised athlete is very important. A major component of such recovery is the restoration of the body’s energy store during rest, but the duration of the rest period is a limiting factor on the effectiveness of recuperation. Fat and carbohydrate are the principal substrates that supply adenosine triphosphate, an energy storage and transport chemical, to skeletal muscle.

If a body does not get sufficient rest after a period of high-intensity exercise, the body will not have sufficient energy available to adequately power the body, and the body will become fatigued, reducing the effectiveness of the power application. Previous research into exercise has focused on exercise intensity and energy partitioning during exercise or on dietary intervention to increase muscle glycogen levels [1-5].

Although indirect bio-indices for substrate utilization and energy expenditure, such as substrate oxidation rate or substrate plasma level, are available [6,7], the appropriate conditions for

recuperation and substrate recovery after exercise have not been fully elucidated. It has been reported that physical training leads to a metabolic adaptation of the exercising muscles to ensure maintenance of an adequate energy supply as well as an acceptable antioxidant defense system status [8,9]. Trained muscles use less glucose and conserve carbohydrate storage;

in contrast, they use more fat, increase fat oxidation, and have an upregulated antioxidant defense system [10,11]. Most fat-source energy requirements of muscle cells during exercise are met by the supply of free fatty acid in plasma and free fatty acid derived from intramuscular triglyceride [12]. The effect of an exercise period on energy substrate utilization may continue for many hours into the subsequent rest period, and during that period, resting lipid metabolism activity is altered [13]. To obtain the best possible recuperation results, for both beginners and advanced athletes, different rest periods between exercise sessions may be needed.

This study investigated the effects of different exercise period-to-rest period ratios on the restoration of stored energy

This research was supported by the 2017 research fund (3000002769) from Duksung Women’s University.

§

Corresponding Author: Youn-Ok Cho, Tel. 82-2-901-8376, Fax. 82-2-901-8372, Email. [email protected] Received: May 11, 2018, Revised: July 4, 2018, Accepted: October 10, 2018

This is an Open Access article distributed under the terms of the Creative Commons Attribution Non-Commercial License (http://creativecommons.org/licenses/by-nc/3.0/)

which permits unrestricted non-commercial use, distribution, and reproduction in any medium, provided the original work is properly cited.

(2)

Fig. 1. Schematic overview of experimental design

sources in tissue and on oxidative system status in rats that underwent previous exercise training and those that did not receive exercise training. The analysis sought to determine the minimum exercise-to-rest ratio for the restoration of stored energy and recuperation of the oxidative system.

MATERIALS AND METHODS Animals and experimental design

Thirty-two 4-week-old male Sprague-Dawley rats (Daehan- biolink Co., South Korea) with an average weight of 100 ± 5 g were randomly assigned into two groups: non-training (n = 16) or training (n = 16). The two groups were maintained for 5 weeks. The training group rats were required to run moderately on a treadmill (Jungdo Bio & Plant, JD-A-09, South Korea) with a 15° incline and moving at 0.5-0.8 km/h for 30 minutes every day for 5 weeks. The non-training group was not subjected to any exercise protocol. All animals were fed the AIN-93G diet. The study protocol was approved by The Committee on Animal Welfare Regulations of Duksung Women’s University, South Korea (2011-108).

At the end of week 5, the training and non-training groups were subdivided into four smaller groups (n = 4 each): one non-exercise (NE) group and three exercise and rest (ER) groups.

The ER groups received different amounts of required treadmill exercise. The exercise period for the ER groups was performed on a treadmill (15° incline, 0.5-0.8 km/h) for 0.5, 1, and 2 hours followed by a 1 hour rest period, thereby forming the ER0.5:1, ER1:1, and ER0.5:1, respectively, exercise-to-rest period ratio groups. Fig. 1 presents a schematic overview of the experimental design.

Collection of samples

The NE group members were sacrificed without performing exercise. The ER group members were sacrificed after a 1 hour post-exercise rest period. Immediately following sacrifice of the animals, plasma was obtained by centrifugation at 3,000 r/min for 10 minutes at 4°C. Liver and skeletal muscle (gastrocnemius muscle) were rapidly removed following sacrifice. All samples were stored at -70°C until analysis.

Biochemical analysis

Energy substrate levels and anti-oxidative status were measured as previously described [14]. Aliquots of the homogenates in cold sodium phosphate buffer (2 mL, 0.02 M, pH 7.0) were analyzed for protein and triglyceride (TG) levels by using a commercial kit (Asan Pharmaceutical Co., Seoul, South Korea).

Plasma glucose, protein, TG, and free fatty acid (FFA) levels were determined by using commercial kits (Youndong Pharmaceutical Co., South Korea; NEFAZYME-S, Eiken Chemical Co., Tokyo, Japan). Catalase activity was determined in plasma by using a commercial kit (Bioxytech Catalase-520). Superoxide dismutase (SOD) activity and malondialdehyde (MDA) level were determined in liver cytosol by using a commercial kit (Bioxytech SOD-525;

Bioxytech MDA-586).

Statistical analysis

All data were analyzed by applying one-way ANOVA in both the non-training and training animal groups. The rationale for using one-way ANOVA was based on the hypothesis that the physiological response to ER would be different between the non-trained and trained groups. Moreover, the use of one-way ANOVA avoided the possible interaction effects between training and ER period when the analysis was done with a two-way analysis. Significant differences between the NE and the various ER groups were determined by using Duncan’s multiple range test. Results were considered statistically significant at P < 0.05.

RESULTS

Carbohydrate energy sources

The effects of the different exercise-to-rest period ratios on

the levels of carbohydrate energy sources are summarized in

Table 1. In the non-training animal group, the level of plasma

glucose after the rest period was not significantly changed

among the test groups. However, in trained animals, plasma

glucose levels were significantly high in the ER2:1, ER1:1, and

ER0.5:1 groups. The liver glycogen level was significantly

increased over that in the NE group only in the ER2:1 group

of training animals, whereas, in the non-training animal group

(3)

NE ER 2:1 ER 1:1 ER 0.5:1

Plasma FFA (μEq/dL) Non-training 355.4 ± 116.0

A1)

480.1 ± 115.0

A

408.2 ± 157.1

A

369.8 ± 98.3

A

Training 229.8 ± 39.8

b

470.5 ± 197.5

a

325.2 ± 103.1

ab

457.1 ± 139.7

a

Liver TG (mg/g) Non-training 311.0 ± 48.9

A

305.5 ± 34.2

A

347.8 ± 74.3

A

292.0 ± 46.6

A

Training 240.6 ± 36.8

b

278.9 ± 51.7

ab

245.3 ± 42.0

b

322.2 ± 27.3

a

Muscle TG (mg/g) Non-training 73.8 ± 26.1

A

42.0 ± 19.4

A

47.7 ± 13.6

A

50.0 ± 26.5

A

Training 61.4 ± 26.8

a

33.4 ± 5.7

b

40.0 ± 3.6

ab

41.4 ± 2.7

ab

1)

Values are Means±SD. All data were analyzed via one-way ANOVA for non-training and training animals. The values with different superscripts in a given row are significantly different ( P < 0.05) based on Duncan’s multiple range test results.

NE, non-exercise group; ER, exercise and rest group; FFA, free fatty acid; TG, triglyceride. The groups were sacrificed after a 1 hour rest following exercising for 0 (NE), 0.5 (ER0.5:1), 1 (ER1;1), and 2 (ER2:1) hours.

Table 2. Effects of exercise-to-rest period ratio on the levels of fat sources of energy in non-training and training animals

NE ER 2:1 ER 1:1 ER 0.5:1

Plasma glucose (mg/dL) Non-training 151.0 ± 5.9

A1)

177.7 ± 25.8

A

145.8 ± 59.3

A

169.2 ± 23.4

A

Training 132.8 ± 24.9

b

180.2 ± 9.3

a

173.5 ± 29.2

a

184.5 ± 5.6

a

Liver glycogen (mg/g) Non-training 62.2 ± 4.7

A

76.4 ± 12.7

A

87.5 ± 25.9

A

86.3 ± 39.1

A

Training 37.9 ± 5.5

b

66.2 ± 17.9

a

58.6 ± 19.5

ab

45.3 ± 5.6

ab

muscle glycogen (mg/g) Non-training 0.45 ± 0.04

A

0.76 ± 0.63

A

0.46 ± 0.26

A

0.46 ± 0.04

A

Training 0.40 ± 0.01

b

1.07 ± 0.35

a

0.72 ± 0.20

ab

0.85 ± 0.45

ab

1)

Values are Means±SD. All data were analyzed via one-way ANOVA for non-training and training animals. Values with different superscripts in a given row are significantly different ( P < 0.05) based on the results of Duncan’s multiple range test.

NE, non-exercise group; ER, exercise and rest group. The groups were sacrificed after a 1 hour rest following exercising for 0 (NE), 0.5 (ER0.5:1), 1 (ER1;1), and 2 (ER2:1) hours.

Table 1. Effects of exercise-to-rest period ratio on the levels of carbohydrate sources of energy in non-training and training animal groups

NE ER 2:1 ER 1:1 ER 0.5:1

Plasma Protein (mg/dL) Non-training 9.53 ± 1.88

A1)

8.99 ± 2.23

A

8.56 ± 2.97

A

10.52 ± 1.70

A

Training 7.47 ± 0.35

b

9.35 ± 0.26

a

8.68 ± 1.06

ab

9.30 ± 1.36

a

Liver Protein (mg/g) Non-training 3.87 ± 0.93

A

3.95 ± 1.01

A

4.85 ± 1.61

A

3.89 ± 1.44

A

Training 2.98 ± 0.38

a

3.05 ± 0.65

a

2.60 ± 0.26

a

3.26 ± 0.73

a

Muscle Protein (mg/g) Non-training 0.65 ± 0.04

A

0.57 ± 0.07

A

0.81 ± 0.31 0.60 ± 0.01

Training 0.87 ± 0.29

a

0.63 ± 0.04

b

0.65 ± 0.08

ab

0.60 ± 0.05

b

1)

Values are Means±SD. All data were analyzed via one-way ANOVA for non-training and training animals. The values with different superscripts in a given row are significantly different ( P < 0.05) based on Duncan’s multiple range test results.

NE, non-exercise group; ER, exercise and rest group. The groups were sacrificed after a 1 hour rest following exercising for 0 (NE), 0.5 (ER0.5:1), 1 (ER1;1), and 2 (ER2:1) hours.

Table 3. Effects of exercise-to-rest period ratio on the levels of protein sources of energy in non-training and training animals

the liver glycogen levels increased, but those changes were not statistically significant due to large standard deviations. Muscle glycogen level showed no differences between NE and ER groups of non-training animals. However, the training group animals showed a significantly increased muscle glycogen level in the ER2:1 group.

Fat energy sources

Table 2 summarizes the levels of three fat energy sources under different exercise-to-rest period ratios in the training and non-training groups. Among the training group animals, plasma FFA level reached the highest level in the ER2:1 group and was similarly high in the ER0.5:1 group. In the non-training group animals, there was no difference between the NE and ER groups.

However, in the training group, liver TG level increased significantly in the ER0.5:1 group. In the non-training animal group, there were no significant differences in liver TG level between NE and ER groups, irrespective of the exercise-to-rest period ratio. Muscle TG level only decreased significantly from

the NE level in the ER2:1 group of animals from the training group. The non-training group animals showed decreases in muscle TG, but the changes were not statistically significant due to large standard deviations.

Protein energy sources

The levels of three protein energy sources under different

exercise-to-rest period ratios are summarized in Table 3. Among

the training animals, the plasma protein level increased

significantly over that in the NE group in the ER2:1 and ER0.5:1

groups. However, the non-training animals showed no significant

differences between the NE and ER groups, irrespective of the

exercise-to-rest period ratio. In both the training and non-

training animal groups, liver protein levels did not change

significantly among the NE and ER groups, irrespective of the

exercise-to-rest period ratio. However, among the training

animals, muscle protein level was significantly decreased from

the NE level in the ER2:1 and ER0.5:1 groups. The non-training

group animals showed no differences in muscle protein level

(4)

NE ER 2:1 ER 1:1 ER 0.5:1

SOD (U/mg protein) Non-training 88.2 ± 3.0

AB2)

95.7 ± 7.6

A

77.4 ± 3.0

B

88.2 ± 9.1

AB

Training 92.5 ± 33.5

ab

60.2 ± 0.1

a

97.8 ± 1.5

b

74.2 ± 10.6

a

Catalase (U/mg protein) Non-training 10.0 ± 0.4

A

10.4 ± 0.4

A

9.8 ± 0.4

A

10.4 ± 0.4

A

Training 9.9 ± 0.2

a

10.4 ± 0.4

a

10.1 ± 0.3

a

9.8 ± 0.6

a

MDA (n mol/mg protein) Non-training 0.44 ± 0.06

B

0.63 ± 0.15

AB

0.85 ± 0.14

A

0.65 ± 0.31

AB

Training 0.71 ± 0.22

a

0.59 ± 0.32

a

0.82 ± 0.20

a

0.52 ± 0.14

a

1)

Values are Means±SD. All data were analyzed via one-way ANOVA for non-training and training animals. The values with different superscripts in a given row are significantly different ( P < 0.05) based on Duncan’s multiple range test results.

NE, non-exercise group; ER, exercise and rest group. The groups were sacrificed after a 1 hour rest following exercise for 0 (NE), 0.5 (ER0.5:1), 1 (ER1;1), and 2 (ER2:1) hours.

Table 4. Effects of exercise-to-rest period ratio on superoxide dismutase (SOD) and catalase activity levels and malondialdehyde (MDA) concentrations in non-training and training animals

among NE and ER groups, irrespective of the exercise-to-rest period ratio.

Anti-oxidative status

Table 4 shows SOD and catalase activity levels and the MDA concentrations of animals subjected to different exercise-to-rest period ratios. The animals in the training group showed significantly decreased SOD activity in the ER2:1 and ER0.5:1 groups. In contrast, catalase activity and MDA concentration showed no differences among NE and ER groups, irrespective of the exercise-to-rest period ratio. In non-training animals, SOD activity levels changed, but the ER group differences from the NE group were not significant. The MDA level in non-training group animals was significantly higher than the NE level in the ER1:1 group.

DISCUSSION

The results of this study show that animals can benefit from a 0.5:1 to 1:1 exercise-to-rest period ratio to restore muscle energy stores and allow their oxidative defense system to recuperate. Moreover, the results show that a previous moderate exercise training period is helpful for replenishing energy stores but is not effective in the recovery of anti- oxidative status.

Although energy is provided by carbohydrates, lipids, and proteins, only carbohydrates and lipids provide the major portion of the total energy supply during exercise. During exercise, carbohydrate sources include blood glucose, muscular, and hepatic glycogen. Lipid sources include plasma FFA, intramuscular TG, and adipocyte TG [15]. The restoration of these energy stores after exercise is critical prior to the next exercise session. In particular, depletion of carbohydrate stores in liver and muscle is related to fatigue in animals. In this study, in the training group animals, plasma glucose levels were increased significantly in the ER2:1 group and were similarly and significantly high in the ER1:1 and ER0.5:1 groups. In contrast, the liver and muscle glycogen levels were high in the ER2:1 group, decreasing to levels similar to the NE groups in the ER1:1 and ER0.5:1 groups. In the non-training animal groups, these carbohydrate energy sources tended to show similar patterns, but the changes were not statistically significant due to the groups’ large standard deviations.

Over time, training does increase the body’s physiological

capacity for both work and recovery. Exercise training helps maintain good blood flow to and from the muscles. However, without the adaptation on optimizing carbohydrate energy balance by exercise training, glycogen re-synthesis might be delayed by slowing the delivery of glucose into tissue due to the failed integrity of the glucose transport process in some animals [16], and glycogen re-synthesis might show large individual variation in non-training animals. Restoration of muscle glycogen stores supports the recovery of endurance capacity for exercise. It has also been reported that the presence and action of carbohydrate metabolism regulators other than insulin can initiate metabolic adaptations [17]. Thus, moderate exercise training, as used in this study, can increase the physiological capacity for restoration of carbohydrate stores during a rest period, and a 2:1 exercise-to-rest period ratio might be sufficient for the replenishment of carbohydrate energy sources for a subsequent exercise session.

In this study, the plasma FFA level was highest in the ER2:1 group but was also high in the ER0.5:1 group. Liver TG level was unchanged in the ER1:1 group but did increase in the ER0.5:1 group of training animals. However, there were no significant differences among NE and ER groups, regardless of exercise-to-rest period ratio, in the non-training animals.

Endogenous triacylglycerol is an important energy source for exercise, and fat oxidation is increased during moderate intensity exercise. The training-induced increase in fat oxidation is primarily a product of intramuscular triacylglycerol stores [18].

Exercise training enhances mobilization of FFA from fat depots and increases fat use as a consequence of the increased activity of peripheral tissue enzymes, which are in charge of fat oxidation [19]. For the regulation of the plasma FFA supply to peripheral tissues, the flow of FFA from adipose tissue is predominant and this FFA supply may be extended if the rate of mobilization exceeds the rate of lipolysis in the post-exercise recovery period [20,21]. It is also reported that 24-hour fat oxidation is increased, even under energy-balanced conditions, if the exercise-induced transient energy deficit is significant [22].

However, there is a report indicating that the lipid oxidation

rate in the post-exercise period rate is not accompanied by an

increase in plasma FFA [23]. Thus, the post-exercise lipid

oxidation rate may be regulated both by the FFA supply and

by energy source selection in tissues, and a higher plasma FFA

level after resting in an animal in training may favor fat

oxidation by increasing substrate availability.

(5)

Although there is some disagreement on the actual contribu- tion of muscle TG as an energy source during exercise [24], it is generally accepted that the main fat energy sources are plasma FFA and FFA derived from intramuscular TG during exercise [12]. Although there is a report that the muscle TG pool functions as an important energy source during submaximal exercise [25], and there is some change in intramuscular TG pool size even after a single exercise session [26], it has been suggested that a concurrent increase in lipid oxidation, intramuscular TG utilization, and FFA storage associated with training could enable the use of intramuscular TG as an alternative energy source to glycogen as it is quickly available within the tissues [27]. The observation that muscle TG level decreased in the ER2:1 group and slightly increased in the ER1:1 group (although not to that of the NE group in training animals) suggests that the body starts to catabolize muscular TG during exercise and replenishes it during rest. Thus, a lower muscle TG level after rest in a training animal might be the result of an increased utilization of muscle fat in order to conserve carbohydrate storage after rest following exercise training.

Protein also contributes as an energy source when endogenous carbohydrate stores start to be depleted. Thus, the level of protein in training animals in this study was expected to be increased in plasma and decreased in muscle during rest.

However, the muscle TG levels of the ER groups were not different from that of the NE group, and the protein content after rest in non-training animals was similar at all exercise- to-rest period ratios. This unexpected result might be due to metabolic adaptation designed to achieve sufficient energy substrate levels that may not be fully achieved in the absence of exercise training.

Exercise training enables an animal to adapt to stress during exercise and induces a homeostasis that is associated with the increased aerobic metabolism [28,29]. SOD activity of the non-training (training) animals in this study was increased (decreased) in the ER2:1 group, decreased (increased) in the ER1:1 group, and increased (decreased) again in the ER0.5:1 group, but the differences were not significant. Catalase activities in the ER groups of both training and non-training animals were not different from those in the NE group at all exercise-to-rest period ratios. The altered SOD levels in the ER1:1 group could be attributed to the substantial increase in MDA level among the non-training animals in the ER1:1 group. This suggests that an ER0.5:1 ratio may be considered a minimum exercise-to-rest period ratio to allow animals to recuperate their anti-oxidative status for the next exercise session in non-training animals. In the training animal group, catalase activity levels and MDA concentrations of the three ER groups were not different from those of NE group at all exercise-to-rest period ratios. These results are consistent with other reports showing that catalase activity was unaffected by exercise-induced oxidative stress in animals in training groups [11,14]. Thus, the effectiveness of the anti-oxidative defense system might be enhanced by training. As a consequence, exercise-induced oxidative stress could be offset during exercise in training animals and might have resulted in the absence of significant differences in catalase activity levels and MDA concentrations among the NE and ER groups.

The results of this study suggest that animals need an exercise-to-rest period ratio of 0.5:1 to 1:1 in order to restore muscle energy sources and allow the anti-oxidative defense system to recover. Therefore, for athletes that are beginning exercise training, a proper rest period after exercise or between workouts is needed to restore energy source capacity and recover anti-oxidative system capability. However, for the already exercise-trained athlete, an appropriate rest period between workouts is helpful for replenishing energy stores but is ineffective in the recuperation of anti-oxidative status. As this study was designed to assess changes over the short term, the results of this study cannot be used to elucidate the chronic effects of different exercise-to-rest period ratios on the restoration of energy sources following exercise.

CONFLICT OF INTEREST

The authors declare no potential conflicts of interests.

ORCID

Ma-Young Yeom: http://orcid.org/0000-0001-7426-6651 Youn-Ok Cho: http://orcid.org/0000-0002-1620-6076

REFERENCES

1. Tsintzas K, Williams C, Boobis L, Symington S, Moorehouse J, Garcia-Roves P, Nicholas C. Effect of carbohydrate feeding during recovery from prolonged running on muscle glycogen metabolism during subsequent exercise. Int J Sports Med 2003;24:452-8.

2. van Hall G, Shirreffs SM, Calbet JA. Muscle glycogen resynthesis during recovery from cycle exercise: no effect of additional protein ingestion. J Appl Physiol (1985) 2000;88:1631-6.

3. Williams M, Raven PB, Fogt DL, Ivy JL. Effects of recovery beverages on glycogen restoration and endurance exercise performance. J Strength Cond Res 2003;17:12-9.

4. Wu CL, Williams C. A low glycemic index meal before exercise improves endurance running capacity in men. Int J Sport Nutr Exerc Metab 2006;16:510-27.

5. Rowlands DS, Hopkins WG. Effects of high-fat and high-carbohydrate diets on metabolism and performance in cycling. Metabolism 2002;51:678-90.

6. Brooks GA, Mercier J. Balance of carbohydrate and lipid utilization during exercise: the “crossover” concept. J Appl Physiol (1985) 1994;76: 2253-61.

7. Romjin JA, Coyle EF, Sidossis L, Gastaldelli A, Horowitz JF, Endert E, Wolfe RR. Regulation of endogenous fat and carbohydrate metabolism in relation to exercise intensity and duration. Am J Physiol 1993;265:E380-91.

8. Barnett C, Carey M, Proietto J, Cerin E, Febbraio MA, Jenkins D.

Muscle metabolism during sprint exercise in man: influence of sprint training. J Sci Med Sport 2004;7:314-22.

9. Stuewe SR, Gwirtz PA, Agarwal N, Mallet RT. Exercise training enhances glycolytic and oxidative enzymes in canine ventricular myocardium. J Mol Cell Cardiol 2000;32:903-13.

10. Choi EY, Cho YO. Moderate physical training can increase muscle

glycogen levels but does not alter protein levels with exercise in

rats. Nutr Sci 2006;9:112-6.

(6)

11. Choi EY, Cho YO. The effects of physical training on antioxidative status under exercise-induced oxidative stress. Nutr Res Pract 2007;1:14-8.

12. Roepstorff C, Vistisen B, Kiens B. Intramuscular triacylglycerol in energy metabolism during exercise in humans. Exerc Sport Sci Rev 2005;33:182-8.

13. Henderson GC, Alderman BL. Determinants of resting lipid oxidation in response to a prior bout of endurance exercise. J Appl Physiol (1985) 2014;116:95-103.

14. Choi EY, Cho YO. The influence of different durations of aerobic exercise on fuel utilization, lactate level and antioxidant defense system in trained rats. Nutr Res Pract 2014;8:27-32.

15. Ghanassia E, Brun JF, Mercier J, Raynaud E. Oxidative mechanisms at rest and during exercise. Clin Chim Acta 2007;383:1-20.

16. O'Reilly KP, Warhol MJ, Fielding RA, Frontera WR, Meredith CN, Evans WJ. Eccentric exercise-induced muscle damage impairs muscle glycogen repletion. J Appl Physiol (1985) 1987;63:252-6.

17. Kiens B. Skeletal muscle lipid metabolism in exercise and insulin resistance. Physiol Rev 2006;86:205-43.

18. Horowitz JF, Klein S. Lipid metabolism during endurance exercise.

Am J Clin Nutr 2000;72:558S-63S.

19. Kenney WL, Wilmore JH, Costill DL. Physiology of sport and exercise.

Champaign, IL: Human Kinetics; 2015. p.51-72.

20. Bülow J, Gjeraa K, Enevoldsen LH, Simonsen L. Lipid mobilization from human abdominal, subcutaneous adipose tissue is independent of sex during steady-state exercise. Clin Physiol Funct Imaging 2006;26:205-11.

21. Henderson GC, Fattor JA, Horning MA, Faghihnia N, Johnson ML, Mau TL, Luke-Zeitoun M, Brooks GA. Lipolysis and fatty acid metabolism in men and women during the postexercise recovery

period. J Physiol 2007;584:963-81.

22. Iwayama K, Kawabuchi R, Park I, Kurihara R, Kobayashi M, Hibi M, Oishi S, Yasunaga K, Ogata H, Nabekura Y, Tokuyama K. Transient energy deficit induced by exercise increases 24-h fat oxidation in young trained men. J Appl Physiol (1985) 2015;118:80-5.

23. Davitt PM, Arent SM, Tuazon MA, Golem DL, Henderson GC.

Postprandial triglyceride and free fatty acid metabolism in obese women after either endurance or resistance exercise. J Appl Physiol (1985) 2013;114:1743-54.

24. Watt MJ, Heigenhauser GJ, Spriet LL. Intramuscular triacylglycerol utilization in human skeletal muscle during exercise: is there a controversy? J Appl Physiol (1985) 2002;93:1185-95.

25. van Loon LJ, Koopman R, Stegen JH, Wagenmakers AJ, Keizer HA, Saris WH. Intramyocellular lipids form an important substrate source during moderate intensity exercise in endurance-trained males in a fasted state. J Physiol 2003;553:611-25.

26. Jensen MD. Fate of fatty acids at rest and during exercise: regulatory mechanisms. Acta Physiol Scand 2003;178:385-90.

27. Koopman R, Manders RJ, Jonkers RA, Hul GB, Kuipers H, van Loon LJ. Intramyocellular lipid and glycogen content are reduced following resistance exercise in untrained healthy males. Eur J Appl Physiol 2006;96:525-34.

28. Lira FS, Koyama CH, Yamashita AS, Rosa JC, Zanchi NE, Batista ML Jr, Seelaender MC. Chronic exercise decreases cytokine production in healthy rat skeletal muscle. Cell Biochem Funct 2009;27:458-61.

29. Campbell PT, Gross MD, Potter JD, Schmitz KH, Duggan C,

McTiernan A, Ulrich CM. Effect of exercise on oxidative stress: a

12-month randomized, controlled trial. Med Sci Sports Exerc

2010;42:1448-53.

수치

Fig. 1. Schematic overview of experimental design
Table 2. Effects of exercise-to-rest period ratio on the levels of fat sources of energy in non-training and training animals
Table 4.  Effects  of  exercise-to-rest  period  ratio  on  superoxide  dismutase  (SOD)  and  catalase  activity  levels  and  malondialdehyde  (MDA)  concentrations in non-training and training animals

참조

관련 문서

[r]

USB 연결 케이블을 이용하여 라즈베리 파이와 센서보드 연결 라즈베리 파이의 USB 포트와 WeDo 의 컴퓨터 연결 허브를 연결하 면 된다...

In the change in body composition, body weight did not show a statistically significant change in all items in the exercise group and the control group,

The index is calculated with the latest 5-year auction data of 400 selected Classic, Modern, and Contemporary Chinese painting artists from major auction houses..

- 축산업으로 인한 환경부담을 낮추고, 사회로부터 인정받아야 중장기적으로 축산업 성장 가능 - 주요과제: 가축분뇨 적정 처리, 온실가스 저감, 축산악취 저감

Our analysis has shown that automation is already widespread among both domestic and foreign investors in Vietnam, and that both groups plan to continue investing

이는 아직 지부지사에서 확인 및 승인이 완료되지 않은 상태. 지부지사에서 보완처리 및 승인처 리 시

[r]