http://e-nrp.org
Associations between food insecurity and healthy behaviors among Korean adults
In-Ae Chun
1, So-Yeon Ryu
2§, Jong Park
2, Hee-Kyung Ro
3and Mi-Ah Han
21Department of Nutritional Service Team, Chosun University Hospital, Gwangju 501-717, Korea
2Department of Preventive Medicine, College of Medicine, Chosun University, 309 Pilmundae-ro, Dong-gu, Gwangju 501-759, Korea
3Department of Food and Nutrition, College of Natural Science, Chosun University, Gwangju 501-759, Korea
BACKGROUND/OBJECTIVES: Food insecurity has been suggested as being negatively associated with healthy behaviors and health status. This study was performed to identify the associations between food insecurity and healthy behaviors among Korean adults.
SUBJECTS/METHODS: The data used were the 2011 Community Health Survey, cross-sectional representative samples of 253 communities in Korea. Food insecurity was defined as when participants reported that their family sometimes or often did not get enough food to eat in the past year. Healthy behaviors were considered as non-smoking, non-high risk drinking, participation in physical activities, eating a regular breakfast, and maintaining a normal weight. Multiple logistic regression and multinomial logistic regression analyses were used to identify the association between food insecurity and healthy behaviors.
RESULTS: The prevalence of food insecurity was 4.4% (men 3.9%, women 4.9%). Men with food insecurity had lower odds ratios (ORs) for non-smoking, 0.75 (95% CI: 0.68-0.82), participation in physical activities, 0.82 (95% CI: 0.76-0.90), and eating a regular breakfast, 0.66 (95% CI: 0.59-0.74), whereas they had a higher OR for maintaining a normal weight, 1.19 (95% CI:
1.09-1.30), than men with food security. Women with food insecurity had lower ORs for non-smoking, 0.77 (95% CI: 0.66-0.89), and eating a regular breakfast, 0.79 (95% CI: 0.72-0.88). For men, ORs for obesity were 0.78 (95% CI: 0.70-0.87) for overweight and 0.56 (95% CI: 0.39-0.82) for mild obesity. For women, the OR for moderate obesity was 2.04 (95% CI: 1.14-3.63) as compared with normal weight.
CONCLUSIONS: Food insecurity has a different impact on healthy behaviors. Provision of coping strategies for food insecurity might be critical to improve healthy behaviors among the population.
Nutrition Research and Practice 2015;9(4):425-432; doi:10.4162/nrp.2015.9.4.425; pISSN 1976-1457 eISSN 2005-6168
Keywords: Food insecurity, Healthy behaviors, Korean adults, Obesity
INTRODUCTION
*For many underdeveloped and developing nations around the world, the issue of food security continues to be of great importance and interest [1]. Even for many advanced nations, it remains a far-reaching topic, since poverty and hunger still plague the socio-economically disadvantaged within these nations [1,2]. Food insecurity refers to a case in which “the availability of nutritionally adequate and safe foods, or the ability to acquire acceptable foods in socially acceptable ways, is limited or uncertain”; i.e., a condition in which the basic human need for food is not met [3,4].
Securing enough nutritionally sound food is a basic human desire and right. Therefore, identifying nutritional needs and procuring food to satisfy these needs is a foundation of general welfare [5]. Furthermore, food insecurity has been reported to be negatively associated with nutritional status and health
outcomes [6]. Therefore, in addition to the welfare sector, the public health sector would find food insecurity data highly useful for selecting food and nutrition support program bene- ficiaries as well as for the monitoring and evaluation of other government health programs [1,7].
Stress resulting from food insecurity may increase tobacco and alcohol consumption, and in some cases, frequent smoking and drinking are used as a means to suppress the appetite, leading to inadequate food intake. As a result, when an individual is faced with an unstable food supply, the money that needs to be directed toward purchasing nutritional food may instead be channeled to purchasing tobacco and alcohol [8,9]. Additionally, a tight budget may lead to the purchase of cheap and calorie-dense food items, which may increase the risk of obesity [10]. In some studies, food insecurity has been reported to affect both underweight and obese individuals [11-14]. As such, food insecurity can have a significant impact
This study was supported by research fund of Chosun University, 2014.
§Corresponding Author: So-Yeon Ryu, Tel. 82-62-230-6483, Fax. 82-62-225-8293, Email. [email protected] Received: December 24, 2014, Revised: March 31, 2015, Accepted: March 31, 2015
This is an Open Access article distributed under the terms of the Creative Commons Attribution Non-Commercial License (http://creativecommons.org/licenses/by-nc/3.0/) which permits unrestricted non-commercial use, distribution, and reproduction in any medium, provided the original work is properly cited.
on an individual’s health as well as national public health policies. However, these findings may not be applicable for all populations, especially Koreans, and may vary depending on coping strategies for resolving food insecurity.
This study was performed to investigate the potential associations between food insecurity and various healthy behaviors, including non-smoking, non-high risk drinking, participation in physical activities, eating a regular breakfast, and maintaining a normal body weight among Korean adults, using the 2011 Korean Community Health Survey (KCHS).
Further, we differentiated the degree of obesity using body mass index (BMI) in order to more accurately identify its association with food insecurity in Koreans.
SUBJECTS AND METHODS Study population
This study used the data obtained from the 2011 KCHS, which was carried out by the Korean Centers for Disease Control and Prevention, 253 community health centers, and 36 community universities. The KCHS is an annual nationwide survey that has been conducted on adults aged 19 years or older since 2008 with the goal of establishing a standardized survey system for producing population-based estimates of health indicators based on public health programs in each community. In 2011, an average of 900 persons aged 19 years and older was selected from 253 communities through multistage probability sampling.
A trained interviewer conducted a 1:1 Computer Assisted Personal Interview (CAPI) using a laptop installed with a survey program [15].
Of total 229,226 adults, 216,764 respondents were used for the final analysis upon eliminating the data deemed insufficient for determining food security and obesity status (12,462 persons).
Study methods
For demographic characteristics, age was classified as 19-44, 45-64, 65-74, and 75 years or older. Educational attainment was classified as less than elementary school, middle school graduate, high school graduate, and college graduate and above.
Employment status was divided into employed and unem- ployed. Monthly household income was divided into less than 1 million, 1.01-2 million, 2.01-3 million, 3.01-4 million, and 4.01 million KRW and above. Household members were classified as 0 (solitude) or 1 and over for people currently living together.
Place of residence was categorized into urban (if residing in dong) and rural (if residing in eub or myun). Self-rated general health and oral health were categorized into good (very good or good), fair, and poor (poor or very poor). Experience with depression was defined as feelings of sadness or despair that interfered with daily life and lasted for 2 or more consecutive weeks over the past year.
Food security was surveyed using a single question, “Which of the following most accurately describes your family’s food situation during the past year?” The following four structured responses were provided, and respondents were categorized into either the “food secure” or “food insecure” group according to the financial resources factor: “There was sufficient food in terms of quantity and variety available for all household
members in my family”, “There was sufficient food in terms of quantity but limited variety available for all household members in my family”, “There was occasional food shortage due to lack of resources”, and “There was frequent food shortage due to lack of resources”. The first two responses were categorized as food secure, and the other two responses were categorized as food insecure [16,17].
Healthy behaviors were surveyed through questions about tobacco and alcohol use, participation in physical activities, eating a regular breakfast, height, and weight. Non-smoking was defined as lifetime non-smokers and current non-smokers.
As for alcohol use, male respondents who consumed more than seven drinks twice a week or more, as well as female respondents who consumed more than five drinks twice a week or more, were defined as high risk drinkers; others were defined as non-high risk drinkers. For physical activities, questions on vigorous and moderate physical activities and walking activity were used. Respondents who reported engaging in vigorous physical activities for a minimum of 20 minutes 3 or more days a week, moderate physical activities for a minimum of 30 minutes 5 or more days a week, or those who walked for a minimum of 30 minutes 5 or more days a week were defined as participants. Those who did not meet any of these criteria were labeled non-participants.
For nutrition, frequency of weekly breakfast intake was surveyed. Those who ate breakfast more than 5 days a week were classified as eating a regular breakfast. For obesity status, BMI was calculated using self-reported height (cm) and weight (kg). Following the standards used by the Korea Society for Obesity Study [18], respondents with a BMI of 23.0 kg/m
2or less were grouped into normal weight, whereas those with a BMI of 23.0 kg/m
2and over were grouped as overweight/obese.
Degree of obesity was categorized as underweight (BMI < 18.5 kg/m
2), normal weight (18.5 kg/m
2≤ BMI < 23.0 kg/m
2), overweight (23.0 kg/m
2≤ BMI < 25.0 kg/m
2), mild obesity (25.0 kg/m
2≤ BMI < 30.0 kg/m
2), moderate obesity (30.0 kg/m
2≤ BMI
< 35.0 kg/m
2), and severe obesity (BMI ≥ 35.0 kg/m
2) [18].
Statistical analysis
Data analysis was performed by considering Complex Sample Design using the statistical software IBM SPSS version 21.0.
Individual weight was applied in order to estimate the popula- tion. Stratified analysis by gender was performed while taking into account gender differences in terms of general characteristics and health habits observed in this study as well as gender differences in terms of food insecurity found in previous studies [5,19,20].
Chi-square test was used to compare respondents’ gender
differences in relation to distribution of general characteristics,
food insecurity status, and healthy behaviors, in addition to
examining the relationships between food insecurity and
various healthy behaviors. A multiple logistic regression analysis
was performed to examine the associations between food
insecurity and various healthy behaviors as well as to identify
the relationship between food insecurity and degree of obesity,
after adjustment for general characteristics. The data were
presented as an estimated percentage, standard error and odds
ratios (ORs), and 95% confidence intervals (CIs). The level of
statistical significance was set at α = 0.05.
Characteristics Total Men Women
P-value3)
n1) %2) n % n %
Age (yrs)
19-44 86,020 51.7 40,189 53.1 45,831 50.2 < 0.001
45-64 83,215 35.4 38,997 35.3 44,218 35.6
65-74 31,215 8.8 14,678 8.2 16,537 9.3
≥ 75 16,314 4.1 6,778 3.4 9,536 4.9
Educational attainment
Elementary school or less 54,798 14.1 17,980 9.0 36,818 19.3 < 0.001
Middle school 25,766 9.5 12,293 8.8 13,473 10.2
High school 76,797 40.2 38,948 42.3 37,849 38.0
College and over 58,980 36.2 31,220 39.8 27,760 32.5
Employment status
Yes 137,465 63.6 78,375 77.8 59,090 49.2 < 0.001
No 79,014 36.4 22,093 22.2 56,921 50.8
Monthly household income (million won)
≤ 1.00 50,188 15.6 21,172 13.8 29,016 17.5 < 0.001
1.01-2.00 43,200 20.2 20,577 20.2 22,623 20.2
2.01-3.00 41,235 22.6 19,949 23.6 21,286 21.5
3.01-4.00 24,052 14.7 11,466 15.0 12,586 14.3
≥ 4.01 42,498 26.9 20,192 27.4 22,306 26.4
Household members
1 or over 196,119 92.8 93,452 93.5 102,667 92.0 < 0.001
Solitude 20,645 7.2 7,190 6.5 13,455 8.0
Place of residence
Urban 124,198 81.4 56,863 80.8 67,335 81.9 < 0.001
Rural 92,566 18.6 43,779 19.2 48,787 18.1
Self-rated general health
Good 88,925 45.1 46,643 50.2 42,282 40.0 < 0.001
Fair 84,936 40.6 37,625 38.3 47,311 43.0
Poor 42,875 14.2 16,357 11.6 26,518 16.9
Self-rated oral health
Good 58,456 29.4 28,454 30.9 30,002 27.8 < 0.001
Fair 74,419 37.2 32,569 35.2 41,850 39.3
Poor 83,876 33.4 39,610 33.9 44,266 32.9
Perception of depressive symptoms
Yes 10,986 5.4 3,459 3.7 7,527 7.1 < 0.001
No 205,683 94.6 97,136 96.3 108,547 92.9
Food insecurity
Yes 6,974 4.4 4,717 3.9 6,974 4.9 < 0.001
No 205,073 95.6 95,925 96.1 109,148 95.1
Total 216,764 100.0 100,642 50.3 116,122 49.7
1)n: sample size
2)%: estimated percent of the population
3)Tested by chi-square test.
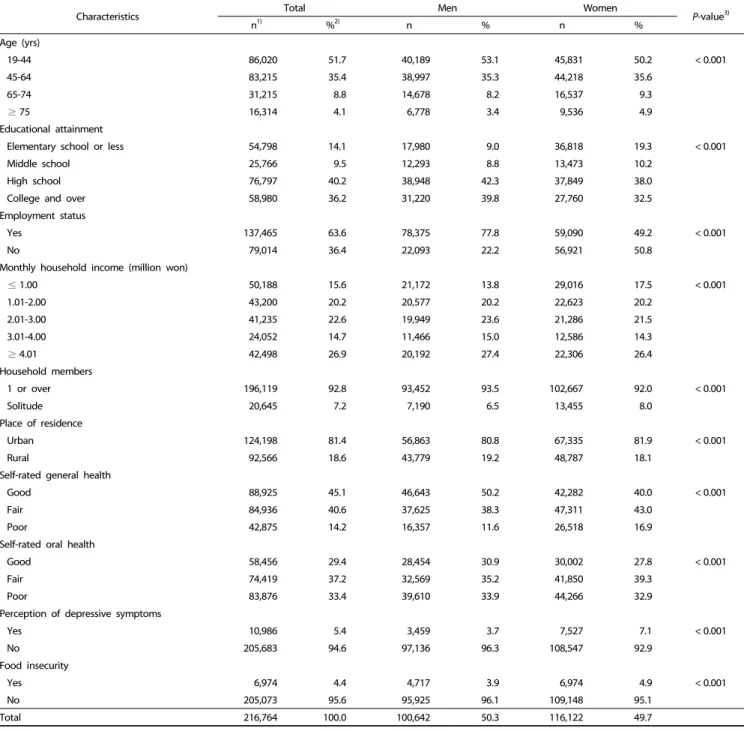
Table 1. General characteristics of the subjects
RESULTS
General characteristics
For males, the 19-44 (yrs) group accounted for the majority (53.1%), followed by the 45-64 (yrs) group (35.3%). In terms of educational attainment, high school graduates accounted for 42.3%, followed by college graduates or above at 39.8%. More than three-fourths (77.8%) were employed, and 27.4% reported a monthly household income of 4.01 million KRW or more,
followed by 2.01-3 million KRW with a response rate of 23.6%.
Respondents living with family members constituted 93.5%, and urban residents accounted for 80.8% of the population. More than half (50.2%) reported good self-rated general health, and 30.9% reported good self-rated oral health. Only 3.7% expe- rienced depressive symptoms. Most participants (96.1%) reported food security, whereas only 3.9% reported food insecurity.
For females, the 19-44 (yrs) group accounted for 50.2%,
followed by the 45-64 (yrs) group at a rate of 35.6%. High school
Total Men Women
P-value3)
n1) %2) n % n %
Non-smoking
Yes 169,354 75.7 56,829 54.9 112,525 96.7 < 0.001
No 47,371 24.3 43,793 45.1 3,578 3.3
Non-high risk drinking
Yes 189,417 85.7 77,375 75.5 112,042 95.9 < 0.001
No 27,253 14.3 23,226 24.5 4,027 4.1
Participation of physical activities
Yes 115,488 53.7 56,944 56.8 58,544 50.6 < 0.001
No 101,276 46.3 43,698 43.2 57,578 49.4
Eating a breakfast regularly
Yes 171,148 72.3 78,965 71.1 92,183 73.6 < 0.001
No 45,500 27.7 21,620 28.9 23,880 26.4
Keeping a normal weight
Yes4) 113,297 53.1 44,139 43.1 69,158 63.2 < 0.001
No 103,467 46.9 56,503 56.9 46,964 36.8
Obesity5)
Underweight 12,314 5.7 3,039 2.4 9,275 9.1 < 0.001
Normal weight 100,983 47.3 41,100 40.7 59,883 54.1
Overweight 52,876 23.8 28,045 27.6 24,831 20.0
Mild obesity 46,127 21.0 26,154 26.7 19,973 15.2
Moderate obesity 4,051 1.9 2,100 2.4 1,951 1.5
Severe obesity 413 0.2 204 0.2 209 0.2
1)n: sample size
2)%: estimated percent of the population
3)Tested by chi-square test.
4)Normal weight: 23.0 kg/m2≥ BMI
5)Underweight: BMI < 18.5 kg/m2, Normal weight: 18.5 kg/m2≤ BMI < 23.0 kg/m2, Overweight: 23.0 kg/m2≤ BMI < 25.0 kg/m2, Mild obesity: 25.0 kg/m2≤ BMI < 30.0 kg/m2, Moderate obesity: 30.0 kg/m2≤ BMI < 35.0 kg/m2, Severe obesity: BMI ≥ 35.0 kg/m2
Table 2. Rates of healthy behaviors among the subjects
graduates accounted for 38.0%, followed by 32.5% college graduates or above. More than half (50.8%) were unemployed, and 26.4% reported a monthly household income of 4.01 million KRW or more, followed by 21.5% reporting a monthly income of 2.01-3.0 million KRW. Most (92.0%) lived with their families, and 81.9% lived in urban areas. A substantial proportion (40.0%) reported good self-rated general health, whereas 27.8% reported good self-rated oral health. Only 7.1% reported experiencing depression. Most respondents (95.1%) reported food security, whereas 4.9% reported food insecurity.
Statistically significant gender differences were observed in the distribution of food insecurity and general characteristics, including age, educational attainment, employment status, monthly income, household member status, place of residence, self-rated general health, self-rated oral health, and experience with depression (Table 1).
Healthy behaviors
Statistically significant gender differences were found in the distribution of healthy behaviors. For males, 54.9% were non- smokers, 75.5% were non-high risk drinkers, 56.8% showed participation in physical activities, 71.1% ate a regular breakfast, and 41.3% maintained a normal weight. For female respon- dents, 96.7% were non-smokers, 95.9% were non-high risk drinkers, 50.6% showed participation in physical activities, 73.6% ate a regular breakfast, and 63.2% maintained a normal
weight. Distribution of obesity also showed significant gender differences (Table 2).
Comparisons of healthy behaviors according to food insecurity In comparing healthy behaviors with food insecurity, male respondents in the food secure group had significantly higher rates of non-smoking and physical activity, whereas those in the food insecure group exhibited significantly higher rates of non-drinking and normal bodyweight. Obesity distribution in relation to food insecurity showed statistically significant diffe- rences. Female respondents in the food secure group exhibited significantly higher rates of non-smoking, participation in regular physical activity, and maintaining normal weight. On the other hand, significantly higher rates of non-drinking and regular breakfast intake were found among female respondents in the food insecure group. As was the case for male respondents, obesity distribution in relation to food insecurity exhibited statistically significant differences (Table 3).
Associations between food insecurity and healthy behaviors
To examine the association between food insecurity and
healthy behaviors, multiple logistic regression analysis was
performed with adjustment of general characteristics. In males,
ORs of the food insecure group were shown to be significantly
lower than those of the food secure group in terms of non-
smoking (aOR = 0.75, 95% CI: 0.68-0.82), participation in physical
Men Women Food insecurity
P-value1) Food insecurity
P-value1)
No Yes No Yes
Non-smoking
Yes 55.1 (0.2) 51.2 (1.0) < 0.001 96.9 (0.1) 92.6 (0.4) < 0.001
No 44.9 (0.2) 48.8 (1.0) 3.1 (0.1) 7.4 (0.4)
Non-high risk drinking
Yes 75.3 (0.2) 79.6 (0.8) < 0.001 95.9 (0.1) 97.2 (0.3) < 0.001
No 24.7 (0.2) 20.4 (0.8) 4.1 (0.1) 2.8 (0.3)
Participation in physical activities
Yes 57.0 (0.2) 52.9 (1.0) < 0.001 50.7 (0.2) 48.0 (0.8) 0.001
No 43.0 (0.2) 47.1 (1.0) 49.3 (0.2) 52.0 (0.8)
Eating a regular breakfast
Yes 71.1 (0.2) 71.3 (0.9) 0.783 73.4 (0.2) 78.7 (0.7) < 0.001
No 28.9 (0.2) 28.7 (0.9) 26.6 (0.2) 21.3 (0.7)
Maintaining a normal weight
Yes 42.7 (0.2) 53.2 (1.0) < 0.001 63.7 (0.2) 54.4 (0.8) < 0.001
No 57.3 (0.2) 46.8 (1.0) 36.3 (0.2) 45.6 (0.8)
Obesity
Underweight 2.3 (0.1) 5.8 (0.4) < 0.001 9.2 (0.1) 7.8 (0.4) < 0.001
Normal weight 40.4 (0.2) 47.3 (1.0) 54.5 (0.2) 46.7 (0.8)
Overweight 27.7 (0.2) 25.8 (0.9) 19.8 (0.2) 22.9 (0.7)
Mild obesity 27.0 (0.2) 19.4 (0.8) 14.9 (0.1) 20.2 (0.6)
Moderate obesity 2.4 (0.1) 1.4 (0.2) 1.5 (0.0) 2.1 (0.2)
Severe obesity 0.2 (0.0) 0.4 (0.1) 0.1 (0.0) 0.4 (0.1)
1)Tested by chi-square test.
Table 3. Comparisons of healthy behaviors according to food insecurity % (%SE)
Dependent variable Men Women
aOR (95% CI)1) aOR (95% CI)1)
Non-smoking 0.75 (0.68-0.82) 0.77 (0.66-0.89)
Non-high risk drinking 1.03 (0.92-1.15) 1.21 (0.97-1.50) Participation in physical activities 0.82 (0.76-0.90) 0.96 (0.89-1.03) Eating a regular breakfast 0.66 (0.59-0.74) 0.79 (0.72-0.88) Maintaining a normal weight 1.19 (1.09-1.30) 1.04 (0.97-1.12)
1)Calculated by multiple logistic regression analysis with adjustments for age, educational attainment, employment status, monthly household income, household members, place of residence, self-rated general health, self-rated oral health, and perception of depressive symptoms
Table 4. Associations between food insecurity and healthy behaviors
Dependent variable Men Women
aOR (95% CI)1) aOR (95% CI)1) Obesity
Underweight (/Normal) 1.11 (0.91-1.34) 0.95 (0.84-1.08) Overweight (/Normal) 0.78 (0.70-0.87) 0.94 (0.86-1.03) Mild obesity (/Normal) 0.56 (0.39-0.82) 0.88 (0.72-1.08) Moderate obesity (/Normal) 1.15 (0.44-3.04) 2.04 (1.14-3.63) Severe obesity (/Normal) 1.77 (0.42-7.40) 0.83 (0.21-3.30)
1)Calculated by multinomial logistic regression analysis with adjustments for age, educational attainment, employment status, monthly household income, household members, place of residence, self-rated general health, self-rated oral health, and perception of depressive symptoms
Table 5. Associations between food insecurity and obesity
activities (aOR = 0.82, 95% CI: 0.76-0.90), and eating a regular breakfast (aOR = 0.66, 95% CI: 0.59-0.74), whereas they were significantly higher for normal weight (aOR = 1.19, 95% CI:
1.09-1.30). In females, ORs of the food insecure group were significantly lower than those of the food secure group in terms of non-smoking (aOR = 0.77, 95% CI: 0.66-0.89) and regular breakfast intake (aOR = 0.79, 95% CI: 0.72-0.88) (Table 4).
Associations between food insecurity and obesity
Multiple multinomial logistic regression analysis was perfor- med to identify the association between food insecurity and obesity after adjusting general characteristics. In males, the food insecure group showed significantly lower ORs than the food secure group in terms of being overweight (aOR = 0.78, 95%
CI: 0.70-0.87) or mild obesity (aOR = 0.56, 95% CI: 0.39-0.82)
compared with normal weight. For females, on the other hand, the food insecure group exhibited a significantly higher OR of 2.04 (95% CI: 1.14-3.63) for moderate obesity compared with normal weight (Table 5).
DISCUSSION
The present study was conducted to identify the potential
associations between food insecurity and healthy behaviors
using the data obtained from the 2011 KCHS. In our results,
95.6% of the study subjects reported food security, which was
higher than the result of the 2011 Korea National Health and
Nutritional Examination Survey (95.2%) [21]. A higher level of
food insecurity was reported by female respondents, which was
consistent with a Canadian study in which female house members were found to be more sensitive to food insecurity than their male counterparts [19]. In general, females are more acutely aware of their household’s food supply status than their male household members. Additionally, they tend to shield others from the negative effects of food insecurity by surrende- ring their share of food to other family members. For these reasons, it is crucial to pay attention to gender discrepancies in reported food insecurity [19]. Identification of gender-specific factors influencing food insecurity perceptions is a key to establishing an effective measure with which to achieve food security.
The results indicate that rates of non-smoking, participation in physical activities, and regular breakfast intake declined in males with food insecurity, whereas only rates of non-smoking and regular breakfast intake declined in females. Rate of non-smoking, in particular, significantly declined in both males and females, which is consistent with the finding of Iglesias-Rios et al. [9]. Smoking desensitizes the palate and suppresses appetite. This negative effect is known to affect individuals’ food selection and lead to reduced consumption of fruits and vegetables [22]. Such an unhealthy behavior pattern needs to be mitigated, as it potentially exacerbates individuals’ overall health, especially when there is already an insufficient food supply issue. Drinking, along with smoking, is another health behavior that receives plenty of attention. Although food insecurity has been linked to increased alcohol consumption among female urban residents of South Africa [23], no significant association with food insecurity was observed among either male or female respondents in this study.
Engaging in regular physical activity is indicative of good self-care, as it is known to increase fitness, prevent obesity, reduce prevalence rates of chronic diseases, and boost mental health [24]. According to our study, physical activity levels dropped significantly among food insecure male respondents.
The physical activities reported by the respondents cannot all be regarded as regular exercise, as the KCHS does not differentiate between intense exercise from job-related physical activities or housework and instead simply relies on respon- dents’ subjective evaluation of intense and moderate physical activities and walking in daily life. Nevertheless, as an individual’s will leads to his/her participation in regular physical activities, timely identification of food insecure male adults becomes important in order to educate the benefits of regular physical activity. Most previous studies on food insecurity and nutrition have compared each nutrient based on caloric intake.
However, the KCHS does not survey food intake; thus, breakfast intake frequency was used in our study. Regular dietary intake has a substantial effect on an individual’s total daily calorie intake. Moreover, frequent skipping of breakfast can result in nutritional imbalance, binge eating, overeating, and frequent snacking, which can subsequently lead to increased obesity risk.
For these reasons, it would be reasonable to select regular breakfast intake as an important parameter of healthy habits [25]. Our study results indicate that the rate of regular breakfast intake was low in the food insecure group. This could affect overall nutritional intake; thus, an intervention measure to reinforce this group’s regular breakfast intake needs to be
established.
The OR for normal weight increased significantly among food insecure male respondents. However, studies on Western industrialized societies’ rates of obesity and food insecurity have indicated that those who experience food insecurity are at an increased risk of being overweight and obese compared to their food secure counterparts, and this has been observed across the board among females [11,12,14,26], children [27], and adults [10]. Korean studies also reported similar findings in which bodyweights of low-income children were positively associated with food insecurity [28]. According to this study, prevalence of overweight and mild obesity significantly decreased among food insecure males, whereas moderate obesity significantly increased among females.
An increased obesity rate despite an unstable supply of food may be explained by the following reasons. First, sporadic food shortage encourages over-consumption during periods of abundance. This increases energy efficiency within an indivi- dual’s body and leads to accumulation of body fat as a means of physiological adaptation to maximize energy storage [29,30].
Second, lack of financial resources steers individuals toward selecting cheaper food items that are energy-dense, heavily processed, and loaded with added sugars and away from more expensive and healthier options, such as low-fat protein, whole grains, fruit, and vegetables [31-33]. Third, the emotional stress triggered by food insecurity may negatively affect individuals’
eating habits [34,35]. Females are generally more vulnerable to unhealthy eating habits that lead to excessive weight gain compared to males [36], which supports our findings of an increased risk of moderate obesity in food insecure female respondents. Although the rate of obesity in Korea is on the rise, it is still relatively low (BMI ≥ 30 kg/m
2) among the 34 Organization for Economic Cooperation and Development (OECD) nations (along with India, China, and Japan) at less than 5% [37]. Considering these findings, early identification of food insecure individuals/groups is imperative in order to provide effective intervention services for obesity prevention and improved health.
There are several limitations of this study. First, in order to effectively measure food insecurity, all associated aspects, such as food usability (quantitative and qualitative satisfaction), food accessibility (financial restrictions, social and psychological acceptance), and food utilization (hunger, weight loss), must be taken into account. However, a single questionnaire was used for our investigation [5]. Nevertheless, our study results are relevant, since the validity of the single questionnaire was verified [38]. Second, as a cross-sectional study, ours does not clearly illustrate the causal relationship between food insecurity and each potential factor. Third, BMI was calculated based on self-reported height and weight and was thus susceptible to underreporting, as opposed to measurements taken on site.
However, individual height and weight measurements for such a large-scale survey are impractical within the given timeframe.
Additionally, self-reported height and weight measurements are
frequently used to estimate disease prevalence and mortality
rates associated with obesity. Despite these limitations, this
study may be significant in its usage of large-scale data to
identify associations between unhealthy behaviors and food
insecurity in an effort to determine factors necessary to achieve basic health equity.
Conclusively, food insecurity was negatively associated with healthy behaviors, including non-smoking, participation in physical activities, and eating a regular breakfast in Korean adults. In men, overweight or mild obesity were negatively associated with food insecurity, whereas in women, food insecurity was associated with increased risk of moderate obesity. Further studies are needed to identify gender-specific differences in the association between food insecurity and obesity as well as to develop strategies to promote food security and health behaviors in Korean adults.
ACKNOWLEDGMENTS
I.A.C. and S.Y.R. designed research; I.A.C. and S.Y.R. conduct research; I.A.C. analyzed data; I.A.C. and S.Y.R. wrote the paper;
J.P, H.K.R. and M.A.H. reviewed the paper and provided critical revisions. S.Y.R. had primary responsibility for the final content.
All authors read and approved the final manuscript.
REFERENCES
1. Kim KR, Kim MK. Development and validation of food security measure. Korean J Nutr 2009;42(4):374-85.
2. Kim KR, Hong SA, Kwon SO, Oh SY. Development of food security measures for Korean national health and nutrition examination survey. Korean J Nutr 2011;44:551-61.
3. Kwon SO, Oh SY. Associations of household food insecurity with socioeconomic measures, health status and nutrient intake in low income elderly. Korean J Nutr 2007;40:762-8.
4. Anderson SA. Core indicators of nutritional state for difficult-to- sample populations. J Nutr 1990;120:1559-99.
5. Kim KR, Shin YJ, Kim MK. Household food insecurity and its chara- cteristics in Korea. Health and social Welfare Review 2009;29:268-92.
6. Yang KM. A study on nutritional intake status and health-related behaviors of the elderly people in Gyeongsan area. J Korean Soc Food Sci Nutr 2005;34:1018-27.
7. Nord M, Coleman-Jensen A, Andrews M, Carlson. Household food security in the United States, 2009. United States Department of Agriculture; 2010 [cited 2014 Oct 7]. Available from: http://www.ers.
usda.gov/briefing/foodsecurity
8. Yim KS. Health-related behavioral factors associated with nutritional risks in Korean aged 50 years and over. Korean J Community Nutr 2007;12:592-605.
9. Iglesias-Rios L, Bromberg JE, Moser RP, Augustson EM. Food insecurity, cigarette smoking, and acculturation among Latinos:
data from NHANES 1999-2008. J Immigrant Minority Health 2013;
Doi 10.1007/s10903-013-9957-7
10. Sarlio-Lahteenkorva S, Lahelma E. Food insecurity is associated with past and present economic disadvantage and body mass index.
J Nutr 2001;131:2880-84.
11. Mohammadi F, Omidvar N, Harrison GG, Ghazi-Tabatabaei M, Abdollahi M, Houshiar-Rad A, Mehrabi Y, Dorosty AR. Is Household food insecurity associated with overweight/obesity in women?
Iranian Journal of Public Health 2013;42:380-90.
12. Adams EJ, Grummer-Strawn L, Chavez G. Food insecurity is associated with increased risk of obesity in California women. J Nutr
2003;133:1070-74.
13. Kim KR, Frongillo EA. Participation in food assistance programs modifies the relation of food insecurity with weight and depression in elders. J of Nutr 2007;137:1005-10.
14. Townsend MS, Peerson J, Love B, Achterberg C, Murphy SP. Food insecurity is positively related to overweight in women. J Nutr 2001;131:1738-45.
15. Korea Center for Disease Control and Prevention. Community health survey operational guide. Seoul: Korea Center for Disease Control and Prevention, 2011.
16. Shim JS, Oh KW, Nam CM. Association of household food security with dietary intake -based on the third (2005) Korea national health and nutrition examination survey (KNHANES Ⅲ) - Korean J Nutr 2008;41:174-183.
17. Alaimo K, Briefel RR, Frongillo EA, Olson CM. Food insufficiency exists in the United States: results from the third National Health and Nutrition Examination Survey (NHANES Ⅲ). Am J Public Health 1998;88:419-26.
18. The Asia-Pacific perspective. Redefining obesity and its treatment.
Health Communications Australia. 2000.
19. Matheson J, Mclntyre L. Women respondents report higher house- hold food insecurity than do men in similar Canadian households.
Public Health Nutrition 2013; Doi:10.1017/S136898001300116X 20. Souza Bittencourt L, Santos SMC, Jesus Pinto E, Aliaga MA, Cassia
Ribeiro-Silva R. Factors associated with food insecurity in house- holds of public school students of salvador city, Bahia, Brazil. J Health Popul Nutr 2013;31:471-9.
21. Ministry for Health, Welfare and Family Affairs, Korean Centers for Disease Control and Prevention. Korean Health Statistics 2010: Korean National Health and Nutrition Examination Survey (KNHANES V-1).
2010.
22. McPhillips JB, Eaton CB, Gans KM, Derby CA, Lasater TM, Mckenney JL, Carleton RA. Dietary differences in smokers and nonsmokers from two southeastern New England communities. J Am Diet Assoc 1994;94:287-92.
23. Dewing S, Tomlinson M, Roux IM, Chopra M, Tsai AC. Food insecurity and its association with co-occurring postnatal depression, hazar- dous drinking, and suicidality among women in peri-urban South Africa. J Affect Disord 2013;150:460-5.
24. Kim JS, Lee GN. The comparison between physical activity and health related factors of the Korean male adult. Journal of Korean Biological Nursing Science 2012;14:166-73.
25. Lee JW. Effects of frequent eating-out and breakfast skipping on body mass index and nutrients intake of male adults: analysis of 2001 Korea National Health and Nutrition Survey data. Korean J Community Nutr 2009;14:789-97.
26. Keino S, Plasqui G, Borne BV. Household food insecurity access: a predictor of overweight and underweight and underweight among Kenyan women. Agriculture & Food Security 2014;3. Doi:10.1186/
2048-7010-3-2
27. Jyoti DF, Frongillo EA, Jones SJ. Food insecurity affects school children's academic performance, weight gain, and social skills. J Nutr 2005;135:2831-9.
28. Oh SY, Hong MJ. Food insecurity is associated with dietary intake and body size of Korean children from low-income families in urban areas. Eur J Clin Nutr 2003;57:1598-604.
29. Son SM, Lee JH, Yim KS, Cho YO. Diet and Body Shaping. Gyeonggi- do Paju-si: Kyomun publishing Co.; 2009. P.8-22.
30. Dietz WH. Does hunger cause obesity? Pediatrics 1995;95:766-7.
31. Lee SM. Association of whole grain consumption with socio- demographic and eating behavior factors in a Korean population:
based on 2007-2008 Korea national health and nutrition examina- tion survey. Korean J Community Nutr 2011;16:353-63.
32. Epstein LH, Dearing KK, Paluch RA, Roemmich JN, Cho D. Price and maternal obesity influence purchasing of low- and high-energy- dense foods. Am J Clin Nutr 2007;86:914-22.
33. Townsend MS, Aaron GJ, Monsivais P, Keim NL, Drewnowski A.
Less-energy-dense diets of low-income-women in California are associated with higher energy-adjusted diet costs. Am J Clin Nutr 2009;89:1220-6.
34. Frongillo EA. Understanding obesity and program participation in
the context of poverty and food insecurity. J Nutr 2003;133:2225-31.
35. Laitinen J, Ek E, Sovio U. Stress-related eating and drinking behavior and body mass index and predictors of this behavior. Prev Med 2002;34:29-39.
36. Yoon JS, Jang HK. Diet quality and food patterns of obese adult women from low income classes -based on 2005 KNHANES-. Korean J Community Nutr 2011;16:706-15.
37. OECD. Health at a Glance 2011. OECD indicators, OECD Publishing 2011. [cited 2014 Oct 7] Available from:http://dx.doi.org/10.1787/
health_glance-2011-en.
38. Alaimo K, Olson CM, Frongillo EA. Importance of cognitive testing for survey items: an example from food security questionnaires.
Journal of Nutrition Education 1999;31:269-75.