Stability Analysis of Mooring Lines of a Submersible Fish Cage System Using Numerical Model
Tae-Ho Kim†․Kyu-Serk Hwang1
(Received May 11, 2011; Revised May 31, 2011; Accepted Junr 17, 2011)
Abstract: A numerical model analysis was performed to analyze the stability of the mooring lines of an automatic submersible fish cage system in waves and currents. The fish cage system consisted of a 12-angled rigid frame, net cage, cover net, 12 upper floats, 12 tanks(for fixed and variable ballast), mooring lines, anchors, and a control station. Simulations were performed with the cage at the surface of the water and at a depth of 20 m. A Morison equation type model was used for simulations of the system in two configurations. The force parameters described both regular and random waves, with and without currents, and their values were input to the model. Mooring tension calculations were conducted on the mooring lines, grid lines and lower bridle lines of the cage. The stability of the mooring lines was checked under both static and dynamic conditions.
Key w ords: Numerical analysis, Automatic submersible fish cage, Static tension, Wave and current loadings, Mooring tension
†Corresponding Author(School of Marine Technology, Chonnam National University, E-mail: [email protected], Tel: 061-659-7121)
1 Sungsin Shipyard Co., Ltd
1. Introduction
The development of offshore fish cage technology has recently been driven by the limits to expansion being faced by aquaculture production in the near shore and semi-enclosed bays of Korea[1]. However, offshore sites have their own challenges, including increased wave action, which may cause damage to the cages and fish to become stressed; potential conflict with shipping lanes; and the possible lack of access to service the farms during adverse conditions, especially weather.
The submersible fish cage system was developed to reduce the reduction of the wave and current loadings on a fish cage. Several offshore submersible cages, such as Polar Cirkle, SUB flex, SADCO Shelf and Ocean Spar, which are operated by compressed air, have been developed[2]. In particular, several submersible Ocean Spar fish
cages(from the United States) have been deployed off Jeju and Geomun Islands in Korea. Experience has shown that these systems require two or more divers for their proper maintenance, however, which incurs substantial expense. Similar to traditional Korean surface cages, which allow harvesting, stock inventory and inspection without the need of divers, the development of a new system is needed to save operational costs.
Thus, an automatic submersible fish cage system which can move vertically within the water column via adjustments of the weight and buoyancy of the cage with an automatic control system has been developed. The submerging performances of the variable ballast tank for the cage and the submersible cage system have previously been reported by Kim et al.[3, 4]. In addition, Kim[5]
conducted a numerical analysis on the motions of
the submersible fish cage system.
A numerical model study was conducted to investigate the mooring tension acting on the mooring lines, grid lines and lower bridle lines of an automatic submersible cage system. Especially, the geometry of submerged bridle lines, which are set in the water to maintain the necessary angles and tension or strain on the lines, depends on the depth of the line below the surface(submerged midwater depth). The system was analyzed using a spread mooring configuration with four anchor legs.
The numerical model used the Finite Element Analysis approach described in Tsukrov et al.[6, 7].
The objectives of this study were to determine the mooring tension response of the cage system at two locations within the water column. A numerical model was constructed, with simulations performed and responses obtained.
2. Materials and methods
2.1 Structure of submersible fish cage system
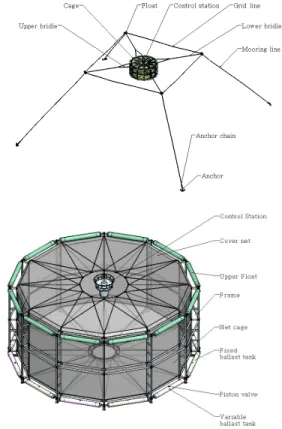
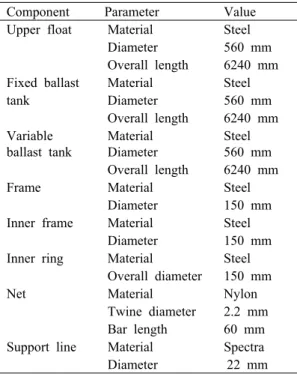
The automatic control system of the fish cage monitors environmental parameters, such as the wave height and wind speed, so the cage can be submerged in extreme sea states and then surfaced after the weather has passed[4]. Being able to remotely remove fish cages from the sea surface during extreme storm events will help to prevent damage. The fish cage system consisted of a 12-angled rigid frame, net cage, cover net, 12 upper floats, 12 tanks(for fixed and variable ballast), mooring lines, anchors, and a control station, as shown in Figure 1. In particular, the upper part of the frame contained a fixed flotation and the lower part both fixed ballast tanks and variable ballast tanks. The buoyancy of the variable ballast tanks was remotely adjustable. A surface control system operated a switch that enabled compressed air or seawater to enter the tanks to either submerge or surface the fish cage. The
control station was able to regulate both the inflow and outflow of air or seawater to and from the variable ballast tanks in response to the surface environmental conditions. The control station incorporated both wave and wind speed sensors, with a GPS and controller(computer included control program, A/D-D/A board, data acquisition components). The cage was fixed to the bottom using a spread mooring system, and was able to move vertically via the water column through a single grid square connected to the mooring system.
The details of the cage and mooring system are provided in Tables 1 and 2.
Figure 1: General schematic of an automatic submersible fish cage system with a spread mooring system.
2.2 Numerical model
Numerical model simulations were performed
using a finite element computer program developed specifically for marine aquaculture applications, Aqua-FE. The program has been described in Tsukrov et al.[6, 7]. Wave and current loadings on the truss and buoy elements were introduced by utilizing the Morison equation[8]. The algorithm employs a nonlinear Lagrangian formulation to account for large displacements in the structural elements. In addition, the unconditionally stable Newmark direct integration scheme was adopted to solve the nonlinear equations of motion. The hydrodynamic forces on the structural elements were calculated using the Morison equation, modified to account for the relative motion between the structural element and the surrounding fluid, as described by Haritos and He[9].
The numerical model requires all of the geometric and material properties of the fish cage and mooring system to be prescribed. The parameters included the mass density, Young’s modulus and cross sectional area of each element
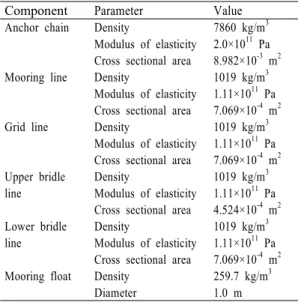
Table 1: Details of the submersible fish cage system.
Component Parameter Value Upper float Material Steel
Diameter 560 mm
Overall length 6240 mm
Fixed ballast Material Steel
tank Diameter 560 mm
Overall length 6240 mm
Variable ballast tank
Material Diameter
Steel 560 mm
Overall length 6240 mm
Frame Material Steel
Diameter 150 mm
Inner frame Material Steel
Diameter 150 mm
Inner ring Material Steel Overall diameter 150 mm
Net Material Nylon
Twine diameter 2.2 mm
Bar length 60 mm
Support line Material Spectra
Diameter 22 mm
component. Based on the information provided in Tables 1 and 2, the model representation of the components was determined, with the results provided in Tables 3 and 4.
Table 2: Mooring system design particulars of the submersible fish cage system.
Component Parameter Value Anchor chain Material Steel
Linear mass 70.6 kg/m
Length 25 m
Mooring line Material Spectra
Diameter 30 mm
Length 100 m
Grid line Material Spectra
Diameter 30 mm
Length 76.6 m
Lower bridle Material Spectra
line Diameter 30 mm
Length 36.5 m
Upper bridle Material Spectra
line Diameter 24 mm
Length 10 m
Float Diameter 1.0 m
Mass 136 kg
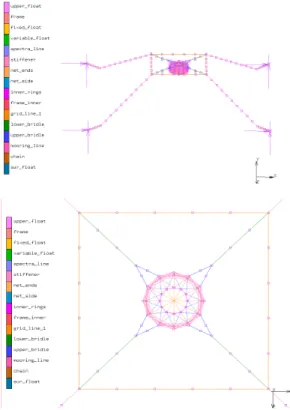
Along with the material and geometric properties, the dimensions and configuration of the cage system were then used to build the numerical model. Model schematics are shown in Figures 2 and 3. Also shown in Figure 2 is the orientation of the system to the wave and current environmental loading. Both Figures 2 and 3 show the major components of the mooring system, including the grid lines, mooring lines, anchor chain and the upper and lower bridle lines.
Simulations were performed with the cage at the surface and at a depth of 20 m, as shown in Figure 4. In both situations, the depth at the site was 50 m. The CPU model of computer used in the simulation was Dell PowerEdge 4600 configured with Intel 2.2GHz Xeon processor.
Table 3: Details of the submersible fish cage component model.
Component Parameter Value Upper float Density 235.2 kg/m3
Modulus of elasticity 2.0×10¹¹Pa Cross sectional area 0.209 m2 Fixed ballast Density 1025 kg/m3 tank Modulus of elasticity 2.0×10¹¹Pa
Cross sectional area 0.209 m2 Variable Density(surface) 1481 kg/m3 ballast tank Density(submerged) 1579 kg/m3 Modulus of elasticity 2.0×10¹¹Pa Cross sectional area 0.209 m2
Frame Density 1638 kg/m3
Modulus of elasticity 2.0×10¹¹Pa Cross sectional area 0.0202 m2
Inner frame Density 1534 kg/m3
Modulus of elasticity 2.0×10¹¹ Pa Cross sectional area 0.0209 m2
Inner ring Density 2559 kg/m3
Modulus of elasticity 2.0×10¹¹ Pa Cross sectional area 0.012 m2
Net Density 994 kg/m3
Modulus of elasticity 1.02×10¹¹ Pa Cross sectional area 3.801×10⁻⁶ m2
Stiffener Density 1025 kg/m3
Modulus of elasticity 2.5×10¹¹Pa Cross sectional area 5.00×10⁻⁶ m2 Support line Density 994 kg/m3
Modulus of elasticity 1.02×10¹¹Pa Cross sectional area 3.801×10⁻⁴ m2 Table 4: Details of mooring system components for the submersible fish cage.
Component Parameter Value Anchor chain Density 7860 kg/m3
Modulus of elasticity 2.0×10¹¹ Pa Cross sectional area 8.982×10⁻³ m2 Mooring line Density 1019 kg/m3
Modulus of elasticity 1.11×10¹¹ Pa Cross sectional area 7.069×10⁻⁴ m2
Grid line Density 1019 kg/m3
Modulus of elasticity 1.11×10¹¹ Pa Cross sectional area 7.069×10⁻⁴ m2 Upper bridle Density 1019 kg/m3 line Modulus of elasticity 1.11×10¹¹ Pa
Cross sectional area 4.524×10⁻⁴ m2 Lower bridle Density 1019 kg/m3 line Modulus of elasticity 1.11×10¹¹ Pa
Cross sectional area 7.069×10⁻⁴ m2 Mooring float Density 259.7 kg/m3
Diameter 1.0 m
Figure 2: Overview of the numerical model system components for the cage system.
Lower Bridle Line 1 Upper Bridle Line 1
Lower Bridle Line Upper Bridle Line 4
Upper Bridle Line 2 Upper Bridle Line 3
Figure 3: Bridle line details of the numerical model system components.
(a)
(b)
Figure 4: Side view of the fish cage at the surface(a) and submerged position(b).
2.3 Wave and current input parameters
The numerical model also required environmental forcing parameters. The first set of simulations was conducted with no wave and current load to verify static conditions. Once the static conditions had been verified, the forcing load, consisting of regular and random wave conditions both with and without a superimposed current of 1.0 m/s, was input to the model. Twelve regular wave load cases were prescribed, both with and without current. The details are provided in Table 5. In addition to the regular wave, random wave simulations were also performed. The model was forced with a JONSWAP(Joint North Sea Wave Project) type wave profile with a significant wave height of 9.51 m and peak period of 14.01 s, which were chosen according to a design wave condition of the southern sea in Korea over 20-year return periods[10]. For both the surface and submerged configurations, a total of 30 numerical model simulations were performed. The simulations were estimated approximately 6 hours for regular waves and 11 hours for random waves. In addition, the simulations were performed for duration of 500 seconds with time step of 0.005 seconds.
Table 5: Wave and current parameters for each regular wave load case.
Load case Currents
(m/s) Wave
heights (m) Periods (s)
1 0 2.55 6.11
2 1.0 2.55 6.11
3 0 3.53 7.08
4 1.0 3.53 7.08
5 0 4.22 8.75
6 1.0 4.22 8.75
7 0 6.85 11.82
8 1.0 6.85 11.82
9 0 8.66 13.26
10 1.0 8.66 13.26
11 0 10.25 15.11
12 1.0 10.25 15.11
2.4 Data analysis
Regular wave tests were conducted, using numerical modeling methods, for the load cases provided in Table 5. The environmental forcing input into the numerical model also consisted of an irregular wave profile. To obtain an irregular wave profile in the numerical routine, a spectrum was decomposed into multiple frequency components.
The spectrum chosen was a form of the JONSWAP spectrum[11]. The data processing was provided in a past study by Kim[12].
2.5 Cage motion response locations
Figure 5: Numerical model representation of the fish cage system.
It should be noted that these processing techniques work well for the simulations with only waves since the response can be assumed to be linear.
In cases with a strong 1.0 m/s current, tensions can be considered a highly nonlinear response; therefore,
the results of these analysis techniques can be difficult to interpret. For this reason, the RAO(response amplitude operator) calculations were made for the load cases without the 1.0 m/s current.
For each simulation, tension response data sets were acquired to characterize the motion of the cage. Numerical model representations of the fish cage system are shown in Figure 5. Referring to Figures 2 and 3, the tension values from each of the anchor chain, mooring lines, grid lines and bridle lines were obtained. In this analysis, however, data sets from only mooring lines #1 and
#2, grid line #1 and lower bridle line #1 were processed.
3. Results and discussion
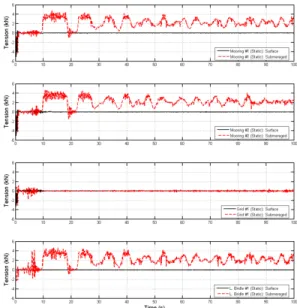
The first set of numerical model simulations was performed without current and wave loading. In each of the simulations, the buoyancy of the cage created vertical motion as the mooring lines became stretched, pre-tensioning the components. Two static simulations were performed; in the first simulation, the cage was placed at the surface, with the depth of the rim set at 0 m. In the second simulation, the cage was placed at a depth of 20 m. The static tension results are shown in Figure 6 and Table 6.
The static tensions acting on the mooring lines of a submersible fish cage system with the submerged configuration were larger than with the surface configuration. Especially, the tension of the lower bridle line in the submerged position was 128.7 times larger than that in the surface position.
Conversely, the tension of the grid line under the submerged condition was 2.3 times larger than that under the surface condition. The tension of bridle lines is critical for maintaining the underwater stability of the cage. In particular, in order to obtain more efficient bridle lines, it is necessary to maintain structural tension without compromising flexibility which depends on the geometry of the
lines and the submerging performance of the system. The bridle lines under the surface condition were a static structure, as shown in Figure 4(a).
The tension was maintained by the buoyancy of the cage and did not require any particular geometry.
The bridle lines under the submerged condition, in comparison, were a dynamic geometric structure, as shown in Figure 4(b). The structural tension of the submerged bridle lines, and their capacity to remain flexible in order to maintain their dynamic geometry, depends on the anchoring system, positive buoyancy of the mooring floats, and the angle of the bridle lines, which were established from the relationship between the length of the bridle lines and the submerged depth.
Figure 6: Tension of the static simulations. Note that at time = 0 seconds the cage is at its initial prescribed depth(surface: 0 m, submerged: 20 m).
The next set of simulations was performed with regular waves, both with and without a 1.0 m/s current(co-linear), for the surface and submerged models. The wave and current wave parameters are shown in Figure 3.
Data sets were obtained for the tension in the
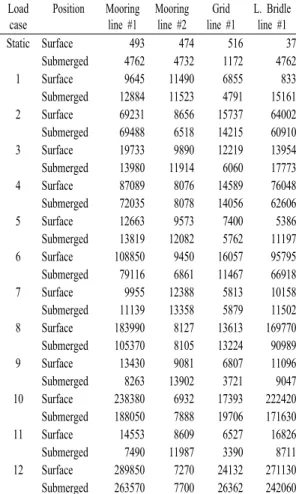
mooring lines #1 and #2, grid line #1 and lower bridle line #1(as shown on Figures 3 and 4). The tensions in the selected mooring components were also examined. Processing programs were written to examine the time series tension data sets. The tension response is non-regular; therefore, computing linear RAOs was not practical. Instead, the maximum tension values for each of the data sets were determined. These values are provided in Table 6. The results of the tension transfer function for the regular wave simulations without a current are shown in Figure 7.
Table 6: Maximum mooring tensions of the submersible fish cage under regular waves without current and with a 1.0 m/s current.
(unit: N) Load
case
Position Mooring line #1
Mooring line #2
Grid line #1
L. Bridle line #1
Static Surface 493 474 516 37
Submerged 4762 4732 1172 4762 1 Surface 9645 11490 6855 833 Submerged 12884 11523 4791 15161 2 Surface 69231 8656 15737 64002 Submerged 69488 6518 14215 60910 3 Surface 19733 9890 12219 13954 Submerged 13980 11914 6060 17773 4 Surface 87089 8076 14589 76048 Submerged 72035 8078 14056 62606 5 Surface 12663 9573 7400 5386 Submerged 13819 12082 5762 11197 6 Surface 108850 9450 16057 95795 Submerged 79116 6861 11467 66918 7 Surface 9955 12388 5813 10158 Submerged 11139 13358 5879 11502 8 Surface 183990 8127 13613 169770 Submerged 105370 8105 13224 90989 9 Surface 13430 9081 6807 11096 Submerged 8263 13902 3721 9047 10 Surface 238380 6932 17393 222420 Submerged 188050 7888 19706 171630 11 Surface 14553 8609 6527 16826 Submerged 7490 11987 3390 8711 12 Surface 289850 7270 24132 271130 Submerged 263570 7700 26362 242060
Once the static and regular wave tests had been completed, the random wave tests were conducted, with and without the 1.0 m/s superimposed current, for both the surface and submerged configurations.
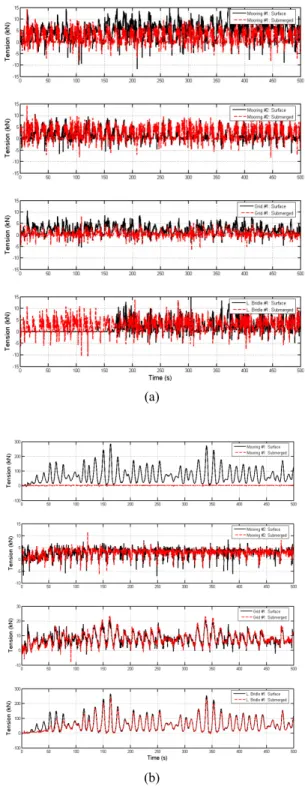
Simulations were performed using the JONSWAP wave spectrum, with and without the superimposed, co-linear current. Examples of the time series results for the simulations, with and without current, are shown in Figure 8. Next, using the time series results, the spectral representation of the wave input, the tension responses were calculated.
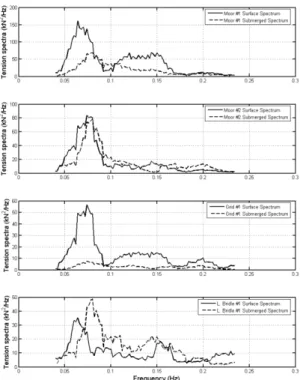
The tension spectral results of the random wave simulations, without a current, are provided in Figure 9. The tension response in the mooring system was also investigated for both the surface and submerged configurations, both with and without a current. The significant tension response of the submersible fish cage system is shown in Table 7.
Figure 7: Tension transfer function results of the regular wave simulations without current.
The maximum values from the time series were identified, and provided in Table 8. The maximum mooring tensions of the cage system in irregular wave and a 1.0 m/s current were 286,450 N in mooring line #1 and 267,230 N in lower bridle line
#1. In addition, the safety of the mooring lines listed in Table 3 was checked on the basis of the tensile strength of the Spectra rope[13]. Assuming a safety factor of 1.25[14], the maximum tensions in Table 8 were recalculated, and found to be 358,063 N in mooring line #1, 29,179 N in grid line #1 and 334,038 N in lower bridle line #1. The Spectra rope, with a diameter of 22mm, was confirmed to remain safe enough to withstand the hydrodynamic loadings to the cage under random wave and a 1.0 m/s current. The mooring tensions under the submerged condition were somewhat smaller than those under the surface condition with waves and currents.
When the cage is in a submerged state; however, compensation will be made for the slack in the mooring lines. Using only the variable ballast system, without the presence of taut mooring lines, could result in oscillations around the cage, potentially leading to an unstable system, which may be detrimental to the caged fish stock[4]. The presence of taut mooring lines could reduce cage oscillations. Therefore, the mooring lines containing the bridle connections to the cage always should be taut and relatively tensioned. In the presence of a relatively large tension from the bridle lines to the cage, a slightly negatively or positively buoyant state should be established as required and maintained using the variable ballast system to confer stability on the submersible cage system at the desired depth. Another approach would consist of collecting the slack portion of the mooring line, with cage based or anchor based mechanisms, to make the mooring lines taut when the cage reaches the desired depth, and to then bestow and maintain a slightly positive buoyant state.
(a)
(b)
Figure 8: Tension time series results acting on mooring lines of the cage in both the surface and submerged positions under random wave without current(a) and with a 1.0 m/s current(b).
Table 7: Significant tension response of the submersible fish cage system under random wave without current.
(unit: N) Configuration Mooring
line #1
Mooring line #2
Grid line #1
L. Bridle line #1 Surface 11423.5 7238.5 6399.6 5741.2 Submerged 7775.3 7204.1 2862.1 6619.1
Table 8: Maximum tensions of submersible fish cage system under random wave without current and with a 1.0 m/s current.
(unit: N) Load
case
Position Mooring line #1
Mooring line #2
Grid line #1
L. Bridle line #1 W i t h o u t
current
Surface 19779 10586 10629 15020 Submerged 14599 14227 8017 13634 1.0 m/s
current
Surface 286450 8297 21110 267230 Submerged 258640 11509 23343 237640
Figure 9: Tension spectral results of the random wave simulations without current.
4. Conclusion
The results of the mooring tension response for
an automatic submersible fish cage system were obtained using the results from a numerical model.
Simulations of the system were conducted using a Morison equation type model. The first set of tests was conducted with the fish cage system, with no force, to verify the static characteristics of the system. The next set of tests was performed with the numerical model in regular and irregular waves(JONSWAP spectrum), both with and without the 1.0 m/s current. The calculations for the tension on the mooring line, grid line and bridle line were then conducted. The static tensions acting on the mooring lines of the cage with the submerged configuration were larger than with the surface configuration. In addition, the static and dynamic tensions were very large in mooring line #1 and lower bridle line #1 compared with those in mooring line #2 and grid line #1. It was confirmed that the mooring lines provided in this study remained safe enough to withstand the hydrodynamic loadings to cage under waves and currents. The tension of bridle lines is critical for maintaining the underwater stability of the cage.
Further verifications, using physical model tests, in-situ measurements and structural analysis, will be needed to more accurately analyze the hydrodynamic characteristics of the cage system so that the results of the study could be practically useful.
Acknowledgements
This research was supported by Technology Development Program for Fisheries, Ministry for Food, Agriculture, Forestry and Fisheries, Republic of Korea.
References
[1] T.H. Kim, K.U. Yang, D.J. Jang and D.W.
Fredriksson, “The submerging characteristics of a submersible fish cage system operated by
compressed air”, Marine Technology Society Journal, vol. 44, no. 1, pp. 57-68, 2010.
[2] V. Mitrovich, “The wait is over”, Fish Farming International, vol. 37, no. 2, pp.
20-24, 2010.
[3] T.H. Kim, J.G. Hur and K.U. Yang,
“Submerging performances of automatic submersible buoy operated by air control”, Journal of the Korean Society of Marine Engineering, vol. 34, no. 5, pp. 743-749, 2010 (in Korean).
[4] T.H. Kim, K.U. Yang, K.S. Hwang, D.J. Jang and J.G. Hur, “Automatic surfacing and submerging performances of model fish cage system operated by air control”, Aquacultural Engineering, 2011(in Press).
[5] T.H. Kim, “Motion characteristics of a Korean designed submersible fish cage system in waves and currents using numerical analysis”, International Journal of Aquatic Science, vol.
2. no. 1, pp. 48-67, 2011.
[6] I. Tsukrov, O. Eroshkin, D.W. Fredriksson, M.R. Swift and B. Celikkol, “Finite element modeling of net panels using consistent net elements”, Ocean Engineering, vol. 30, pp.
251-270, 2003.
[7] I. Tsukrov, O. Eroshkin, W. Paul and B.
Celikkol, “Numerical modeling of nonlinear elastic components of mooring systems”, IEEE Journal of Oceanic Engineering, vol. 30, no. 1, pp. 37-46, 2005.
[8] J.R. Morison, J.W. Johnson, M.P. O’Brien and S.A. Schaaf, “The forces exerted by surface waves on piles”, Petroleum Transactions.
American Instute Of Mining Engineering, pp.
149-157, 1950.
[9] N. Haritos and D.T. He, “Modelling the response of cable elements in an ocean environment”, Fin. Elem. In Analysis and Des., vol. 19, pp. 19-32, 1992.
[10] www. kordi.re.kr
[11] K. Hasselmann, “Measurements of wind-wave growth and swell decay during the Joint North Sea Wave Project(JONSWAP)”, Deutsche Hydrographische Zeitschrift. Reihe, vol. 12, 1973.
[12] T.H. Kim, “Mooring tension and motion characteristics of a floating fish reef with pipe in waves and currents using numerical model”, Journal of the Korean Society of Marine Engineering, vol. 34, no. 7, pp. 997-1008, 2010.
[13] M. Beveridge, Cage aquaculture 3rd edition, Blackwell publishing, pp. 109-110, 2004.
[14] www.novabraid.com/rope/spectec.html
Author Profile
Tae-Ho Kim
He received the B. F. degree from Yosu National University and M. F. and Ph. D. degrees from Pukyong National University. He had been with National Fisheries Research and Development Institute as a researcher and senior researcher. He is currently a associate professor in the School of Marine Technology at Chonnam National University.
Kyu-Serk Hwang
He received the B. E. degree from Pukyong National University. He had been with Sin Young Marine Engineering Co., Ltd. as a president.
He served as an adjunct professor in Tong Myong College. He is currently a technical director of Sungsin Shipyard Co., Ltd.