Introduction
The medial longitudinal arch (MLA) is a concave structure consisting of the calcaneus, talus, and na- vicular bones; three cuneiform bones; and the first to third metatarsal bones, and it contributes to body weight distribution and shock absorption during standing, walking, and other weight-bearing activities (Franco, 1987). It is supported by various passive and
active structures. Strong ligamentous structures, such as the spring ligament and plantar fascia, create ten- sion to prevent downward displacement of the arch (Franco, 1987; Neumann, 2013). Together with the ligaments, active muscular structures such as the ti- bialis anterior (TA), tibialis posterior (TP), peroneus longus (PL), and abductor halluces (ABH) (Jung et al, 2011; Murley et al, 2009; O’Connor and Hamill, 2004) are also critical to supporting the MLA in more
Corresponding author: Hye-seon Jeon [email protected]
This study was in part supported by the “Brain Korea 21 PERUS Project (Grant No. 2016-51-0009)”, the Korean Research Foundation for Department of Physical Therapy in the Graduate School of Yonsei University.
Comparison of the Foot Muscle EMG and Medial Longitudinal Arch Angle During Short Foot Exercises at Different Ankle Position
Hyeo-bin Yoon1, BPT, PT, Ji-hyun Kim1, BPT, PT, Joo-hee Park1, MSc, PT, Hye-seon Jeon2,3, PhD, PT
1Department of Physical Therapy, The Graduate School, Yonsei University
2Department of Physical Therapy, College of Health Science, Yonsei University
3Department of Ergonomic Therapy, The Graduate School of Health Science, Yonsei University
Abstract
1)Background: The MLA is supported by both the abductor hallucis (ABH) and the extrinsic muscles.
Insufficient muscular support may lower the MLA when the body’s weight is applied to the foot. The short foot exercise (SFE) is effective in increasing the height of the MLA for people with flat feet. Most of the research related to the SFE has simply evaluated the efficiency of the exercise using enhanced ABH electromyography (EMG) activation. Since the tibialis anterior (TA), peroneus longus (PER), and ABH are all involved in supporting the MLA, a new experiment design examining the EMG of the selected muscles during SFE should be applied to clarify its effect.
Objects: Therefore, this study aimed to clarify the effect of the SFE in different ankle position on the MLA angle and the activation of both the intrinsic and extrinsic muscles and to determine the optimal position.
Methods: 20 healthy subjects and 12 subjects with flat feet were recruited from Yonsei University. The surface EMG and camera were used to collect muscle activation amplitude of TA, PER, and ABH and to capture the image of MLA angle during SFE. The subjects performed the SFE while sitting in three different ankle positions—neutral (N), dorsiflexion (DF) at 30 degrees, and plantar flexion (PF) at 30 degrees.
Results: ABH EMG amplitudes were significantly greater in N and DF than in PF (p<.05). Muscle activation ratio of TA to ABH was the lowest in PF (p<.05). MLA angle in both groups significantly decreased in PF (p<.01). The TA and ABH was activated at the highest level in DF. However, in PF, subjects significantly activated the ABH and PER with relatively low activation of TA.
Conclusion: Therefore, researchers need to discuss which SFE condition most effectively use the arch support muscle for flat foot.
Key Words: Flat foot; Medial longitudinal arch; Short foot exercise.
challenging and dynamic situations (Neumann, 2013).
Flat foot, the excessive pronation of the foot, is vul- nerable to musculoskeletal conditions including fatigue or pain (Heo and An, 2014; Rose, 1991), plantar fas- ciitis (Pohl et al, 2009), hallux valgus (Easley and Trnka, 2007), and laxity of the ligaments (Bertani et al, 1999). In addition, those with flat feet experience chal- lenges in controlling balance and gait (Tsai et al, 2006).
Various passive and active therapeutic approaches have been used to treat flat feet. A systematic review re- ported moderate to good results from foot orthosis in improving physical function and decreasing pain and rear foot inversion. However, these passive therapeutic methods have only low level evidence to improve pain, reduce rearfoot eversion, alter loading and impact forces and reduce rearfoot inversion and eversion moments in flat foot (Banwell et al, 2014).
Various extrinsic and intrinsic foot muscles con- tribute significantly to supporting the MLA in dy- namic situations. Therefore, strengthening exercises, such as the toe curl exercise (Jung et al, 2011), picking up objects, and shin curls (Prentice and Kaminski, 2004; Anderson and Parr, 2013), are rec- ommended to manage excessive pronation of the foot and to maintain the normal height of the MLA. More recently, the short-foot exercise (SFE) has been rec- ognized as an outstanding method for achieving a normal MLA. The SFE is closely associated with immediate enhancement of ABH muscle activity and decreases in the MLA angle (Jung et al, 2011).
According to previous experiments, the SFE is more effective at achieving these goals than other exercises. However, no research has been done to more inclusively evaluate the effect of the SFE on
the activation of the arch support muscles (ABH, TA, and PER) together: In addition, a previous study suggested that different ankle positions could alter the effectiveness of the SFE secondary to the length-tension relationship, and no study has exam- ined intrinsic and extrinsic arch support muscle acti- vation during SFE at different ankle positions.
We therefore designed an experimental protocol to identify the most effective ankle position during SFE according to the activity of the TA, PER, and ABH and the MLA angle. We compared three different an- kle positions—neutral, dorsiflexion, and plantar flexion.
Methods
SubjectsIn this study, 20 healthy subjects (8 males and 12 females, age=22.3, height=167.8 ㎝, mass=61.4 ㎏) with normal arches and 12 subjects with flat feet (5 males and 7 females, age=23.9, height=170.1 ㎝, mass=63.1
㎏) were recruited from Yonsei University. The ex- aminer conducted the navicular drop (ND) test twice.
Based on the average values found by the ND test, we categorized the subjects into the normal arch group (ND=5-9 ㎜) and the flat foot group (ND>10
㎜). Demographic information is shown in Table 1.
Subjects with any neurological disorders, past or current inflammatory arthritis, lower limb surgeries or amputations, foot deformities, or diabetes were excluded from the experiment. Prior to the data col- lection, all experimental protocols were explained to the subjects using written instructions, and all sub-
Healthy group (n1=20) Flat foot group (n2=12)
Height (㎝) 167.8±8.9a 170.1±11.0
Weight (㎏) 61.4±10.1 63.1±9.9
Age (year) 22.3±3.7 23.9±2.2
BMIb (㎏/㎡) 23.1±2.9 21.8±3.5
NDcdifference (㎜) 7.8±19 12.9±0.9
amean±standard deviations, bbody mass index, cnavicular drop difference.
Table 1. General characteristics of the subjects (N=32)
jects signed a written informed consent form. This study protocol was approved by the Institutional Review Board of Yonsei University (approval num- ber: 1041849-201705-BM-055-01).
Instrumentation
The muscle activation data for the TA, PER, and ABH were recorded using surface EMG (Noraxon TeleMyo DTS, Noraxon Inc., Scottsdale, AZ, USA) with a wireless telemetry system. The sampling rate was 1000 ㎐, and a digital band-pass filter (Lancosh FIR) between 20 and 450 ㎐ was used. Root- mean-square values were calculated with a moving window of 50 ㎳. The EMG data were analyzed us- ing the Noraxon MyoResearch 1.06 software (Noraxon Inc., Scottsdale, AZ, USA). During the SFEs, the change of the MLA angle was captured by a personal camera (Sony a500, Sony Korea, Seoul, South Korea). The ABH muscle belly was detected by sonographic guidance (Mysono U6, Medison, Seoul, South Korea).
Procedure
EMG data collection and analyses
Prior to the attachment of the electrodes, the pa- tients’ skin was shaved and cleaned with rubbing al- cohol using a sterile gauze pad to minimize im- pedance of the EMG signal. Surface electrodes (Ag/AgCl) were placed on the most prominent parts of the muscle bellies of the TA, PER, and ABH with an inter-electrode distance of 20 ㎜, parallel to the direction of the muscle fiber. The electrodes were lo- cated as follows: for the TA, one-third of the dis- tance between the head of the fibula and the tip of the medial malleolus on the leg measured to identify the correct location; for the PER, one-quarter of the distance between the head of the fibula and the tip of the lateral malleolus; for the ABH, on the point 10-20 ㎜ posterior to the navicular tuberosity and just anterior to the imaginary line outlining the ante- rior margin of the medial malleolus. The examiner
confirmed the location of the ABH muscle belly by real-time sonographic imaging (Incel et al, 2003).
The EMG data were normalized to the maximal voluntary isometric contraction (MVIC) of each subject. The MVIC was measured by the standard manual muscle testing methods. The TA MVIC was obtained in the sitting position with the knee joint flexed to 90 degrees. The examiner gripped the sub- ject’s distal calf and applied manual resistance to the medial and dorsal surface of the foot in the opposite direction (Kendal et al, 1983). To measure the MVIC of the PER, the investigator applied manual resist- ance to the lateral and plantar surface of the foot to resist eversion and plantar flexion. The MVIC of the ABH was tested with the ankle in the neutral posi- tion, and manual resistance was applied to the me- dial side of the first metatarsal and proximal phalanx to generate abduction of the metatarsophalangeal joint of the big toe. The participants performed three MVIC trials for each muscle, and in each trial, each participant maintained the maximal contraction for five seconds. The mean surface EMG amplitudes ob- tained in the middle 3s were used to calculate the MVIC percentage of each muscle.
MLA angle
To measure the MLA angle, the investigator posi- tioned each participant’s foot in a neutral position (relaxed state) by comparing the height of the medial
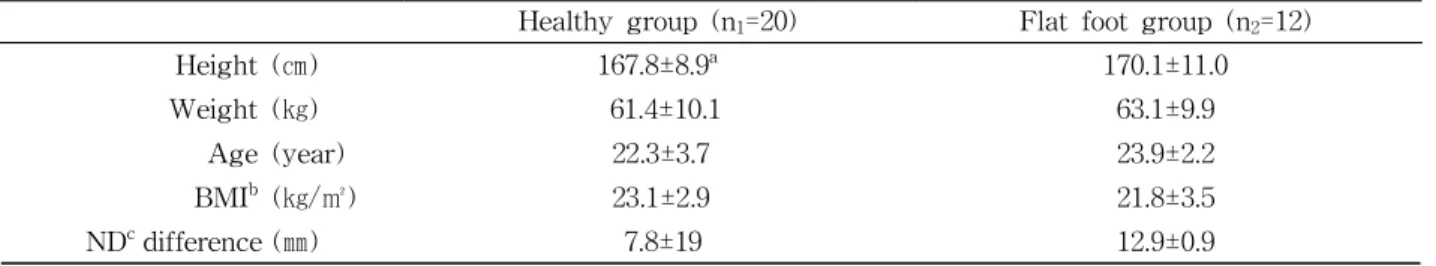
Figure 1. The medial longitudinal arch angle.
and lateral talar heads. Three reflective markers were then attached on the navicular tuberosity, the medial side of the first metatarsal head, and the me- dial aspect of the calcaneal bone. For women, the calcaneal marker was placed 30 ㎜ from the most posterior part of the calcaneus and 30 ㎜ from the bottom using a ruler; for men, the marker was placed 40 ㎜ and 35 ㎜ from each respective refer- ence location (Jung et al, 2011) (Figure 1). The camera was faced with three markers within a dis- tance of 2 m and captured images in the resting po- sition and during the SFE.
The MLA angle was calculated from the captured MLA images during the resting position and the SFE using the ImageJ software (US, National Institutes of Health, Maryland, USA) (Abramoff et al and Ram, 2014; Kuo et al and Galea, 2009). The MLA angle was defined as the angle between the line from the first metatarsal head to the navicular tuberosity and the line from the navicular tuberosity to the medial side of the calcaneal bone. The same
researcher measured the angle twice from each im- age for intra-rater reliability.
SFE
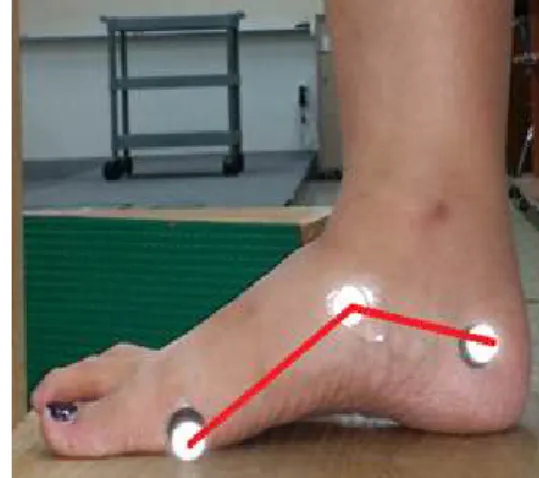
Prior to the data collection, all participants were in- structed on how to perform the SFE by demonstration and video clip instruction. They then practiced the SFE for 20 minutes under supervision to make sure that they activated the ABH during the exercise. The participants were seated in height-adjustable chairs with 90-degree hip and knee flexion. The subjects at- tempted to drag the distal end of the first metatarsal bone toward the heel without toe flexion while keep- ing the forefoot and heel on the surface (on the chair or on the inclined board). The SFE was performed in three randomly ordered ankle positions, as follows: the neutral position (N), the 30-degree dorsiflexion (DF), and the 30-degree plantar flexion (PF) (Figure 2).
The participants performed three trials, holding each for five seconds, for each SFE, and the principal in- vestigator measured the activation of the targeted
A B C
Figure 2. Three different ankle position for short foot exercise.
Muscle Group Condition
Na DFb PFc p
TAd Healthy 30.87±20.84e 38.49±28.41 16.83±11.65
<.01
Flat foot 40.46±18.6 52.68±19.4 23.80±14.01
PERf Healthy 36.15±25.54 38.35±20.78 36.94±20.87
<.65
Flat foot 40.61±24.10 40.92±20.01 46.34±22.76
ABHg Healthy 43.73±15.35 51.45±14.54 44.97±15.26
<.01
Flat foot 52.56±12.63 60.34±16.51 54.41±14.46
aneutral, bdorsiflexion, cplantar flexion,dtibialis anterior, emean±standard deviation, fperoneus longus, gabductor hallucis.
Table 2. Surface EMG amplitude (Unit: %MVIC)
muscles and the MLA angle during all sessions.
Statistical Analysis
A two-way mixed analysis of variance (ANOVA) was used for the statistical analysis. The independent variables were the groups (healthy and flat foot) and the ankle positions (neutral, dorsiflexion, and plantar flexion). When there was no group by ankle position interaction, the main effects of each independent varia- ble were interpreted. For the dependent variables in group by ankle position interaction, the simple effect of ankle position within a group was examined by sepa- rate one-way repeated ANOVA followed by a post-hoc Bonferroni test. The PASW Statistics 23 software (SPSS Inc., Chicago, IL, USA) was used for all analy- ses, and p<.05 was considered statistically significant.
Results
Muscle activation
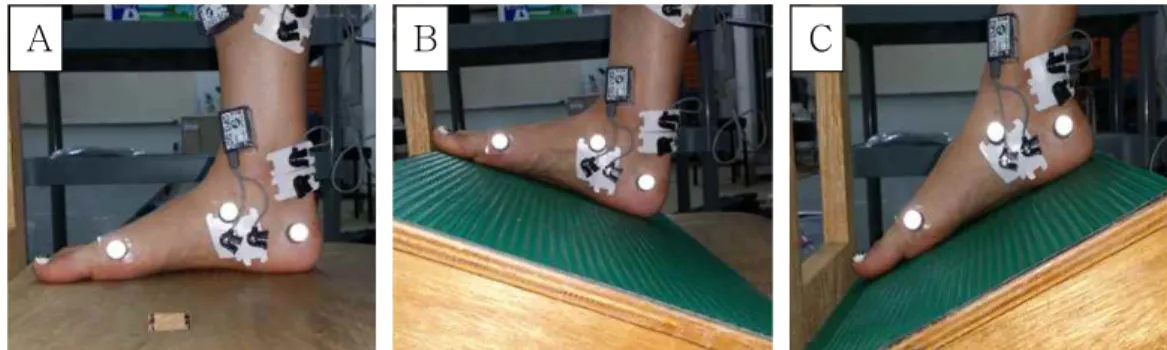
Table 2 presents the results of conducting the SFE in N, DF, and PF. According to the results of the
statistical analyses, no group by ankle position inter- action was observed in the EMG amplitude of any measured muscles. The main effect of ankle position was significant only in the TA and ABH EMG am- plitudes (Figure 3). Because there was no interaction effect, we analyzed the EMG data with one-way re- peated ANOVA. The results of the one-way repeated ANOVA showed that the TA EMG amplitudes were significantly less in PF than in the other positions (p<.05), and the ABH EMG amplitude was sig- nificantly greater in DF than in N or PF (p<.05). The TA and ABH EMG values were highest in DF, al- though the TA value was not statistically significant.
Muscle activation ratio
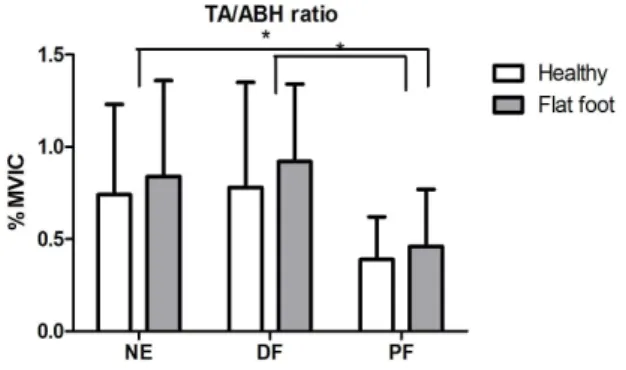
There was no statistical significance among the group by ankle position interactions in the muscle activation ratio data, and no main effect by group was observed. A significant main effect of ankle po- sition was found in the results of the muscle activa- tion ratio of TA to ABH (p<.05) (Table 3). The post-hoc results showed that this ratio was the low- est in PF among all conditions (p<.05) (Figure 4).
A B
Figure 3. The surface EMG amplitude (TA: tibialis anterior, ABH: abductor hallucis, MVIC:
maximal voluntary isometric contraction, NE: neutral, DF: dorsiflexion, PF: plantar flexion).
Muscle Group Condition
Na DFb PFc p
TAd/ABHe Healthy .74±.49f 78±.57 .39±.23
<.01
Flat foot .84±.52 .92±.41 .46±.31
PERg/ABH Healthy 36.15±24.89 38.35±20.26 36.94±20.34
<.52
Flat foot 40.61±24.07 40.92±20.01 46.34±22.76
aneutral, bdorsiflexion, cplantar flexion, dtibialis anterior, eabductor hallucis, fmean±standard deviations, gperoneus longus.
Table 3. Surface EMG amplitude ratio (Unit: %MVIC)
The activation ratio of PER to ABH was not stat- istically different among the ankle position conditions;
however, it was highest in PF.
MLA angle
There was no statistical significance among the group by ankle position interactions in the MLA angle. Significant main effects of the ankle position and group variables were found in the MLA angle.
The MLA angle of the flat foot group during the SFE was significantly smaller than that of the healthy
group (p<.014) (Table 4). The post-hoc test revealed that the MLA angle in both groups significantly de- creased in PF (p<.01), but there was no difference between the angles in N and in DF (Figure 5).
Discussion
The SFE is one of the most commonly used ther- apeutic exercises for people with flat feet. Performing SFE in the neutral ankle position immediately and effectively enhances the muscle activity of the ABH and decreases the MLA angle (Jung et al, 2011).
The purpose of this study was to determine which exercise condition most effectively activates the arch support muscles during the SFE. This is the first experimental research to examine the muscle activity of the TA, PER, and ABH; the ratios of the activity of these muscles (TA to ABH and PER to ABH);
and the MLA angle during SFE.
The involvement of the TA, PER, and ABH in the SFE is simply explained by muscle geography and kinesiology. The TA originates from the lateral con- dyle and the proximal lateral shaft of the tibia, and the PER originates from the superior two-thirds of the medial surface of the fibula. While these two ex- trinsic foot muscles originate from different locations and function antagonist, they are commonly attached on the base of the first metatarsal bone. Therefore, the consequence of a co-contraction of these muscles is the pulling of the first metatarsal bone superiorly and posteriorly, each muscle offsetting the other’s actions. Because the ABH runs from the medial process of the calcaneal tuberosity and the plantar aponeurosis to the side of the base of the proximal phalanx of the greater toe, the contraction of the ABH can create flexion in the metatarsophalangeal Figure 4. The muscle activation ratio of TA
to ABH (TA: tibialis anterior, ABH: abductor hallucis, MVIC: maximal voluntary isometric contraction, NE: neutral, DF: dorsiflexion, PF:
plantar flexion)
Group
Healthy group (n=20) Flat foot group (n=13)
change of MLA during SFE (㎜) -4.13±1.26a -5.13±1.73
amean±standard deviations.
Table 4. Main Effect of MLA angle by group Figure 5. The change of MLA angle during
SFE (NE: neutral, DF: dorsiflexion, PF: plantar flexion)
(MTP) joint.
The ABH contributes to maintaining the normal height of the MLA. People with flat feet show de- creased activation of the ABH, and the ABH can be activated by the SFE (Fiolkowski et al, 2003; Lee et al, 2016). In this experiment, the muscle activities of the TA and ABH were highest in the DF position.
The PER showed no significant difference among the three positions. Previous research suggests that lengthened triceps surae can affect the activation of the ABH (Heo and An, 2014). In our study, we in- structed the subjects to pull the forefoot toward the heel without flexing the toes while holding the heel in a starting position. Therefore, the subjects put relatively more effort into performing the SFE in the DF than in the N and PF ankle positions.
The muscle activity ratio of TA to ABH was high- est in DF and lowest in PF (p<.01). In contrast, the ratio of PER to ABH was lowest in DF and highest in PF. Murley et al (2009) reported that people with lowered MLAs tended to have an increased TA acti- vation pattern and a decreased PER activation pattern compared to people with normal MLAs. It is well known that the TA is the arch support muscle and is most highly activated in DF. However, an over-acti- vated TA compensates for a relatively weak ABH in flat foot patients. The findings of this study support the conclusion that performing SFE in PF allows flat foot patients to achieve a normalized muscle activation pattern by enhancing the activation of the ABH and preventing hyperactivation of the TA. However, de- termining the optimal ankle position between DF and PF is beyond the scope of this discussion.
In this study, the MLA angle decreased during all SFE conditions and decreased most significantly in PF (p<.01). Previous research has reported an in- verse relation between the activation of the ABH and the MLA angle (Jung et al, 2011), so we ex- pected that this angle would be decreased in DF.
However, the MLA angle was instead decreased in PF because, in the DF condition, all passive and ac- tive structures were already lengthened to the limit,
and there was no room for the height of the MLA to increase.
This study had several limitations. First, it could not include the tibialis posterior and flexor hallucis longus because they are located in deep compart- ments of the leg and cannot be measured using sur- face EMG. Second, because we captured the MLA angle using a two-dimensional camera, it was meas- ured only on the sagittal plane. In the actual arthro- kinematics of the foot, plantar flexion and dorsiflexion cause the transition of the navicular bone, which is the keystone for calculating the MLA angle. We also could not discount the influence of calcaneal pronation on the MLA angle. Third, because the electrode for the peroneus longus was enclosed by other lateral compartment leg muscles, cross talk could have af- fected the quality of the EMG data. Further longi- tudinal intervention research is required to examine all extrinsic and intrinsic arch support muscles and MLA angles in various ankle positions in order to determine the optimal treatment for flat foot.
Conclusion
The collected surface EMG data and calculated MLA angle data during the SFE showed similar ten- dencies between the flat foot and normal foot groups.
In both groups, the TA and ABH were activated at the highest levels in DF and were also highly acti- vated in PF and N. In PF, the subjects activated the ABH and PER the most highly and achieved rela- tively low activation of the TA. This suggests that researchers and clinical professionals should prescribe the PF position for alleviating flat foot
References
Abràmoff MD, Magalhães PJ, Ram SJ. Image proc- essing with imagej. Biophotonics international.
2004;11(7):36-42.
Banwell HA, Mackintosh S, Thewlis D. Foot ortho- ses for adults with flexible pes planus: A sys- tematic review. Journal of foot and ankle research. 2014;7(1):23.
Bertani A, Cappello A, Benedetti M, et al. Flat foot functional evaluation using pattern recognition of ground reaction data. Clinical Biomechanics.
1999;14(7):484-493.
Chen YC, Lou SZ, Huang CY, et al. Effects of foot orthoses on gait patterns of flat feet patients.
Clinical biomechanics. 2010;25(3):265-270.
Easley ME, Trnka HJ. Current concepts review:
Hallux valgus part 1: Pathomechanics, clinical assessment, and nonoperative management. Foot
& ankle international. 2007;28(5):654-659.
Fiolkowski P, Brunt D, Bishop M, et al. Intrinsic pedal musculature support of the medial longi- tudinal arch: An electromyography study. The Journal of foot and ankle surgery. 2003;42(6):
327-333.
Franco AH. Pes cavus and pes planus: Analyses and treatment. Physical Therapy. 1987;67(5):688-694.
Incel NA, Genc H, Erdem H, et al. Muscle imbalance in hallux valgus: An electromyographic study.
American journal of physical medicine &
rehabilitation. 2003;82(5):345-349.
Jung DY, Kim MH, Koh EK, et al. A comparison in the muscle activity of the abductor hallucis and the medial longitudinal arch angle during toe curl and short foot exercises. Physical Therapy in Sport. 2011;12(1):30-35.
Kamiya T, Uchiyama E, Watanabe K, et al. Dynamic effect of the tibialis posterior muscle on the arch of the foot during cyclic axial loading.
Clinical Biomechanics. 2012;27(9):962-966.
Kendall FP, McCreary EK, Kendall HO. Muscles, testing and function: Testing and function.
Lippincott Williams and Wilkins, 1983.
Kuo YL, Tully EA, Galea MP. Video analysis of sagittal spinal posture in healthy young and older adults. Journal of manipulative and phys- iological therapeutics. 2009;32(3):210-215.
Lee JH, Cynn HS, Yoon TL, et al. Differences in the angle of the medial longitudinal arch and muscle activity of the abductor hallucis and tibialis an- terior during sitting short-foot exercises be- tween subjects with pes planus and subjects with neutral foot. Journal of back and muscu- loskeletal rehabilitation. 2016;29(4):809-815.
Murley GS, Landorf KB, Menz HB, et al. Effect of foot posture, foot orthoses and footwear on low- er limb muscle activity during walking and run- ning: A systematic review. Gait & posture.
2009a;29(2):172-187.
Murley GS, Menz HB, Landorf KB. Foot posture in- fluences the electromyographic activity of se- lected lower limb muscles during gait. Journal of foot and ankle research. 2009b;2(1):35.
Neumann DA. Kinesiology of the musculoskeletal system: Foundations for rehabilitation. Elsevier Health Sciences, 2013:590-594.
O’connor KM, Hamill J. The role of selected extrinsic foot muscles during running. Clinical Biomechanics.
2004;19(1):71-77.
Pohl MB, Hamill J, Davis IS. Biomechanical and anatomic factors associated with a history of plantar fasciitis in female runners. Clinical Journal of Sport Medicine. 2009;19(5):372-376.
Prentice WE, Kaminski TW. Rehabilitation techniques for sports medicine and athletic training.
McGraw-Hill New York, 2004:630-634.
Rose G. Disorder of the foot and ankle, pes planus.
Mh jahss, ed. WB Saunders, Philadelphia. 1991:
892-919.
Tsai LC, Yu B, Mercer VS, et al. Comparison of different structural foot types for measures of standing postural control. Journal of Orthopaedic
& Sports Physical Therapy. 2006;36(12):942-953.
This article was received October 12, 2017, was reviewed October 12, 2017, and was accepted November 11, 2017.