J. Korean Soc. of Marine Engineering (JKOSME) ISSN 2234-8352 (Online)
http://dx.doi.org/10.5916/jkosme.2015.39.10.1011 Original Paper
This is an Open Access article distributed under the terms of the Creative Commons Attribution Non-Commercial License (http://creativecommons.org/licenses/by-nc/3.0), which permits unrestricted non-commercial use, distribution, and reproduction in any medium, provided the original work is properly cited.
Copyright ⓒ The Korean Society of Marine Engineering
†Corresponding Author (ORCID: http://orcid.org/00000-0001-6093-2975): Division of Mechanical Engineering, Korea Maritime and Ocean University, 727, Taejong-ro, Yeongdo-gu, Busan 49112, Korea, Email: doh@kmou.ac.kr, Tel: 051-410-4364
1 Department of Refrigeration & Air-Conditioning, Graduate School of Korea Maritime and Ocean University, Email: scha@kmou.ac.kr, Tel: 051-410-4364 2 Department of Refrigeration & Air-Conditioning, Graduate School of Korea Maritime and Ocean University, Email: vpscal@paran.com, Tel: 051-410-4364
Non-contact monitoring of 3-dimensional vibrations of bodies using a neural network
Sung Chul Ha
1․ Gyeong Rae Cho
2․ Deog-Hee Doh
†(Received November 24, 2015; Revised December 16, 2015;Accepted December 20, 2015)
Abstract: Gas piping systems in power plants and factories are always influenced by the mechanical vibrations of rotational ma- chines such as pumps, blowers, and compressors. Unusual vibrations in a gas piping system influence possible leakages of liq- uids or gases, which can lead to large explosive accidents. Real-time measurements of unusual vibrations in piping systems in situ prohibit them from being possible leakages owing to the repeated fatigue of vibrations. In this paper, a non-contact 3-di- mensional measurement system that can detect the vibrations of a solid body and monitor its vibrational modes is introduced.
To detect the displacements of a body, a stereoscopic camera system is used, through which the major vibration types of solid bodies (such as X-axis-major, Y-axis-major, and Z-axis-major vibrations) can be monitored. In order to judge the vibration types, an artificial neural network is used. The measurement system consists of a host computer, stereoscopic camera system (two-camera system, high-speed high-resolution camera), and a measurement target. Through practical application on a flat plate, the measured data from the non-contact measurement system showed good agreement with those from the original vibration mode produced by an accelerator.
Keywords: Piping system, Non-contact, 3-dimensional measurement, Solid vibrations, Artificial neural network, Accelerator
1. Introduction
Pneumatic and hydraulic piping lines control machinery such as the engines for ship propulsion and the engines for power plants. Abnormal vibrations from this machinery pro- duces leakages in their piping systems, and eventually produce large accidents in the engines when the control pipe lines mal- function [1][2].
As one of the non-contact approaches for vibration measure- ments of machines or pipes, Machida et al. used laser speckle images to obtain the vibrational information of a machine.
This method needs expensive laser sources to generate clear speckle patterns, and also requires complicated image analyses [3]. Yamagishi et al. measured flow-structure interactions of a flat plate vibrating in water [4].
This study is restricted to two-dimensional measurements of the vibrations of the plate. Jeon et al. [2][5] proposed a new measurement technique in which one high-speed camera was used and its time consecutive images were used to detect the displacement of measurement bodies. These results were also
restricted to two-dimensional vibrations. Since most cases of solid vibrations are three-dimensional, it is necessary to meas- ure the vibrations in three dimensions.
In this study, a non-contact three-dimensional measurement system for the detection of vibrations of solid bodies is newly proposed. Further, this study uses a monitoring system that can sort the solid vibrations into major vibration types by the use of an artificial neural network [6].
2. Monitoring Procedure
Figure 1 shows the schematics of the monitoring system for the machine vibrations. The main purpose of the measurement system is to detect the vibrations of piping system or machinery. Two high-speed high-resolution cameras are in- stalled toward to the measurement target.
Figure 2 shows the decision-making procedure to clarify the
vibration types of solid bodies. experimental setup. First, the
displacements of the target body given by the machine vi-
bration are calculated by the non-contact three-dimensional
Journal of the Korean Society of Marine Engineering, Vol. 39, No. 10, 2015. 12 1012 measurement system. Next, the displacement data are used for
teaching the artificial neural network. Last, real-time monitor- ing of the vibrational machine is conducted based on the data- base that was learned in the teaching process of the artificial neural network.
Figure 1: Schematics of the monitoring system of the machine vibrations
Figure 2: Monitoring procedure for sorting the vibration types
3. Non-Contact 3D Measurements
The non-contact three-dimensional measurement system for vibration consists of two cameras (high-speed high-resolution, 500 fps, 1024 × 1024 pixels), a host computer, and a halogen light. Figure 3 and 4 show the camera configuration for the measurement target.
Figure 3: Two-camera measurement system
Figure 4: Photo of experimental setup
Figure 5 shows the procedure to obtain 3D displacements of the vibrational body. In order to perform 3D measurements with two cameras, a camera calibration process in which all camera parameters are calculated should be carried out before measurements. Two cameras were used to obtain the stereo- scopic 3D measurements. The entire process, from camera cal- ibration to the calculations of three-dimensional displacements of the body, is based on previous papers by Doh et. al [7]-[9].
Following is the brief procedure for camera calibration and 3D calculations. For camera calibration, a 10-parameter method was used. Ten unknown parameters (6 exterior parameters: l,
, m
x, m
y, and 4 interior parameters: c
x, c
y, k
1, k
2) are calculated in the calibration process. For camera calibration, the landmark shown in Figure 7 was used.
Figure 5: Photo of experimental setup
O
m
xm
yc o
X Y
Z P
X
mY
mZ
m X
0,Y
0Z
0
x y
z
P'
Figure 6: Relations between camera coordinate and the land
coordinate (absolute coordinate)
Journal of the Korean Society of Marine Engineering, Vol. 39, No. 10, 2015. 12 1013 Figure 7: Landmarks Relations between camera coordinate
and the land coordinate (absolute coordinate)
(1)
2 4
2
)
1/
( x r k r k r
x
,
2 4
2
)
1/
( x r k r k r
y
r x 2 y 2
The calibration method is based on the pin-hole model.
Equation (1) was used to construct the relation between the camera coordinates and the land coordinates (called absolute coordinates or physical coordinates). Here, cx and cy are the focal distances for the x and y components of the coordinates.
Δ x and Δy are the lens distortions. l refers to the distance between the origin O (0, 0, 0) and the principal point (X0, Y0, Z0) of the camera. (x, y) represents the camera (photographical) coordinates of the image centroid of the cali- bration targets. Xm, Ym, and Zm represent three-dimensional coordinates of the target (object) in the physical coordinates (land coordinates). mx and my are misalignments between the coordinate centers of the two coordinates. After camera param- eters were calculated, the three-dimensional coordinates (X, Y, Z) of the vector were calculated using Equation (2). The rota- tional transformation matrix, MM, consists of the 10 camera parameters. That is, Equation (2), which represents the 3D po- sition of the target, can be replaced with Equation (3).
(2)
(3)
are the elements of the rotation matrix obtained via the camera calibrations. The final three-di- mensional position of the target was calculated using Equation (4) below:
(4)
(a) original (b) camera 1 (c) camera 2 Figure 8: Image of the target artificially attached onto the object wall in Figure 3
where ( X 1 , Y 1 , Z 1 ) and ( X 2 , Y 2 , Z 2 ) denote the absolute co- ordinates for camera 1 and camera 2, respectively, given by Equation (3).
Time-consecutive images of the two cameras were captured, and these images were used to calculate the 3D displacements of the same target. The principle of finding the same target in the time domain is based on the bidirectional method proposed by Doh et al. [9].
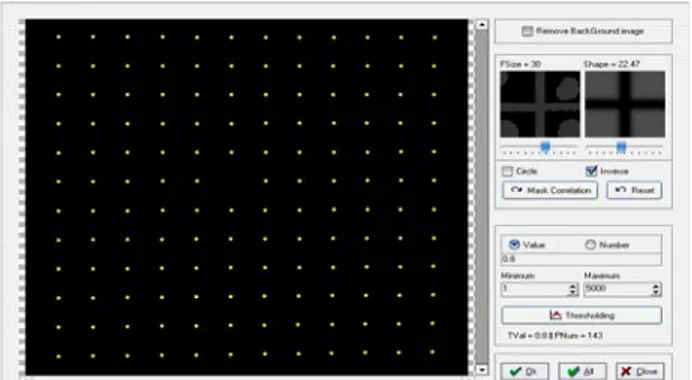
To check the performance of the constructed 3D measure- ment algorithm, a target as shown in Figure 8 (a) was at- tached to the wall of the object in Figure 3, 8 (b) and 8 (c) show the camera images reconstructed by the two cameras’
parameters. All camera parameters were obtained from the aforementioned calibration process. Using these parameters, ar- tificial 3D data of the target vibrations were converted into 2D camera coordinates, and once again, the 3D displacements of the target vibration were recovered.
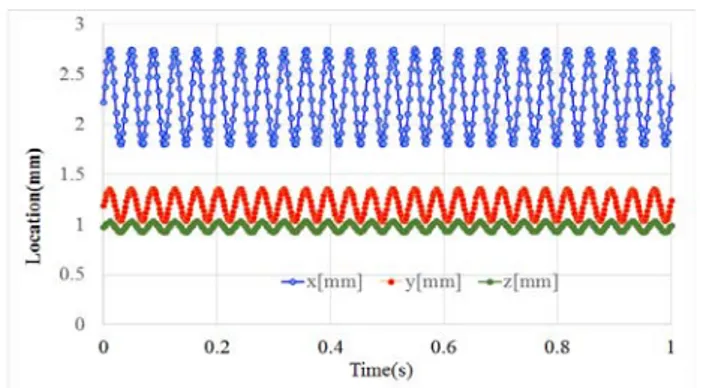
To generate the 2D artificial images shown in Figure 8 (b) and 8 (c) were used. To generate the artificial images, the method used by Hwang [10] and Okamoto et al. [11] was adapted. Figure 9 shows the calculated 3D displacement data of the target vibration with time changes. The amplitude im- plies a nondimensional value in the pixels. In this study, these values were enlarged by 100 times. Therefore, the maximum actual amplitude is 1 mm. Figure 10 shows enlarged data in a range of time from 15 msec to 25 sec. As seen in this figure, X-direction vibration is clearly shown.
Figure 11 shows the calculated 3D displacement data for the
vibrations. A time-consecutive vibration was determined in the
order of Y-axis vibration, X-axis vibration, Z-axis vibration,
Journal of the Korean Society of Marine Engineering, Vol. 39, No. 10, 2015. 12 1014 and Y-axis vibration. These vibration data (i.e., displacements
of the target) were trained by the artificial neural network ex- plained in the next section.
Figure 9: Order of vibrations with 10% noise of the max- imum amplitude for time change [msec] (X-axis vibration→
Y-axis vibration→Z-axis vibration) (unit: mm × 10-2, max amplitude=100)
Figure 10: Order of vibrations with 10% noise of the max- imum amplitude for time change [msec] (X vibration→Y vi- bration →Z vibration) (unit: mm × 10-2, max ampli- tude=100)
Figure 11: Order of vibrations with 10% noise of the max- imum amplitudes for time change [msec] (Y-axis vibration (max:150) → X-axis vibration (max:75) →Z-axis vibration (max:125) → Y-axis vibration(max:100)) (unit: mm × 10-2)
4. Artificial Neural Network for Decision Making on Vibration Types
Figure 12 shows how the artificial neural network learns the 3D vibration data (displacement data), and how the deci- sion-making is preformed. Once the neural network learned the
normal vibrational data, the decision-making was straightforward. Known information on the vibrations was taught as 1, 2, and 3. That is, pure X-axis vibration was taught as X = 1, pure Y-axis vibration as Y = 2, and pure Z-axis vibration as Z = 3. Figure 13 shows the neural network used in this study. The network consists of three layers: input, hidden, and output. The number of input layers is 3.
Figure 12: Decision making procedure for normal and abnor- mal vibrations
Figure 13: Structure of used neural network
For each input, X-axis, Y-axis, and Z-axis vibration data were taught, as shown in Figure 13. The number of hidden layers is 10. The calculation algorithm of the neural network is based on the back-propagation used by the studies [2][5][12]. The calculation was repeated until the error value (E) between tk (teaching value) and zk (reference value) be- came smaller than a threshold value. Briefly mentioning on the calculation process for the neural network, the signal of each neuron can be represented as Equation (5) for the basic neuron model in Figure 14.
(5)
Figure 14: Conventional neuron model
Journal of the Korean Society of Marine Engineering, Vol. 39, No. 10, 2015. 12 1015
) f(x
1
5 . 0
0 x
1
a1 a