ISSN 2234-3806 • eISSN 2234-3814
48 www.annlabmed.org https://doi.org/10.3343/alm.2020.40.1.48 https://doi.org/10.3343/alm.2020.40.1.48
Human B1 Cells are the Main Blood Group A-Specific B Cells That Have a Moderate Correlation With Anti-A Antibody Titer
Yixuan Xu , M.D.1,2, Jae-Ghi Lee , Ph.D.2, Ji-Jing Yan , M.D., Ph.D.2, Jung-Hwa Ryu , M.D., Ph.D.3, Songji Xu , M.D., Ph.D.1, and Jaeseok Yang , M.D., Ph.D.3,4
1Department of Preventive Medicine, Yanbian University College of Medicine, Yanji, Jilin, People’s Republic of China; 2Biomedical Research Institute,
3Transplantation Center, and 4Department of Surgery, Seoul National University Hospital, Seoul, Korea
Background: Anti-carbohydrate antibody responses, including those of anti-blood group ABO antibodies, are yet to be thoroughly studied in humans. Because anti-ABO antibody- mediated rejection is a key hurdle in ABO-incompatible transplantation, it is important to understand the cellular mechanism of anti-ABO responses. We aimed to identify the main human B cell subsets that produce anti-ABO antibodies by analyzing the correlation be- tween B cell subsets and anti-ABO antibody titers.
Methods: Blood group A-binding B cells were analyzed in peritoneal fluid and peripheral blood samples from 43 patients undergoing peritoneal dialysis and 18 healthy volunteers with blood group B or O. The correlation between each blood group A-specific B cell sub- set and anti-A antibody titer was then analyzed using Pearson’s correlation analysis.
Results: Blood group A-binding B cells were enriched in CD27+CD43+CD1c− B1, CD5+ B1, CD11b+ B1, and CD27+CD43+CD1c+ marginal zone-B1 cells in peripheral blood. Blood group A-specific B1 cells (P =0.029 and R=0.356 for IgM; P =0.049 and R=0.325 for IgG) and marginal zone-B1 cells (P =0.011 and R=0.410 for IgM) were positively corre- lated with anti-A antibody titer. Further analysis of peritoneal B cells confirmed B1 cell en- richment in the peritoneal cavity but showed no difference in blood group A-specific B1 cell enrichment between the peritoneal cavity and peripheral blood.
Conclusions: Human B1 cells are the key blood group A-specific B cells that have a mod- erate correlation with anti-A antibody titer and therefore constitute a potential therapeutic target for successful ABO-incompatible transplantation.
Key Words: Anti-ABO antibodies, Blood group A antigen, Human B1 cells, Human mar- ginal zone B cells, Peritoneal B cells
Received: March 27, 2019 Revision received: June 6, 2019 Accepted: July 31, 2019 Corresponding author:
Jaeseok Yang, M.D., Ph.D.
Transplantation Center, Seoul National University Hospital, 101 Daehak-ro, Jongno-gu, Seoul 03080, Korea Tel: +82-2-2072-4128 Fax: +82-2-2072-4129 E-mail: [email protected] Co-corresponding author:
Songji Xu, M.D., Ph.D.
Department of Preventive Medicine, Yanbian University College of Medicine, Yanji 133002, Jilin, People’s Republic of China
Tel: +86-433-2435271 Fax: +86-433-2435271 E-mail: [email protected]
© Korean Society for Laboratory Medicine This is an Open Access article distributed under the terms of the Creative Commons Attribution Non-Commercial License (http://creativecom- mons.org/licenses/by-nc/4.0) which permits unrestricted non-commercial use, distribution, and reproduction in any medium, provided the original work is properly cited.
INTRODUCTION
Organ transplantation is the treatment of choice for patients with end-stage organ failure. However, there is a huge imbalance between the supply and demand of organs. ABO-incompatible transplantation is an emerging solution to this problem and is
expected to increase organ supply by as much as 25% [1-3].
Antibody-mediated rejection, caused by anti-ABO antibodies, has been the most challenging hurdle for ABO-incompatible transplantation. ABO blood group antigens are carbohydrate antigens, and anti-ABO antibody responses are known to show different patterns from anti-HLA antibody responses, which are
2017-03-16 https://crossmark-cdn.crossref.org/widget/v2.0/logos/CROSSMARK_Color_square.svg
https://doi.org/10.3343/alm.2020.40.1.48 www.annlabmed.org 49 a part of the conventional anti-peptide antibody response [4].
Anti-ABO antibody responses are “T-independent” antibody re- sponses that do not require the involvement of T cells. However, it remains unclear which B cell subsets are the main cells that produce anti-ABO antibodies and whether those B cells require help from innate-type T cells [5].
Previous studies have shown that B1 cells produce anti-ABO antibodies [6, 7]. Murine B1 cells have innate phenotypes, ex- press CD11b and surface IgM, and mainly reside in the perito- neal cavity [8]. These murine B1 cells are sub-divided into CD5+ B1a cells and CD5− B1b cells [8]. In contrast to the well-defined phenotypes of mouse B1 cells, the phenotype of human B1 cells is unclear. A recent study proposed that CD20+ B cells that si- multaneously express CD43 and CD27 are B1 cells [9]. These cells continuously secrete IgM, maintain tonic signaling, and can help T cell activation and are therefore functionally similar to murine B1 cells [9]. Similar to murine B1 cells, human B1 cells are subdivided based on the expression of CD5 and CD11b [10, 11]. Marginal zone B (MZB) cells are another type of innate B cells that are involved in the production of anti-alpha-Gal, a type of anti-carbohydrate antibody [12]. Human MZB cells are also present in the spleen and peripheral blood and express both CD27 and CD1c [13, 14]. Therefore, MZB cells may constitute another candidate for the production of anti-human ABO anti- bodies together with B1 cells.
We identified B1 and MZB cell populations in human periph- eral blood according to previous classification methods [9, 14].
This is the first study to investigate the correlation between hu- man blood group A-specific B cells expressing and producing anti-A antibodies and anti-A antibody levels in the peripheral blood, and to identify the main human B cell subset that produces anti-A antibodies.
METHODS
Sample preparationThe study was prospectively performed between 2014 and 2018 at Seoul National University Hospital, Seoul, Korea, in accordance with the Declaration of Helsinki, and its protocol was approved by Seoul National University Hospital’s Institutional Review Board (H-1411-020-623) Ten milliliters of peripheral blood were ex- tracted from 43 healthy volunteers, 13 kidney transplant patients, and 18 peritoneal dialysis patients with blood group B or O after they provided informed consent. Peripheral blood of ABO-in- compatible kidney transplant patients was extracted before (N=8) and one yr after (N=10) transplantation. One liter of peritoneal
fluid was also collected from peritoneal dialysis patients. Perito- neal cells were obtained by centrifugation of whole fluid ob- tained from the peritoneal dialysis patients when their peritoneal cavity was washed, two weeks after catheter insertion. Periph- eral blood mononuclear cells (PBMCs) were isolated by gradient centrifugation using Ficoll (GE Healthcare, Cleveland, OH, USA).
PBMCs and peritoneal cells were subjected to red blood cell-ly- sis using BD Pharm Lyse (BD Biosciences, San Diego, CA, USA).
Flow cytometric analysis
PBMC and peritoneal cells were stained with the following anti- human antibodies: blood type (tri)- PAA-fluor (GlycoTech, Gaith- ersburg, MD, USA), anti-CD20 (L27), anti-CD27 (M-T271), anti- CD43 (MEM-59), anti-CD5 (L17F12), anti-CD11b (ICRF44), anti- CD1c (L161) (BioLegend, San Diego, CA, USA). Flow cytometric analyses were performed using a BD FACS Canto II flow cytom- eter (BD Biosciences), and data was analyzed using FlowJo (Tree Star, Ashland, OR, USA). Briefly, at least 1 ×10⁶ PBMCs and peritoneal cells were subjected to FACS acquisition. Next, ap- proximately 1–5×10⁵ singlet lymphocytes were acquired based on the forward scatter (FSC)-A, FSC-H, and side scatter (SSC)- A. The lymphoid compartment contained approximately 15–30%
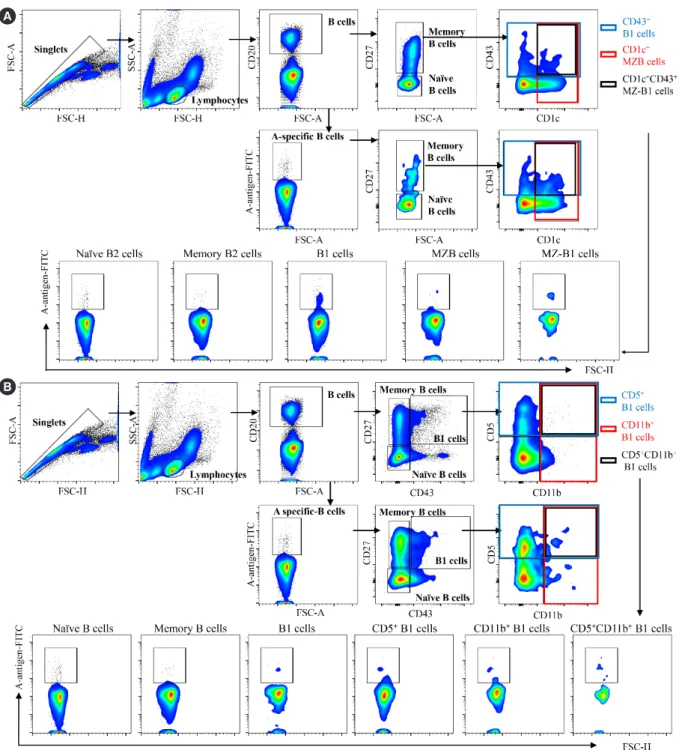
CD20+ B cells. Based on a previous classification strategy [9], the CD20+ B cells were divided into naïve B2 (CD43−CD27−), mem- ory B2 (CD27+CD43−CD1c−), B1 (CD20+CD27+CD43+CD1c−), MZB (CD27+CD43−CD1c+), and marginal zone-B1 (MZ-B1, CD27+CD43+CD1c+) cells according to CD27, CD43, and CD1c expressions (Fig. 1A, upper panel). CD27+CD43+ B1 cells were subdivided into CD11b+CD5− B1 cells, CD11b−CD5+ B1 cells, and CD11b+CD5+ B1 cells based on CD5 and CD11b expres- sions (Fig. 1B, upper panel) [10, 11]. Next, blood group A-spe- cific B cells capable of binding to the blood group A antigen- Fluorescein isothiocyanate (FITC) complex were gated from total B cells (Fig. 1A, lower panel; Fig. 1B, lower panel). Similarly, blood group A-specific B cells were divided into B cell subsets according to CD27, CD43, CD1c, CD5, and CD11b expressions.
According to these classification strategies, the proportions of each B cell subset among total and blood group A-specific B cells , and the proportion of blood group A-specific B cells among each B cell subset were analyzed (Fig. 2).
Measurement of anti-blood group A antibody titers
A gel card method (ID-System DiaMed; Bio-Rad, Hercules, CA, USA) was used to measure human blood group A-specific IgM and IgG [15]. Briefly, 50 μL of 0.8% red blood cells (RBCs) and 25 μL of serially diluted serum samples were added to the gel
50 www.annlabmed.org https://doi.org/10.3343/alm.2020.40.1.48 card and incubated at room temperature (20–25˚C, IgM) or 37˚C
(IgG) for 15 minutes. After centrifugation for 10 minutes, the pres- ence of trapped agglutinates on the top of or dispersed through- out the gel matrix was considered a positive result. A single sed-
iment found at the bottom of the gel matrix was considered a negative result. The highest dilution point that showed a positive result was considered the final titer.
Fig. 1. Gating strategy for naïve, memory, marginal zone, B1 and marginal zone-B1 B cells and B1 subpopulations. (A) For analysis of B cells in peripheral blood, singlet blood lymphocytes were gated for total CD20+ B cells or ‘A’ antigen-capturing, blood group A-specific CD20+ B cells. Next, the CD20+ B cells were divided into various subsets. (B) For analysis of B1 cell subpopulations in peripheral blood, CD27+CD43+ B1 cells were subdivided into various subpopulations based on CD5 and CD11b expressions.
Abbreviations: MZB, marginal zone B cells; MZ-B1, marginal zone-B1 cells.
319
Fig. 1. Gating strategy for naïve, memory, marginal zone, B1 and marginal zone-B1 B cells 320
and B1 subpopulations. (A) For analysis of B cells in peripheral blood, singlet blood 321
lymphocytes were gated for total CD20
+B cells or ‘A’ antigen-capturing, blood group A- 322
specific CD20
+B cells. Next, the CD20
+B cells were divided into various subsets. (B) For 323
analysis of B1 cell subpopulations in peripheral blood, CD27
+CD43
+B1 cells were subdivided 324
into various subpopulations based on CD5 and CD11b expressions.
325
Abbreviations: MZB, marginal zone B cells; MZ-B1, marginal zone-B1 cells 326
A
B
https://doi.org/10.3343/alm.2020.40.1.48 www.annlabmed.org 51 Statistical analysis
Data were presented as mean±standard error of the mean (SEM) or median with range. Both age and proportions of B cell sub-
sets followed a normal distribution, but titers of anti-blood group A antibodies did not. Continuous variables were analyzed using Student’s t-tests, and correlations were analyzed using Pearson’s Fig. 2. The frequency of each blood group A-specific B cell subset. (A) The proportion of each B cell subset among the total CD20+ B cells (left panel) and A-specific CD20+ B cells (right panel). (B) The proportion of blood group A-specific B cells among each B cell subset. *P <0.05,
**P <0.01 compared with the naïve B2 cell group. ‡P <0.01 compared with the memory B2 cell group. (C) The proportions of each B1 cell subset among the total CD20+ B cells (left panel) and A-specific CD20+ B cells (right panel). (D) The proportions of blood group A-specific B cells among each B1 cell subset. *P <0.05, **P <0.01 compared with the naïve and memory B2 cell group. †P <0.05, ‡P <0.01 com- pared with the B1 cell group. The results are expressed as mean±SEM; N=30–45 per group.
Abbreviations: FITC, fluorescein isothiocyanate; FSC, forward scatter; MZB, marginal zone B cells; MZ-B1, marginal zone-B1 cells; SEM, standard error of the mean.
8
6
4
2
Proportion of each subset among +CD20 cells (%) 0
A 6
4
2
0 Proportion of each subset among A-specific CD20+ cells (%)
8
6
4
2
Proportion of each subset among +CD20 cells (%) 0 C
8
6
4
2
0 A-specific B cells/total B cells in each B cell subset (%) B
‡
**
*
‡
**
2.5 2.0 1.5 1.0 0.5 0 A-specific B cells/total B cells in each B cell subset (%) D
‡
**
‡
**
**
*
6
4
2
0 Proportion of each subset among A-specific CD20+ cells (%)
Naïve B2 cells (CD20+CD27–)
Memory B2 cells (CD20+CD27+CD43–CD1c–) B1 cells (CD20+CD27+CD43+CD1c–) MZB cells (CD20+CD27+CD43–CD1c+) MZ-B1 cells (CD20+CD27+CD43+CD1c+)
Naïve B cells (CD20+CD27–CD43–) Memory B cells (CD20+CD27+CD43–) B1 cells (CD20+CD27+CD43+) CD5+ B1 cells (CD20+CD27+CD43+CD5+) CD11b+ B1 cells (CD20+CD27+CD43+CD11b+) CD5+CD11b+ B1 cells (CD20+CD27+CD43+CD5+CD11b+)
52 www.annlabmed.org https://doi.org/10.3343/alm.2020.40.1.48 correlation analysis. Degree of correlation was regarded as weak
if the correlation coefficient (R) was <0.4, moderate if R was between 0.4 and 0.6, and strong for R≥0.6 [16]. P <0.05 was considered statistically significant. All analyses were performed using SPSS (version 20.0, IBM Corporation, Armonk, NY, USA).
RESULTS
Demographic characteristics of study subjects and anti-A anti- body titers are summarized in Table 1. Blood group A-specific B cells were enriched in B1 and MZ-B1 cells in peripheral blood.
We first assessed the frequency of B1 cells and MZB cells in the peripheral blood of the healthy volunteers. CD43+ B1 and CD1c+ MZB cells accounted for 3.27 ±0.29% and 12.97 ±1.03% of the entire CD27+ B cell population, respectively (Figs. 1A and 2A). Interestingly, MZ-B1 cells expressing both CD43 and CD1c (1.68±0.26%) were also identified (Fig. 2A, left panel). When each B cell subset was measured among the blood group A- specific B cells, the overall trend was similar to the proportion of each B cell subset among the total B cells (Fig. 2A, right panel).
Analysis of the proportion of blood group A-specific B cells among each B cell subset suggested that the blood group A-specific B cells in the B1 (5.13±1.06%) and MZ-B1 (5.27±1.28%) cells were significantly higher than those in naïve (0.96±0.11%) and memory (1.45 ±0.18%) B2 cells (Fig. 2B). The proportion of blood group A-specific B cells was also slightly higher in the MZB cells than in naïve or memory B2 cells (Fig. 2B).
Next, the CD43-expressing B1 cells were subdivided based on CD5 and CD11b expression (Fig. 2C). When the proportion of blood group A-specific B cells among each B1 cell subset was analyzed, the blood group A-specific B cells were enriched
in the total CD27+CD43+ B1 cells and B1 subpopulations, such as CD5+, CD11b+ and CD5+CD11b+ B1 cells, compared with naïve and memory B2 cells (Fig. 2D).
B1 cells were the main blood group A-specific B cells in ABO- incompatible kidney transplant patients, in agreement with data obtained from healthy volunteers (Supplemental Data Fig. S1).
Taken together, these data confirmed that B1, MZB, and MZ- B1 cells are present in peripheral blood and demonstrated that blood group A-specific B cells were enriched in B1 cells, including CD5+, CD11b+, and CD5+CD11b+ B1 cells, as well as MZ-B1 cells.
Correlation between the proportion of blood group A-specific B cell subset and anti-A antibody titer
The anti-A IgM and IgG titers of healthy volunteers were 1:16 (1:2–1:128) and 1:64 (1:2–1:1,512), respectively (Table 1). The anti-A IgM and IgG titers in blood group O donors were signifi- cantly higher than those in blood group B donors (IgM, P =0.012;
IgG, P <0.01, Table 1). There was no significant difference in the anti-A IgM or IgG titers between healthy volunteers and peri- toneal dialysis patients.
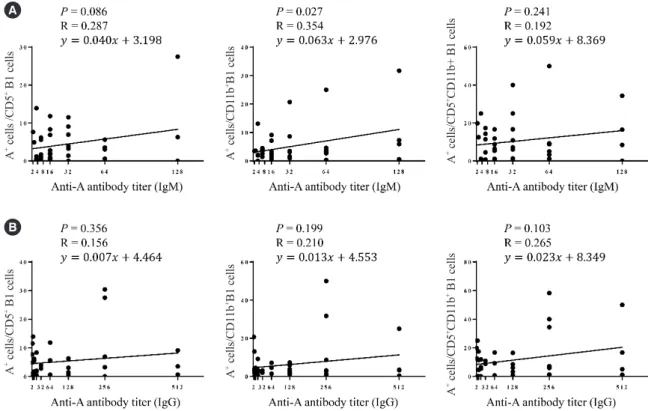
When we examined the correlation between anti-A antibody titer and the proportion of blood group A-specific B cells within each B cell subset, a weak positive correlation was observed between the anti-A IgM and IgG titers and B1 cells (P =0.029 and R=0.356 for IgM, Fig. 3A; P =0.049 and R=0.325 for IgG, Fig. 3B). The MZ-B1 cells showed a moderately positive corre- lation only with the anti-A IgM titer (P =0.011 and R =0.410, Fig. 3A), and the MZB cells showed a positive correlation trend with the anti-A antibody titer (Fig. 3A and 3B).
When the B1 cell subpopulations were analyzed, CD11b+ B1 cells were weakly correlated with the anti-A IgM titer (P =0.027, Table 1. Characteristics of study participants
Peritoneal dialysis patients (N=18) Healthy volunteers (N=43) Kidney transplant patients (N=13)
Age (yr, mean±SEM) 48.56±2.66 41.72±1.70 51.20±3.07
Sex (male, N) 6 20 8
Blood group O (N) 8 31 8
Blood group B (N) 10 12 5
Anti-A IgM titer (median, range) 1:8 (1:4–1:256) 1:16 (1:2–1:128) 1:8 (1:1–1:64)
Anti-A IgM titer in blood group O (median, range) 1:32 (1:4–1:256) 1:32 (1:4–1:128) 1:16 (1:1–1:64) Anti-A IgM titer in blood group B (median, range) 1:8 (1:4–1:32) 1:8* (1:2–1:64) 1:4 (1:1–1: 16)
Anti-A IgG titer (median, range) 1:16 (1:4–1:256) 1:64 (1:2–1:512) 1:32 (1:1–1:128)
Anti-A IgG titer in blood group O (median, range) 1:64 (1:8–1:512) 1:128 (1:8–1:512) 1:8 (1:1–1:64) Anti-A IgG titer in blood group B (median, range) 1:8* (1:4–1:32) 1:8† (1:2–1:128) 1:16 (1:1–1:128)
*P <0.05 in comparison between blood group O and blood group B; †P <0.01 in comparison between blood group O and blood group B.
Abbreviation: SEM, standard error of the mean.
https://doi.org/10.3343/alm.2020.40.1.48 www.annlabmed.org 53
Fig. 3. The correlation between the frequency of each B cell subset and anti-blood group A IgM (A) and IgG (B) titer in the peripheral blood.
The anti-A IgM titer was positively correlated with the frequency of CD20+CD27+CD43+CD1c− B1 cells and CD20+CD27+CD43+CD1c+ MZ- B1 cells (B1 cells, P =0.029, R=0.356; MZ-B1 cells, P =0.011, R=0.410). The anti-A IgG titer was positively correlated with the frequency of CD20+CD27+CD43+CD1c− B1 cells (P =0.049; R=0.325).
Abbreviations: MZB, marginal zone B cells; MZ-B1, marginal zone-B1 cells; R, Pearson correlation coefficient.
20 342
Fig. 3. The correlation between the frequency of each B cell subset and anti-blood group A 343
IgM (A) and IgG (B) titer in the peripheral blood. The anti-A IgM titer was positively correlated 344
with the frequency of CD20
+CD27
+CD43
+CD1c
−B1 cells and CD20
+CD27
+CD43
+CD1c
−345
MZ-B1 cells (B1 cells, P = 0.029, R = 0.356; MZ-B1 cells, P = 0.011, R = 0.410). The anti-A 346
IgG titer was positively correlated with the frequency of CD20
+CD27
+CD43
+CD1c
−B1 cells 347
(P = 0.049; R = 0.325).
348 20 342
Fig. 3. The correlation between the frequency of each B cell subset and anti-blood group A 343
IgM (A) and IgG (B) titer in the peripheral blood. The anti-A IgM titer was positively correlated 344
with the frequency of CD20
+CD27
+CD43
+CD1c
−B1 cells and CD20
+CD27
+CD43
+CD1c
−345
MZ-B1 cells (B1 cells, P = 0.029, R = 0.356; MZ-B1 cells, P = 0.011, R = 0.410). The anti-A 346
IgG titer was positively correlated with the frequency of CD20
+CD27
+CD43
+CD1c
−B1 cells 347
(P = 0.049; R = 0.325).
348
20 342
Fig. 3. The correlation between the frequency of each B cell subset and anti-blood group A 343
IgM (A) and IgG (B) titer in the peripheral blood. The anti-A IgM titer was positively correlated 344
with the frequency of CD20
+CD27
+CD43
+CD1c
−B1 cells and CD20
+CD27
+CD43
+CD1c
−345
MZ-B1 cells (B1 cells, P = 0.029, R = 0.356; MZ-B1 cells, P = 0.011, R = 0.410). The anti-A 346
IgG titer was positively correlated with the frequency of CD20
+CD27
+CD43
+CD1c
−B1 cells 347
(P = 0.049; R = 0.325).
348
A
B
54 www.annlabmed.org https://doi.org/10.3343/alm.2020.40.1.48 R=0.354, Fig. 4A), while the CD5+ B1 cells showed only a trend
of positive correlation with anti-A IgM titer (P =0.086, R=0.287, Fig. 4A). There was no statistically significant correlation between individual B1 subpopulations and the anti-A IgG titer (Fig. 4B).
Overall, blood group A-specific B1 cells were positively corre- lated with anti-A antibody titers.
Human B1 cell enrichment in the peritoneal cavity
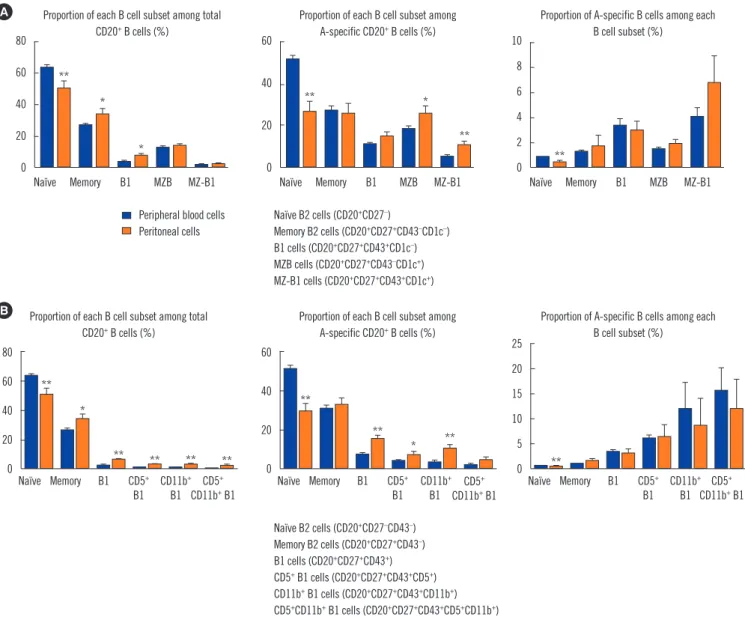
When we compared B cell subsets between peripheral blood and peritoneal cells, the proportions of total B1, CD5+ B1, CD11b+ B1, and CD5+CD11b+ B1 cells were higher in the peritoneal cav- ity than in peripheral blood, similar to the proportions in mice (Fig. 5A and 5B, left and middle panels). However, blood group A-specific B cell enrichment did not differ between peripheral blood cells and peritoneal cells (Fig. 5A and 5B, right panels).
DISCUSSION
The present study showed that blood group A-specific B cells were enriched in CD27+CD43+CD1c− B1, CD11b+ B1, and CD27+ CD43+CD1c+ MZ-B1 cells in peripheral blood, as well as in the peritoneal cavity and that A-specific B1, CD11b+ B1, and MZ-
B1 cells were positively correlated with anti-A antibody titer in peripheral blood. Taken together, these data suggest that B1 cells are the key blood group A-specific B cells involved in the production of anti-blood group A antibodies.
In the current era of ABO-incompatible transplantation, ritux- imab has been used to eradicate total B cells and reduce anti- ABO antibody titer, thereby suppressing anti-ABO antibody-me- diated rejection [17]. However, non-specific depletion of broad B cell subsets by rituximab increases opportunistic infection in ABO-incompatible transplant patients [17]. Based on our study, targeted therapy towards B1 cells, instead of total B cells, could be a promising strategy for reducing the anti-A antibody titer with fewer adverse effects.
In general, B1 cells continuously produce low affinity IgM with- out antigen stimulation [18]. Recent studies on B1 cells have shown that IgG can be produced without antigen stimulation, although IgG production levels are lower than in blasts [19].
Therefore, the positive correlation between the frequency of A- specific B1 cells and anti-A IgM and IgG titers in our study sug- gests that B1 cells may be involved in the production of anti-A IgM and IgG. CD11b+ B1 cells have been reported to have wea- ker IgM secretory function but higher expression of CD86 than Fig. 4. The correlation between the frequency of each B cell subset and anti-blood group A IgM (A) and IgG (B) titer in the peripheral blood. The frequency of each B1 subpopulation showed a positive correlation tendency with the anti-A IgM titer.
Abbreviation: R, Pearson correlation coefficient.
22 352
Fig. 4. The correlation between the frequency of each B cell subset and anti-blood group A 353
IgM (A) and IgG (B) titer in the peripheral blood. The frequency of each B1 subpopulation 354
showed a positive correlation tendency with the anti-A IgM titer.
355
Abbreviation: R, Pearson correlation coefficient.
356 357
A
B
A+ cells /CD5+ B1 cellsA+ cells/CD5+ B1 cells A+ cells/CD11b+B1 cells A+ cells/CD5+CD11b+ B1 cellsA+ cells/CD5+CD11b+ B1 cells
A+ cells/CD11b+B1 cells
https://doi.org/10.3343/alm.2020.40.1.48 www.annlabmed.org 55
Fig. 5. B cell subsets and blood group A-specific B cells analyzed using the (A) CD27, CD43, CD1c and (B) CD43, CD5, CD11b classifica- tion methods. The proportion of each B cell subset within the total CD20+ B cell population (left panel), A-specific CD20+ B cells (middle panel), and blood group A-specific B cells among each B cell subset (right panel) were compared between peripheral blood and peritoneal cavity. The results are expressed as mean±SEM; N=15–30 per group.
*P <0.05, **P <0.01 comparing between peripheral blood and peritoneal cavity.
Abbreviations: MZB, marginal zone B cells; MZ-B1, marginal zone-B1 cells; SEM, standard error of the mean.
A 80 60 40 20 0
Proportion of each B cell subset among total CD20+ B cells (%)
**
*
*
Naïve Memory B1 MZB MZ-B1
60
40
20
0
Proportion of each B cell subset among A-specific CD20+ B cells (%)
** *
**
Naïve Memory B1 MZB MZ-B1
10 8 6 4 2 0
Proportion of A-specific B cells among each B cell subset (%)
**
Naïve Memory B1 MZB MZ-B1 Naïve B2 cells (CD20+CD27–)
Memory B2 cells (CD20+CD27+CD43–CD1c–) B1 cells (CD20+CD27+CD43+CD1c–) MZB cells (CD20+CD27+CD43–CD1c+) MZ-B1 cells (CD20+CD27+CD43+CD1c+) Peripheral blood cells
Peritoneal cells
B
80 60 40 20 0
Proportion of each B cell subset among total CD20+ B cells (%)
**
*
** ** ** **
Naïve Memory B1 CD5+ B1 CD11b+
B1 CD5+ CD11b+ B1
60
40
20
0
Proportion of each B cell subset among A-specific CD20+ B cells (%)
**
**
* **
Naïve Memory B1 CD5+ B1 CD11b+
B1 CD5+ CD11b+ B1 Naïve B2 cells (CD20+CD27–CD43–)
Memory B2 cells (CD20+CD27+CD43–) B1 cells (CD20+CD27+CD43+) CD5+ B1 cells (CD20+CD27+CD43+CD5+) CD11b+ B1 cells (CD20+CD27+CD43+CD11b+) CD5+CD11b+ B1 cells (CD20+CD27+CD43+CD5+CD11b+)
25 20 15 10 5 0
Proportion of A-specific B cells among each B cell subset (%)
**
Naïve Memory B1 CD5+ B1 CD11b+
B1 CD5+ CD11b+ B1
CD11b− B1 cells, which contributes to the proliferation of T cells in systemic lupus erythematosus patients [10]. Considering the ability of B1 cells to promote T cell proliferation by interacting with T cells, it is likely that CD11b+ B1 cells will be activated with the help of T cells. Our previous study has shown that CD49dhigh CD4+ T cells can help B1 cells secrete IgM and IgG [20]. There- fore, with the help of T cells, CD11b+ B1 cells are likely to se- crete anti-A antibodies.
Our study had a few limitations. First, we assessed blood group A-specific B cells by counting B cells that could bind to the A
antigen. However, we were unable to confirm whether these cells could actually produce anti-A antibody specifically. As the proportion of B1 cells was very low in the peripheral blood, it was difficult to isolate them and perform functional analysis for antibody production against the A antigen. However, there was a strong correlation between the frequency of blood group A-spe- cific B cells and anti-A antibody titer, and these findings support the functional significance of blood group A-specific B cells in- directly. Second, the peritoneal cells were isolated from initial washing fluid from peritoneal dialysis patients instead of healthy
56 www.annlabmed.org https://doi.org/10.3343/alm.2020.40.1.48 individuals because of practical difficulties. No significant differ-
ences were observed between the B cell subsets in the periph- eral blood of peritoneal dialysis patients and healthy volunteers (data not shown); therefore, we hypothesize that the peritoneal B cell composition might not significantly differ between the two populations. Third, we did not evaluate the correlation between blood group B-specific B cells and anti-B antibody titers. Fur- ther studies are necessary to extend the current findings to blood group B-specific B cells. Finally, the R values were generally low in this small-scale study; therefore, this correlation should be confirmed in further studies using independent validation sets with a larger sample size.
Nonetheless, this study confirmed the importance of B1 cells in anti-blood group antibody response, using two different clas- sification systems, and demonstrated moderate correlations be- tween the frequency of B1 cells and anti-ABO antibody titer for the first time. Therefore, B1 cells could constitute a potential therapeutic target for desensitization in ABO-incompatible trans- plantation.
Author Contributions
All authors have accepted their responsibility for the entire con- tent of this manuscript and approved submission.
Conflicts of Interest
No potential conflicts of interest relevant to this article were re- ported.
Research Funding
This study was supported by the Bio and Medial Technology Development Program of the NRF funded by the Ministry of Sci- ence and ICT (NRF-2015M3A9D3051413).
ORCID
Yixuan Xu https://orcid.org/0000-0002-6039-2267 Jae-Ghi Lee https://orcid.org/0000-0002-0123-9801 Ji-Jing Yan https://orcid.org/0000-0002-4048-1406 Jung-Hwa Ryu https://orcid.org/0000-0003-1887-7823 Songji Xu https://orcid.org/0000-0003-0678-198X Jaeseok Yang https://orcid.org/0000-0002-5378-7797
REFERENCES
1. Morath C, Zeier M, Döhler B, Opelz G, Süsal C. ABO-incompatible kid- ney transplantation. Front Immunol 2017;8:234.
2. Okumi M, Toki D, Nozaki T, Shimizu T, Shirakawa H, Omoto K, et al.
ABO-incompatible living kidney transplants: evolution of outcomes and immunosuppressive management. Am J Transplant 2016;16:886-96.
3. Segev DL, Gentry SE, Melancon JK, Montgomery RA. Characterization of waiting times in a simulation of kidney paired donation. Am J Trans- plant 2005;5:2448-55.
4. Mond JJ, Lees A, Snapper CM. T cell-independent antigens type 2. Annu Rev Immunol 1995;13:655-92.
5. Tazawa H, Irei T, Tanaka Y, Igarashi Y, Tashiro H, Ohdan H. Blockade of invariant TCR-CD1d interaction specifically inhibits antibody production against blood group A carbohydrates. Blood 2013;122:2582-90.
6. Irei T, Ohdan H, Zhou W, Ishiyama K, Tanaka Y, Ide K, et al. The persis- tent elimination of B cells responding to blood group A carbohydrates by synthetic group A carbohydrates and B-1 cell differentiation block- ade: novel concept in preventing antibody-mediated rejection in ABO- incompatible transplantation. Blood 2007;110:4567-75.
7. Zhou W, Ohdan H, Tanaka Y, Hara H, Tokita D, Onoe T, et al. NOD/SCID mice engrafted with human peripheral blood lymphocytes can be a mod- el for investigating B cells responding to blood group A carbohydrate determinant. Transpl Immunol 2003;12:9-18.
8. Hardy RR. B-1 B cell development. J Immunol 2006;177:2749-54.
9. Griffin DO, Holodick NE, Rothstein TL. Human B1 cells in umbilical cord and adult peripheral blood express the novel phenotype CD20+ CD27+
CD43+ CD70-. J Exp Med 2011;208:67-80.
10. Griffin DO and Rothstein TL. A small CD11b(+) human B1 cell subpop- ulation stimulates T cells and is expanded in lupus. J Exp Med 2011;
208:2591-8.
11. Verbinnen B, Covens K, Moens L, Meyts I, Bossuyt X. Human CD20+
CD43+CD27+CD5- B cells generate antibodies to capsular polysaccharides of Streptococcus pneumoniae. J Allergy Clin Immunol 2012;130:272-5.
12. Xu H, Sharma A, Lei Y, Okabe J, Wan H, Chong AS, et al. Development and characterization of anti-Gal B cell receptor transgenic Gal-/- mice.
Transplantation 2002;73:1549-57.
13. Weill JC, Weller S, Reynaud CA. Human marginal zone B cells. Annu Rev Immunol 2009;27:267-85.
14. Weller S, Braun MC, Tan BK, Rosenwald A, Cordier C, Conley ME, et al.
Human blood IgM ‘memory’ B cells are circulating splenic marginal zone B cells harboring a prediversified immunoglobulin repertoire. Blood 2004;
104:3647-54.
15. Wolfram W, Sauerwein KM, Binder CJ, Eibl-Musil N, Wolf HM, Fischer MB. Pneumococcal polysaccharide vaccination elicits IgG anti-A/B blood group antibodies in healthy individuals and patients with type I diabetes mellitus. Front Immunol 2016;7:493.
16. Akoglu H. User’s guide to correlation coefficients. Turk J Emerg Med 2018;18:91-3.
17. Koo TY and Yang J. Current progress in ABO-incompatible kidney trans- plantation. Kidney Res Clin Pract 2015;34:170-9.
18. Aziz M, Holodick NE, Rothstein TL, Wang P. The role of B-1 cells in in- flammation. Immunol Res 2015;63:153-66.
19. Quách TD, Rodríguez-Zhurbenko N, Hopkins TJ, Guo X, Hernández AM, Li W, et al. Distinctions among circulating antibody-secreting cell populations, including B-1 cells, in human adult peripheral blood. J Im- munol 2016;196:1060-9.
20. Lee JG, Jang JY, Fang T, Xu Y, Yan JJ, Ryu JH, et al. Identification of human B-1 helper T cells with a Th1-like memory phenotype and high integrin CD49d expression. Front Immunol 2018;9:1617.
https://doi.org/10.3343/alm.2020.40.1.48 www.annlabmed.org Supplemental Data Fig. S1. Proportions of blood group A-specific B cell subsets. (A, B) The proportion of blood group A-specific B cells among each B cell subset before (A) and one year after (B) kidney transplantation. B cell subsets were classified into memory B2 cells (CD20+CD27+CD43−CD1c−), MZB cells (CD20+CD27+CD43−CD1c+), B1 cells (CD20+CD27+CD43+CD1c−), and MZ-B1 cells (CD20+CD27+ CD1c+CD43+). (C, D) The proportion of blood group A-specific B cells among each B cell subset before (C) and one year after (D) kidney transplantation. B cell subsets were classified into CD27−CD43− naïve B2 cells, CD27+CD43− memory B2 cells, CD27+CD43+ B1 cells, CD5+ B1 cells, CD11b+ B1 cells, and CD5+CD11b+ B cells. The results are expressed as the mean ±SEM; N =8 in the pre-transplant groups and N=10 in the post-transplant groups.
*P <0.05 compared with the naïve B2 cell group.
Abbreviations: MZB, marginal zone B cells; MZ-B1, marginal zone-B1 cells; SEM, standard error of the mean.
25
369Supplemental Data Figure S1. Proportions of blood group A-specific B cell subsets. (A – 370
B) The proportion of blood group A-specific B cells among each B cell subset before (A)
371and one yr after (B) kidney transplantation. B cell subsets were classified into memory B2
372cells (CD20
+CD27
+CD43
−CD1c
−), MZB cells (CD20
+CD27
+CD1c
+), B1 cells
373(CD20
+CD27
+CD43
+), and MZ-B1 cells (CD20
+CD27
+CD1c
+CD43
+). (C – D) The
374proportion of blood group A-specific B cells among each B cell subset before (C) and one yr
375A B
C D
CD5+
B1 CD5+
CD11b+ B1
Naïve B2 cells (CD20+CD27-CD43-) Memory B2 cells (CD20+CD27+CD43-) B1 cells (CD20+CD27+CD43+)
CD5+B1 cells (CD20+CD27+CD43+CD5+) CD11b+B1cells (CD20+CD27+CD43+CD11b+)
CD5+CD11b+B1 cells (CD20+CD27+CD43+CD5+CD11b+)
CD5+ CD11b+
B1