Glycogen Synthase Kinase 3 Inactivation Induces Cell Senescence through Sterol Regulatory Element Binding Protein 1-Mediated Lipogenesis in Chang Cells
You-Mie Kim1, Insun Song1, Yong-Hak Seo1,2, Gyesoon Yoon1,2
1Department of Biochemistry and Molecular Biology, Ajou University School of Medicine; 2Department of Biomedical Science, The Graduate School of Ajou University, Suwon, Korea
Background: Enhanced lipogenesis plays a critical role in cell senescence via induction of expression of the mature form of ste- rol regulatory element binding protein 1 (SREBP1), which contributes to an increase in organellar mass, one of the indicators of senescence. We investigated the molecular mechanisms by which signaling molecules control SREBP1-mediated lipogenesis and senescence.
Methods: We developed cellular models for stress-induced senescence, by exposing Chang cells, which are immortalized human liver cells, to subcytotoxic concentrations (200 μM) of deferoxamine (DFO) and H2O2.
Results: In this model of stress-induced cell senescence using DFO and H2O2, the phosphorylation profile of glycogen synthase kinase 3α (GSK3α) and β corresponded closely to the expression profile of the mature form of SREBP-1 protein. Inhibition of GSK3 with a subcytotoxic concentration of the selective GSK3 inhibitor SB415286 significantly increased mature SREBP1 ex- pression, as well as lipogenesis and organellar mass. In addition, GSK3 inhibition was sufficient to induce senescence in Chang cells. Suppression of GSK3 expression with siRNAs specific to GSK3α and β also increased mature SREBP1 expression and in- duced senescence. Finally, blocking lipogenesis with fatty acid synthase inhibitors (cerulenin and C75) and siRNA-mediated si- lencing of SREBP1 and ATP citrate lyase (ACL) significantly attenuated GSK3 inhibition-induced senescence.
Conclusion: GSK3 inactivation is an important upstream event that induces SREBP1-mediated lipogenesis and consequent cell senescence.
Keywords: Glycogen synthase kinase 3; Sterol regulatory element binding protein 1; Lipogenesis; Cell aging
INTRODUCTION
Cellular senescence is defined as a state in which normal so- matic cells lose their ability to divide, due to either prolonged cell division in culture or exposure to subcytotoxic stressors, thereby entering irreversible growth arrest [1]. In addition to
loss of replicative capacity, senescent cells display alterations in morphology, mass, and the dynamics of subcellular organ- elles [2-4]. For example, increases in cellular mass have been documented as a typical feature of senescence and are known to be associated with enlarged cell morphology. However, it is unclear which molecular events have critical roles in these
Received: 9 May 2013, Accepted: 14 July 2013 Corresponding author: Gyesoon Yoon
Department of Biochemistry and Molecular Biology, Ajou University School of Medicine, 206 World cup-ro, Yeongtong-gu, Suwon 443-721, Korea
Tel: +82-31-219-5054, Fax: +82-31-219-5059, E-mail: [email protected]
Copyright © 2013 Korean Endocrine Society
This is an Open Access article distributed under the terms of the Creative Com- mons Attribution Non-Commercial License (http://creativecommons.org/
licenses/by-nc/3.0/) which permits unrestricted non-commercial use, distribu- tion, and reproduction in any medium, provided the original work is properly cited.
features. An increase in the mass of any specific cellular com- partment has been suggested as a potential cause of senes- cence. For example, lysosomes have long been recognized to increase in both senescent and aged cells [5,6]. Increased mi- tochondrial mass has also been reported in stress-induced se- nescence systems [7,8]. These phenomena were thought to be the result of an accumulation of damaged organelles, because senescent lysosomes are known to be nonfunctional [9]. How- ever, the accumulation of indigestible organelles is not suffi- cient to explain the enlarged morphology observed in senes- cent cells. We suggested a more plausible explanation based on the results of our recent study, which found that enhanced lipogenesis in response to expression of sterol regulatory ele- ment binding protein 1 (SREBP1, also known as SREBF1) is involved in the increase in the organellar mass observed in se- nescent cells [10].
SREBP1 is a master transcription factor that regulates the expression of several lipogenic enzymes, including ATP citrate lyase (ACL), acetyl-CoA carboxylase (ACC), and fatty acid synthase (FAS) [11]. During lipid synthesis, ACL converts cy- tosolic citrate into acetyl-CoA and oxaloacetate, the essential metabolites for lipid biosynthesis, and ACC carboxylates ace- tyl-CoA to produce malonyl-CoA. FAS then condenses acetyl- CoA and malonyl-CoA to generate long-chain fatty acids.
Thus, activation of SREBP1 effectively enhances overall lipid biosynthesis, including fatty acid synthesis and the subsequent synthesis of triglycerides and membrane phospholipids. En- hanced lipogenesis provides the essential membrane compo- nents for the formation of subcellular organelles during cell growth [12,13]. SREBP1 is initially localized to the rough en- doplasmic reticulum (ER) membrane. Upon activation, it is cleaved to liberate the N-terminal fragment, which contains a basic helix-loop-helix leucine-zipper domain. The cleaved ac- tive fragment, called mature-form SREBP1 (mSREBP1), en- ters the nucleus, where it binds to specific sterol response ele- ments within the promoter regions of the lipogenic genes and activates their transcription [11,14]. Thus, SREBP1 is an ex- cellent target molecule for studies of cellular lipogenesis regu- lation.
Glycogen synthase kinase 3 (GSK3) is a serine/threonine kinase that is involved in the control of a wide range of cellu- lar metabolic processes, including insulin sensitivity, glucose metabolism, and cell survival, via regulation of energy homeo- stasis [15,16]. In addition, it is a multifunctional kinase that performs a regulatory role in diverse cellular functions, such as embryonic development, cellular protein synthesis, mitosis,
and survival [16-18]. GSK3 comprises two isoforms, GSK3α and GSK3β, which are negatively regulated by phosphoryla- tion (inactivation) at Ser21 (GSK3α) or Ser9 (GSK3β) by sev- eral protein kinases, such as AKT and p90 ribosomal S6 kinase [19]. Although the involvement of GSK3 inhibition in Wnt signaling implies that it has a role in cell proliferation and can- cer development [20,21], the death of GSK3β-null mice dur- ing embryogenesis as a result of liver degeneration caused by widespread hepatocyte apoptosis also suggests a contrasting role for GSK3, including participation in senescence-associat- ed growth suppression [22]. Recently, we reported that GSK3- mediated glycogenesis is involved in cell senescence [23], which directly supports the importance of GSK3 modulation in cell senescence. Based on these reports, we can place GSK3 downstream of the key insulin like growth factor-1 receptor (IGF-1R)/phosphoinositide 3-kinase (PI3K)/AKT signaling pathway, which is known to regulate cellular and organismal lifespans [24-28].
We previously reported that levels of the mature form of SREBP1 are commonly increased in Chang cells during cellu- lar senescence induced by several stimuli, including deferox- amine (DFO) and hydrogen peroxide (H2O2). Under these con- ditions, SREBP1-mediated lipogenesis is critically involved in cellular senescence [10]. However, it was unclear which signal- ing molecules control the SREBP1-mediated senescence that accompanies enhanced lipogenesis. Recently, GSK3 was shown to modulate SREBP1 activity through phosphorylation-mediat- ed ubiquitination [29]; this implies that GSK3 may play a key role as an upstream regulator in SREBP1-mediated senescence.
To address this, we first developed a model for stress-induced senescence by exposing Chang cells, which are immortalized human liver cells, to subcytotoxic concentrations (200 μM) of DFO and H2O2, as described previously [7,30]. By employing these senescence systems, we demonstrated that GSK3 is one of the major regulators of SREBP1-mediated lipogenesis, and its inactivation contributes to the increase in the organellar mass that is a typical characteristic of senescence. Our results suggest a novel molecular background for aging and aging-related pathophysiology.
METHODS
Cell culture, cell growth rate and generation of stress- induced senescence
Chang cells were purchased from the American Type Culture Collection (Rockville, MD, USA) and were cultured in Dul-
becco’s modified Eagle’s medium supplemented with 10% fe- tal bovine serum (GIBCO, Grand Island, NY, USA) and anti- biotics at 37°C in a humidified incubator with 5% CO2. Chang cells, an immortalized normal human hepatocyte line, were chosen to understand metabolic backgrounds related to stress- induced senescence.
To evaluate cellular growth rate, cells were harvested by trypsinization and counted with a hemocytometer after staining with 0.4% (w/v) trypan blue (GIBCO) to exclude dead cells.
The number of dead cells observed in the progress of the two different stress-induced senescence systems was not signifi- cant. The total cell number of trypan blue-negative live cells was determined upon completion of the experiments.
To generate stress-induced senescence, Chang cells were ex- posed to the subcytotoxic dose (200 µM) of DFO or H2O2 for the indicated periods, as described previously [7,30].
Estimation and visualization of subcellular organellar mass
To estimate cellular organellar mass, cells were stained with organelle-specific fluorescence dyes according to the manu- facturer’s instruction. Briefly, proper concentrations and incu- bation periods for each organelle were first determined. Mito- tracker Red CMXRos (100 nM, M7512, Molecular Probes, Eugene, OR, USA), Lyso Tracker Green DND-26 (1 µM, L7526, Molecular Probes), and ER Tracker Blue-White DPX (1 µM, E-12353, Molecular Probes) were applied for 30 min- utes at 37˚C. To stain Golgi body, cells were incubated for 30 minutes at 4˚C with 5 µM boron-dipyrromethene C5-ceramide (D3521, Molecular Probes) after preconjugating the dye with bovine serum albumin and were further incubated in fresh me- dium at 37˚C for 30 minutes. After staining cells with the dyes, cells were harvested in phosphate-buffered saline (PBS), and their fluorescence intensities were analyzed by flow cy- tometry (FACSCanto II, Becton Dickinson Corp., San Jose, CA, USA). Subcellular organellar masses are represented as mean value of arbitrary fluorescence units of 10,000 cells.
To confirm specific staining of subcellular organelles with the dyes, fluorescence images of the stained cells were visual- ized by Axiovert 200 M with a cooled AxioCam HRm operat- ed by the Axiovision 4.8 software (Carl Zeiss AG, Gottingen, Germany).
Determination of intracellular reactive oxygen species, cell size, and cell granularity
To estimate intracellular reactive oxygen species level, cells
were stained with 10 μM 2’,7’-dichlorodihydrofluorescein di- acetate (Molecular Probes) for 15 minutes at 37˚C before per- forming flow cytometric analysis with FACSCanto II (Becton Dickinson Corp.). Cell size and granularity were evaluated by analyzing forward scatter and side scatter of the stained cells, respectively, as previously described [10].
Thin layer chromatographic analysis of cellular lipids To analyze cellular lipid profiles, cellular lipids were extracted as described by Folch et al. [31] with slight modification.
Briefly, the indicated numbers of cells were harvested into glass tubes and mixed with 1 mL of chloroform:methanol (2:1). After vortexing, distilled water (500 μL) was added into the tubes and centrifuged at 1,500 rpm for 15 minutes. The lower chloroform phase was collected and backwashed by adding methanol (300 μL) and distilled water (300 μL). After removing the top layer, chloroform phase were concentrated by evaporating chloroform under N2 gas and were loaded onto thin layer chromatography (TLC) plate (no. 1.05721.0001, 20×20, silica-coated, Merk, Darmstadt, Germany).
To separate the cellular lipids, we used Kupke and Zeugner’s method [32] with a slight modification. Briefly, the chromato- gram was first developed in a saturated chamber with solvent I (chloroform:methanol:H2O, 65:30:5) to allow separation of po- lar lipids. The solvent front was allowed to migrate approxi- mately 10 cm from the bottom of the plate. After evaporating the solvents, the nonpolar lipids were separated by developing the chromatogram with the solvent II (n-hexane:diethyl ether:
acetic acid, 80:20:1.5) up to 1 cm from the top of the plate. The plates were dried under a stream of air and sprayed with primu- lin (Sigma, St Louis, MO, USA) solution (50 μg/mL in acetone :water, 80:20). The plates were dried again, and fluorescent lip- id spots were scanned on a UV transilluminator (SL-20, Seoul- in Scientific Co., Seoul, Korea) equipped with a camera (PC 1210, Canon Inc., Tokyo, Japan). The densities of lipid spots were estimated using Gel-Pro Analyzer 4.0 software (Media Cybernetics, Silver Spring, MD, USA). Standard lipids were obtained from Sigma: cholesteryl palmitate (CP; C6072), pal- mitate (PA; P5586), cholesterol (CL; C8667), cardiolipin (CA;
C0563), 1,2-diacyl-sn-glycero-3-phospho-L-serine (PS;
P7769), L-α-lysophosphatidylcholine (PC; L4129), and 3-sn- lyso phosphatidyl ethanolamine (PE; L4754).
Western blot analysis and antibodies
Cells were washed twice with PBS and lysed with lysis buffer (50 mM Tris-Cl, pH 7.5, 0.1 M NaCl, 1 mM ethylene diami-
netetraacetic acid, 1% [v/v] Triton X-100, 10 µg/mL each of aprotinin and leupeptin, and 1 mM phenyl methan sulfonyl fluoride. A portion (30 µg) of the lysate was applied to West- ern blot analysis as previously described [10]. Antibodies against SREBP1 (cat. 557036) and SREBP2 (cat. 557037) were purchased from BD Biosciences (San Jose, CA, USA), and antibody for α-tubulin (Ab-1) was from Oncogene (Bos- ton, MA, USA). Antibodies against FAS, ACC, and ACL were kindly provided by Prof. Kyung-Sup Kim (Yonsei University, Seoul, Korea). Antibodies against phosphor-GSK3α (pGSK3α, cat. 9337) and phosphor-GSK3β (pGSK3β, cat. 9336) were purchased from Cell Signaling (Beverly, MA, USA). Antibod- ies for GSK3 (sc-7291) and p21 (sc-397) were purchased from Santa Cruz Biotechnology (Santa Cruz, CA, USA). Antibody against Ab-1 (Oncogene) was used as the primary antibody.
The expression level of each protein was estimated by com- paring the band intensities exposed on X-ray film using Gel- Pro Analyzer 4.0 software.
Introduction of siRNA into cells
Oligonucleotides for GSK3α siRNA (5′-GAAAGACGAGCU UUACCUATT-3′), GSK3β siRNA (5′-CUCAAGAACUGU- CAAGUAATT-3′), SREBP1 siRNA #1 (5′-GGCCGAAGGCA GUGCAAGAT-T-3′), SREBP1 siRNA #2 (5′-CCGAAGGCAG UGCAAGAGATT-3′), ACL siRNA #1 (5′-CAAAAUAUGUG- GAGUAGUATT-3′), ACL siRNA #2 (5′-UGAAAUG-UCUUG UGUCUUATT-3′), and negative control siRNA (5′-UAGC- GACUAAACACAUCAA-3′) were produced by Samchully Pharm Co. (Seoul, Korea). siRNA duplexes were introduced into cells using Oligofectamine (Invitrogen, Grand Island, NY, USA) according to the manufacturer’s instruction.
Senescence-associated β-galactosidase assay
Senescence-associated β-galactosidase (SA-β-gal) activity was assayed at pH 6.0 as described previously [10]. Briefly, cells were washed twice with PBS, fixed to plates by 3.5% formal- dehyde for 5 minutes, and then incubated overnight in freshly prepared staining solution (40 mM citrate-phosphate buffer, pH 6.0, containing 1 mg/mL of 5-bromo-4-chloro-3-indolyl-β-D- galactopyranoside [X-gal, Sigma], 5 mM potassium ferrocya- nide, 5 mM potassium ferricyanide, 150 mM NaCl, and 2 mM MgCl2). The stains were visible 24 hours after incubation at 37˚C. By counting the numbers of the blue-stained and total cells using Image J software (NIH, Bethesda, MA, USA), per- centage of SA-β-gal positive cells was obtained to estimate the degree of cellular senescence.
RESULTS
GSK3 phosphorylation (inactivation) occurs prior to increased mSREBP1 levels during stress-induced senescence
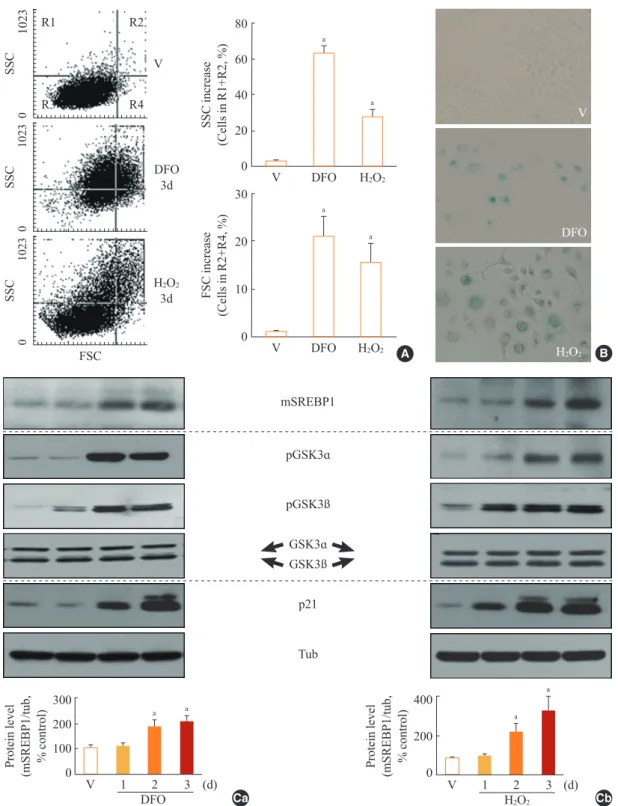
When Chang cells were exposed to 200 μM DFO or 200 μM H2O2, three typical senescence markers—increases in cell size, cellular granularity, and SA-β-gal activity—were clearly ob- served (Fig. 1A, B). Next, we monitored the expression profile of mSREBP1 and the phosphorylation status of GSK3 during stress-induced senescence. Phosphorylation of GSK3 increased before the increase in mSREBP1 levels in cells in which senes- cence was induced by either DFO or H2O2 (Fig. 1C). These re- sults imply that GSK3 inactivation may lead to increased mS- REBP1 protein levels by blocking the phosphorylation and degradation of mSREBP1. We further examined activation (phosphorylation) status of AKT and S6K to elucidate common upstream modulator of GSK3 in these senescence systems.
However, no common upstream signal to inactivate GSK3 was found in the two senescence systems (data not shown), imply- ing that diverse signals activated by different stimuli may con- verge on GSK3 phosphorylation (inactivation).
Pharmacological inhibition of GSK3 increases levels of mSREBP1 protein and lipogenesis
To investigate whether GSK3 inactivation leads to increased mSREBP1 expression during senescence, we employed SB - 41528, a selective pharmacological inhibitor of GSK3 [33].
GSK3 inhibition by SB415286 was associated with increased mSREBP1 expression (Fig. 2A) and induction of the SREBP1- targeting lipogenic enzymes FAS, cardiolipin synthase, ACC, and ACL (Fig. 2B).
To further evaluate whether GSK3 inhibition enhances cellular lipogenesis, we extracted total cellular lipids and separated them using TLC. As expected, the amount of total lipids (sum of the lip- ids indicated by numbers 1 to 5) (Fig. 2C) increased progressively during SB415286-induced senescence; on day 3, they were rough- ly twice as many compared to baseline measurements. Potential membrane lipids (sum of the lipids indicated by numbers 2 to 5):
PE, phosphatidyl serine [PS], CA, and CL) (Fig. 2C) comprised approximately 82% of the total lipids in control cells and increased by 179% in SB412586-induced senescent cells; over the same pe- riod, the amount of potential storage lipids (indicated by number 1, CP) (Fig. 2C) increased minimally. These results indicate that GS K3 inhibition enhances cellular lipogenesis through increased mS- REBP1 levels and transcriptional activity.
SSC 10230
R1 R2
R3 R4
V
01023SSC DFO
3d
01023SSC
FSC
H2O2
3d
SSC increase (Cells in R1+R2, %)
H2O2
V DFO
80
60
40
20
0
a
a
FSC increase (Cells in R2+R4, %)
H2O2
V DFO
30
20
10
0
a a
A
V
DFO
H2O2 B mSREBP1
pGSK3ɑ
pGSK3ß
GSK3ɑ
p21
Tub GSK3ß
300 200 100
Protein level (mSREBP1/tub, % control) 0
V 1 2 3DFO
a a
(d) Ca
Protein level (mSREBP1/tub, % control)
400
200
0
H2O2
V 1 2 3
a a
(d) Cb
Fig. 1. Increase in glycogen synthase kinase 3 (GSK3) phosphorylation and mature sterol regulatory element binding protein 1 (SREBP1) in stress-induced senescence. Chang cells were treated with 200 µM deferoxamine (DFO) or H2O2 for the indicated periods. Dimethyl sulfoxide (DMSO) was used as vehicle control (V). (A) Flow cytometric analysis of the cell distribution after treatment of the stressors (200 µM DFO or H2O2) for 3 days. Cell size and cell granularity were analyzed by comparing forward scatter (FSC; R2+R4) and side scat- ter (SSC; R1+R2). Representative profiles (left) and their analyses for cell granularity (SCC analysis, right upper) and cell size (FSC anal- ysis, right lower) are shown. (B) Representative images of senescence-associated β-galactosidase-positive cell populations are shown. (C) Western blot analysis. Quantitative analyses of the expression levels of SREBP1 mature form are shown in the lower panels. mSREBP1, mature-form SREBP1; pGSK, phosphor-GSK. aP<0.01 vs. V (DMSO control).
GSK3 inhibition leads to increased organellar mass and eventually induces senescence in Chang cells
As shown by the results in Fig. 2, GSK3 inhibition led to an increase in membrane lipids that was greater than the increase
in storage lipids. Therefore, we next examined whether the in- crease in membrane lipid production contributed to the forma- tion of cell organelles. When we monitored the mass of mem- branous organelles by flow cytometry after staining cells with
C V 1 2 3 mSREBP1
Tubulin p21
(d) 400
200
0
Protein level (mSREBP1/tub, % control)
C V 1 2 3
a b
(d) A FAS
ACC
V 1 2
ACL
CRLS
Tub
(d) B
PC V 1d 2d 3d
1
2 3
4 5
(×105 cells) CP
PA CL
CA PS PE
Std 1 3 10 1 3 10 1 3 10 1 3 10
Cellular lipids (% control)
1 2
V 1d 2d 3d
5 250
200
150
100
50
0
3 4
Cb Fig. 2. Glycogen synthase kinase 3 (GSK3) inhibition using SB415286, a specific GSK3 inhibitor, enhances cellular lipogenesis. Chang cells were treated with 7.5 μg/mL SB415286 for the indicated periods. Dimethyl sulfoxide (DMSO) was used as vehicle control (V). (A) Western blot analysis of protein expressions of mature sterol regulatory element binding protein 1 (SREBP1). Quantitative analyses of the expression levels of SREBP1 mature form are shown in the lower panels. (B) Western blot analyses for protein expressions of lipogenic enzymes, fatty acid synthase (FAS), acetyl-CoA carboxylase (ACC), ATP citrate lyase (ACL), and cardiolipin synthase (CRLS). (C) Cel- lular lipid profile of SB415286-treated cells was obtained by thin layer chromatography (TLC) as described in Methods. Representative TLC image (Ca) and quantitative estimation (Cb) of cellular lipids extracted from different numbers of cells are shown. Standard lipid mixture (Std) containing 10 μg each was used. Cholesteryl palmitate (CP, 1) belongs to nonpolar storage lipid, and cholesterol (CL, 2), cardiolipin (CA, 3), phosphatidyl choline (PC, 4) and phosphatidyl serine (PS, 5) belong to membrane lipids. ‘d’ in the x-axis stands for day. mSREBP1, mature-form SREBP1; PA, palmitate; PE, phosphatidyl ethanolamine. aP<0.01 vs. V (DMSO control).
Ca
Fluorescence (arbitrary unit, mean)
Mito tracker 80
60
40
20
0 V SB
a
Lyso tracker 40
30
20
10
0 V SB
a
ER tracker 50
40 30 20 10
0 V SB
a
BODIPY 160
120
80
40
0 V SB
a
Con
SB
A
50 40 30 20 10
0 V SB
a
SA-ß-gal (+) cells (% total)
V SB C
Ba 45
30
15
0 V SB
a
FSC increase (Cells in R2+R4, %)
40
20
0 V SB
a
SSC increase (Cells in R1+R2, %)
FSC 1023 Bb 0
SSC 10230
R1 R2
R4 V
FSC 1023
10230
0
SB
Fig. 3. Glycogen synthase kinase 3 (GSK3) inhibition induces senescence of Chang cell, accompanying an increase in cellular membra- nous organellar mass. Chang cells were treated with 7.5 μg/mL SB415286 (SB) for the indicated periods. Dimethyl sulfoxide (DMSO) was used as vehicle control (V). (A) Subcellular organellar masses were estimated by comparing the fluorescence intensities with flow cytometry after staining cells with organelle-specific dyes as described in Methods. Representative images of the fluorescence stained cells are shown in the lower panels. (B) Cell size and cell granularity were analyzed by comparing forward scatter (FSC; R2+R4) and side scatter (SSC; R1+R2). (Ba) Quantitative analyses for cell size (FSC analysis, left) and cell granularity (SSC analysis, right). (Bb) Representative cell distribution profiles are shown. (C) Quantitative analysis for senescence-associated β-galactosidase-positive cell populations (left) and representative images (right) are shown. ER, endoplasmic reticulum; BODIPY, boron-dipyrromethene. aP<0.01 vs. V (DMSO control).
organelle-specific fluorescence dyes, we found that levels of most intracellular organelles, including mitochondria, lyso- somes, ER, and Golgi, increased significantly during GSK3
inhibition-mediated senescence (Fig. 3A). We also observed enlarged cellular morphology, one of the characteristic signs of senescence, in SB415286-induced senescent cells in all of Fig. 4. Glycogen synthase kinase 3 (GSK3) knockdown induces senescence, accompanying an increase of mature-form sterol regulatory element binding protein 1 (mSREBP1) expression. Chang cells were transfected with si-GSK3α, si-GSK3β, and both si-GSK3α/β for 3 days. (A) Western blot analysis (Aa) and quantitative analysis (Ab) of mSREBP1 (mature form) levels. (B) (Ba) Cell growth rate. (Bb) Representative images (upper) and quantitative analysis of senescence-associated β-galactosidase-positive cell populations (lower) are shown. (C) Quantitative analyses for cell size (Ca, forward scatter; FSC analysis, left) and cell granularity (Cb, side scatter; SSC analy- sis, right). aP<0.05; bP<0.01 vs. negative control (NC).
600
400
200
0 C NC ɑ ß ɑ/ß
a
b b
Protein level (mSREBP1/tub, % com)
Ab
40
20
0 C NC ɑ ß ɑ/ß
b b
b
si-GSK3
SA-ß-gal (+) cells (% total cell)
si-NC si-GSK3 ɑ/ß
Bb
20 16 12 8 4
0 C NC ɑ ß ɑ/ß
b
b b
SSC
si-GSK3
SSC increase (cells in R2+R4, %)
Cb
C NC ɑ ß ɑ/ß
si-GSK3 mSREBP1
Tubulin GSK3ɑ GSK3ß
p21
Aa
25 20 15 10 5
0 C NC ɑ ß ɑ/ß
a b
b
si-GSK3
Cell number (×410 cells)
Ba
10 8 6 4 2
0 C NC ɑ ß ɑ/ß
si-GSK3 FSC
FSC increase (cells in R2+R4, %)
b b
b
Ca
si-GSK3
SA-ß-gel (+) cells (% total cell) 30
20
10
SB410 siRNA
NC SRE (#1) (#2)
- + + + + + 1 1 0.5 1 0.5 1
a
b b
b b
A
SB41:
siRNA:
(pmole)
SA-ß-gel (+) cells (% total cell)
40
30
20
10
0
NC ACL (#1) (#2)
- + + + + + 10 10 3 10 3 10
a
b b
b b
B
SA-ß-gel (+) cells (% total cell)
40
30
20
10
SB41:0 Inhibitor:
(nM) V Cer C75
- + + + + + - - 10 100 30 300
a
b b
b b
C Fig. 5. Sterol regulatory element binding protein 1 (SREBP1)-mediat- ed lipogenesis is the key event of glycogen synthase kinase 3 (GSK3) inhibition-induced senescence. Quantitative analysis of senescence- associated β-galactosidase-positive cell populations was used to evalu- ate the extent of senescence. (A) Chang cells (1×10⁴) seeded on 6-well plates were transfected with siRNAs for SREBP1 and then treated with 7.5 μg/mL SB415286 for 4 days. (B) Chang cells were transfected with siRNAs for ATP citrate lyase (ACL) and then treated with 7.5 μg/mL SB415286 for 4 days. (C) Chang cells were pretreated with the indicated concentrations of cerulenin (Cer; Sigma C2389) and C75 (Sigma 5490) for 24 hours and then further treated with 7.5 μg/mL SB415286 for 4 days. siRNA with a random sequence was used as the negative control (NC), and dimethyl sulfoxide was used as the vehicle control (V). aP<0.05; bP<0.01 vs. NC or V.
the images of cells incubated with organelle-specific stains (Fig. 3A, lower panels). We eventually confirmed that GSK3 inhibition by SB415286 induced senescence of Chang cells, as shown by increases in cell size and cell granularity and the pres- ence of SA-β-gal activity (Fig. 3B, C).
Next, we further examined whether specific knockdown of GSK3α and β would increase mSREBP1 expression and in- duce senescence. When we suppressed GSK3α and β expres- sion by siRNA-mediated knockdown, we observed a signifi- cant increase in mSREBP1 levels; a delay in the cell growth rate; and senescence phenotypes, such as increases in cell size and cell granularity and gain of SA-β-gal activity (Fig. 4).
These data confirm that GSK3 inactivation is linked to cell se- nescence, along with the accompanying enhanced lipogenesis and increased organellar mass.
SREBP1-mediated lipogenesis is critically involved in GSK3 inhibition-induced senescence of Chang cells Finally, we investigated whether inhibition of lipogenesis could reverse GSK3 inhibition-induced senescence. Knock- down of SREBP1 or ACL expression effectively attenuated the SA-β-gal activity induced by GSK3 inhibition (Fig. 5A, B). Moreover, inhibition of lipid synthesis with the FAS inhib- itors cerulenin and C75 [34,35] also attenuated GSK3 inhibi- tion-induced senescence (Fig. 5C). These data demonstrate that GSK3 inactivation is an upstream event that induces cel- lular senescence in Chang cells via SREBP1-mediated lipo- genesis. In addition, our results also show that the axis of GSK3/SREBP1/lipogenesis is associated with increased or- ganellar mass, an important indicator of senescence.
DISCUSSION
In this study, we clearly demonstrate that inactivation of GSK3 is critically involved in enhanced lipogenesis mediated by SREBP1 and thereby contributes to the increase in organellar mass that is a typical characteristic of senescence. We also found that GSK3 inactivation induces the senescence of Chang cells through SREBP1-mediated lipogenesis. Our results con- firm the role of GSK3 as a key metabolic controller that is closely associated with the metabolic phenotype of senescence, and they suggest a novel molecular background for aging and aging-related pathophysiology.
We previously reported that GSK3-mediated glycogenesis is critically involved in cell senescence [23]; in the present study, we confirmed the role of GSK3 inactivation in lipogenesis-as-
sociated cell senescence. Both glycogenesis and lipogenesis are cellular anabolic processes, but their cellular functions are quite different: the former process stores energy, and the latter generates new cellular components. Glycogenesis may occur as the result of minimal use of energy due to the irreversible ar- rest of cell growth in senescence, while lipogenesis may be a passive cellular defense that is used to maintain the total num- ber of normal cellular organelles in response to organellar dam- age by senescent stress. However, it is also clear that enhance- ment of both glycogenesis and lipogenesis act as major con- tributors of senescence, respectively, as evidenced by the facts that knockdown of glycogen synthase blocked glycogenesis- associated senescence induced by GSK3 knockdown [23] and overexpression of mSREBP1 alone induced senescence [10].
Therefore, these metabolic phenotypes may be double-edged swords for senescence, acting as both a cause of senescence (metabolic stressor) and a consequence of senescence (defen- sive response).
There is another important question that remains to be an- swered: why does senescence enhance such different anabolic processes through inactivation of the single kinase GSK3?
Moreover, a recent study suggested yet another role for GSK3 in cell functioning, in which GSK3 inactivation provokes and maintains oxidative stress by triggering mitochondrial respira- tory defects [36]. Together, these results imply that GSK3 is a common regulator that activates anabolic processes and inhib- its catabolic processes in mitochondria, and they emphasize the role of GSK3 as a metabolic switch to control cell senes- cence.
GSK3 has long been known as a negative regulator of gly- cogen synthesis in response to insulin [17,18]. In addition, GSK3 inhibition was reported to improve insulin resistance by enhancing insulin action in rat skeletal muscle [37], and GSK3 inhibitors, including SB415286, have been developed as drugs for the disease [33]. Contrary to our results, these reports sup- port the protective role of GSK3 inactivation in insulin resis- tance, an aging-associated disease. On the other hand, an insu- lin or insulin-like signaling cascade, involving IGF-1 receptor, IRS, PI3K, and AKT, has also been implicated in the control of organismal lifespan and senescence [25,38,39], well sup- porting that GSK3, one of the major downstream targets of the insulin signal cascade, may participate in senescence. There- fore, at the present stage, it seems that GSK3 has two oppos- ing actions in modulating senescence and alleviating insulin resistance. Nevertheless, one may argue that the concentration (7.5 μg/mL) of SB415286 used in our study was so high that
cells were placed in a stress condition. In our previous study, we repeatedly applied a low dose of SB415286 (3.6 μg/mL) to mimic the effect of continuous daily application of the drugs in vivo [23]. Three repeated daily applications with the low dose SB415286 were enough to induce senescence pheno- types, whereas a single treatment of low dose (3.6 μg/mL) SB 415286 did not. Collectively, our results may raise awareness of employing GSK3 modulation in therapeutic approach of in- sulin resistance.
In conclusion, our results provide support for an important role for GSK3 in the modulation of SREBP1-mediated lipo- genesis and senescence and in the regulation of increases in cellular mass, a phenotype typical of senescence. However, details of the mechanism by which GSK3 controls SREBP1 activity remain unclear, although a recent study indicated that phosphorylation-mediated ubiquitination is involved in the control of SREBP1 activity by GSK3, and that FBw7 is a ubiquitin ligase for SREBP1 [29]. We are currently exploring whether the senescence-associated increase in mSREBP1 ex- pression is the result of blocking Fbw7-mediated ubiquitina- tion or whether it is the result of increased transcriptional acti- vation and/or activated maturation.
CONFLICTS OF INTEREST
No potential conflict of interest relevant to this article was re- ported.
ACKNOWLEDGMENTS
This work was supported by the National Research Founda- tion of Korea (NRF) grant funded by the Korea government (MSIP) (NRF-2012R1A5A2048183).
REFERENCES
1. Campisi J, Kim SH, Lim CS, Rubio M. Cellular senes- cence, cancer and aging: the telomere connection. Exp Gerontol 2001;36:1619-37.
2. Cristofalo VJ, Kritchevsky D. Cell size and nucleic acid content in the diploid human cell line WI-38 during aging.
Med Exp Int J Exp Med 1969;19:313-20.
3. Greenberg SB, Grove GL, Cristofalo VJ. Cell size in aging monolayer cultures. In Vitro 1977;13:297-300.
4. Hwang ES, Yoon G, Kang HT. A comparative analysis of the cell biology of senescence and aging. Cell Mol Life Sci
2009;66:2503-24.
5. De Priester W, Van Manen R, Knook DL. Lysosomal ac- tivity in the aging rat liver: II. morphometry of acid phos- phatase positive dense bodies. Mech Ageing Dev 1984;
26:205-16.
6. Lipetz J, Cristofalo VJ. Ultrastructural changes accompa- nying the aging of human diploid cells in culture. J Ultra- struct Res 1972;39:43-56.
7. Yoon YS, Yoon DS, Lim IK, Yoon SH, Chung HY, Rojo M, Malka F, Jou MJ, Martinou JC, Yoon G. Formation of elongated giant mitochondria in DFO-induced cellular se- nescence: involvement of enhanced fusion process through modulation of Fis1. J Cell Physiol 2006;209:468-80.
8. Goldstein S, Moerman EJ, Porter K. High-voltage electron microscopy of human diploid fibroblasts during ageing in vitro. Morphometric analysis of mitochondria. Exp Cell Res 1984;154:101-11.
9. Schmucker DL, Sachs H. Quantifying dense bodies and li- pofuscin during aging: a morphologist’s perspective. Arch Gerontol Geriatr 2002;34:249-61.
10. Kim YM, Shin HT, Seo YH, Byun HO, Yoon SH, Lee IK, Hyun DH, Chung HY, Yoon G. Sterol regulatory element- binding protein (SREBP)-1-mediated lipogenesis is in- volved in cell senescence. J Biol Chem 2010;285:29069- 77.
11. Horton JD, Shah NA, Warrington JA, Anderson NN, Park SW, Brown MS, Goldstein JL. Combined analysis of oli- gonucleotide microarray data from transgenic and knock- out mice identifies direct SREBP target genes. Proc Natl Acad Sci U S A 2003;100:12027-32.
12. Demoulin JB, Ericsson J, Kallin A, Rorsman C, Ronnstrand L, Heldin CH. Platelet-derived growth factor stimulates membrane lipid synthesis through activation of phosphati- dylinositol 3-kinase and sterol regulatory element-binding proteins. J Biol Chem 2004;279:35392-402.
13. Porstmann T, Santos CR, Lewis C, Griffiths B, Schulze A.
A new player in the orchestra of cell growth: SREBP activ- ity is regulated by mTORC1 and contributes to the regula- tion of cell and organ size. Biochem Soc Trans 2009;37(Pt 1):278-83.
14. Horton JD, Goldstein JL, Brown MS. SREBPs: activators of the complete program of cholesterol and fatty acid syn- thesis in the liver. J Clin Invest 2002;109:1125-31.
15. Cross DA, Alessi DR, Cohen P, Andjelkovich M, Hemmings BA. Inhibition of glycogen synthase kinase-3 by insulin me- diated by protein kinase B. Nature 1995;378:785-9.
16. Embi N, Rylatt DB, Cohen P. Glycogen synthase kinase-3 from rabbit skeletal muscle. Separation from cyclic-AMP- dependent protein kinase and phosphorylase kinase. Eur J Biochem 1980;107:519-27.
17. Forde JE, Dale TC. Glycogen synthase kinase 3: a key reg- ulator of cellular fate. Cell Mol Life Sci 2007;64:1930-44.
18. Rylatt DB, Aitken A, Bilham T, Condon GD, Embi N, Co- hen P. Glycogen synthase from rabbit skeletal muscle.
Amino acid sequence at the sites phosphorylated by glyco- gen synthase kinase-3, and extension of the N-terminal se- quence containing the site phosphorylated by phosphory- lase kinase. Eur J Biochem 1980;107:529-37.
19. Bain J, Plater L, Elliott M, Shpiro N, Hastie CJ, McLauch- lan H, Klevernic I, Arthur JS, Alessi DR, Cohen P. The se- lectivity of protein kinase inhibitors: a further update. Bio- chem J 2007;408:297-315.
20. Huang W, Chang HY, Fei T, Wu H, Chen YG. GSK3 beta mediates suppression of cyclin D2 expression by tumor suppressor PTEN. Oncogene 2007;26:2471-82.
21. Shakoori A, Ougolkov A, Yu ZW, Zhang B, Modarressi MH, Billadeau DD, Mai M, Takahashi Y, Minamoto T. De- regulated GSK3beta activity in colorectal cancer: its asso- ciation with tumor cell survival and proliferation. Biochem Biophys Res Commun 2005;334:1365-73.
22. Hoeflich KP, Luo J, Rubie EA, Tsao MS, Jin O, Woodgett JR. Requirement for glycogen synthase kinase-3beta in cell survival and NF-kappaB activation. Nature 2000;406:
86-90.
23. Seo YH, Jung HJ, Shin HT, Kim YM, Yim H, Chung HY, Lim IK, Yoon G. Enhanced glycogenesis is involved in cellular senescence via GSK3/GS modulation. Aging Cell 2008;7:894-907.
24. Bartke A. Mutations prolong life in flies: implications for ag- ing in mammals. Trends Endocrinol Metab 2001;12:233-4.
25. Holzenberger M, Dupont J, Ducos B, Leneuve P, Geloen A, Even PC, Cervera P, Le Bouc Y. IGF-1 receptor regulates lifespan and resistance to oxidative stress in mice. Nature 2003;421:182-7.
26. Kimura KD, Tissenbaum HA, Liu Y, Ruvkun G. daf-2, an insulin receptor-like gene that regulates longevity and dia- pause in Caenorhabditis elegans. Science 1997;277:942-6.
27. Tatar M, Kopelman A, Epstein D, Tu MP, Yin CM, Garo- falo RS. A mutant Drosophila insulin receptor homolog that extends life-span and impairs neuroendocrine func- tion. Science 2001;292:107-10.
28. Tissenbaum HA, Ruvkun G. An insulin-like signaling
pathway affects both longevity and reproduction in Cae- norhabditis elegans. Genetics 1998;148:703-17.
29. Punga T, Bengoechea-Alonso MT, Ericsson J. Phosphory- lation and ubiquitination of the transcription factor sterol regulatory element-binding protein-1 in response to DNA binding. J Biol Chem 2006;281:25278-86.
30. Yoon YS, Byun HO, Cho H, Kim BK, Yoon G. Complex II defect via down-regulation of iron-sulfur subunit induces mitochondrial dysfunction and cell cycle delay in iron che- lation-induced senescence-associated growth arrest. J Biol Chem 2003;278:51577-86.
31. Folch J, Lees M, Sloane-Stanley GH. A simple method for the isolation and purification of total lipides from animal tissues. J Biol Chem 1957;226:497-509.
32. Kupke IR, Zeugner S. Quantitative high-performance thin- layer chromatography of lipids in plasma and liver homog- enates after direct application of 0.5-microliter samples to the silica-gel layer. J Chromatogr 1978;146:261-71.
33. Coghlan MP, Culbert AA, Cross DA, Corcoran SL, Yates JW, Pearce NJ, Rausch OL, Murphy GJ, Carter PS, Rox- bee Cox L, Mills D, Brown MJ, Haigh D, Ward RW, Smith DG, Murray KJ, Reith AD, Holder JC. Selective small molecule inhibitors of glycogen synthase kinase-3 modu- late glycogen metabolism and gene transcription. Chem
Biol 2000;7:793-803.
34. Omura S. The antibiotic cerulenin, a novel tool for bio- chemistry as an inhibitor of fatty acid synthesis. Bacteriol Rev 1976;40:681-97.
35. Pizer ES, Chrest FJ, DiGiuseppe JA, Han WF. Pharmaco- logical inhibitors of mammalian fatty acid synthase sup- press DNA replication and induce apoptosis in tumor cell lines. Cancer Res 1998;58:4611-5.
36. Byun HO, Jung HJ, Seo YH, Lee YK, Hwang SC, Hwang ES, Yoon G. GSK3 inactivation is involved in mitochon- drial complex IV defect in transforming growth factor (TGF) β1-induced senescence. Exp Cell Res 2012;318:
1808-19.
37. Dokken BB, Sloniger JA, Henriksen EJ. Acute selective glycogen synthase kinase-3 inhibition enhances insulin signaling in prediabetic insulin-resistant rat skeletal mus- cle. Am J Physiol Endocrinol Metab 2005;288:E1188-94.
38. Kenyon C. The plasticity of aging: insights from long- lived mutants. Cell 2005;120:449-60.
39. Miyauchi H, Minamino T, Tateno K, Kunieda T, Toko H, Komuro I. Akt negatively regulates the in vitro lifespan of human endothelial cells via a p53/p21-dependent pathway.
EMBO J 2004;23:212-20.